

Aurora Kinase A proximity map reveals centriolar satellites as regulators of its ciliary function
- PMID: 34169630
- PMCID: PMC8339716
- DOI: 10.15252/embr.202051902
Aurora Kinase A proximity map reveals centriolar satellites as regulators of its ciliary function
Abstract
Aurora kinase A (AURKA) is a conserved kinase that plays crucial roles in numerous cellular processes. Although AURKA overexpression is frequent in human cancers, its pleiotropic functions and multifaceted regulation present challenges in its therapeutic targeting. Key to overcoming these challenges is to identify and characterize the full range of AURKA interactors, which are often weak and transient. Previous proteomic studies were limited in monitoring dynamic and non-mitotic AURKA interactions. Here, we generate the proximity interactome of AURKA in asynchronous cells, which consists of 440 proteins involving multiple biological processes and cellular compartments. Importantly, AURKA has extensive proximate and physical interactions to centriolar satellites, key regulators of the primary cilium. Loss-of-function experiments identify satellites as negative regulators of AURKA activity, abundance, and localization in quiescent cells. Notably, loss of satellites activates AURKA at the basal body, decreases centrosomal IFT88 levels, and causes ciliogenesis defects. Collectively, our results provide a resource for dissecting spatiotemporal regulation of AURKA and uncover its proteostatic regulation by satellites as a new mechanism for its ciliary functions.
Keywords: Aurora Kinase A; BioID; centriolar satellites; centrosome; primary cilium.
© 2021 The Authors. Published under the terms of the CC BY NC ND 4.0 license.
Conflict of interest statement
The authors declare that they have no conflict of interest.
Figures

Experimental workflow for the BioID experiment. HEK293T cells stably expressing V5‐BirA*‐AURKA and V5‐BirA* were treated with 50 μM biotin for 18 h, harvested, and lysed by denaturing lysis. Biotinylated proteins were captured with streptavidin affinity beads and analyzed by mass spectrometry.
V5‐BirA*‐AURKA is expressed at near endogenous levels in the stable line. HEK293T cells and HEK293T::V5‐BirA*‐AURKA lysates were immunoblotted with antibodies against V5, AURKA, and vinculin (loading control).
Biotinylation of the centrosome and microtubules by V5‐BirA*‐AURKA in different cell cycle stages. After 18‐h biotin incubation, HEK293T::V5‐BirA*‐AURKA were fixed and stained for the fusion protein with V5 antibody, biotinylated proteins with the fluorescent streptavidin, and the centrosome with gamma‐tubulin antibody. DNA was stained with DAPI. Scale bar, 5 μm.
Control and biotin‐treated HEK293T cells stably expressing V5‐BirA* and V5‐BirA*‐AURKA were lysed, and biotinylated proteins were precipitated by streptavidin beads. The initial sample (initial) and captured biotinylated proteins (pulldown) were run on an SDS gel and immunoblotted with the fluorescent streptavidin and antibodies against V5 and vinculin (loading control).
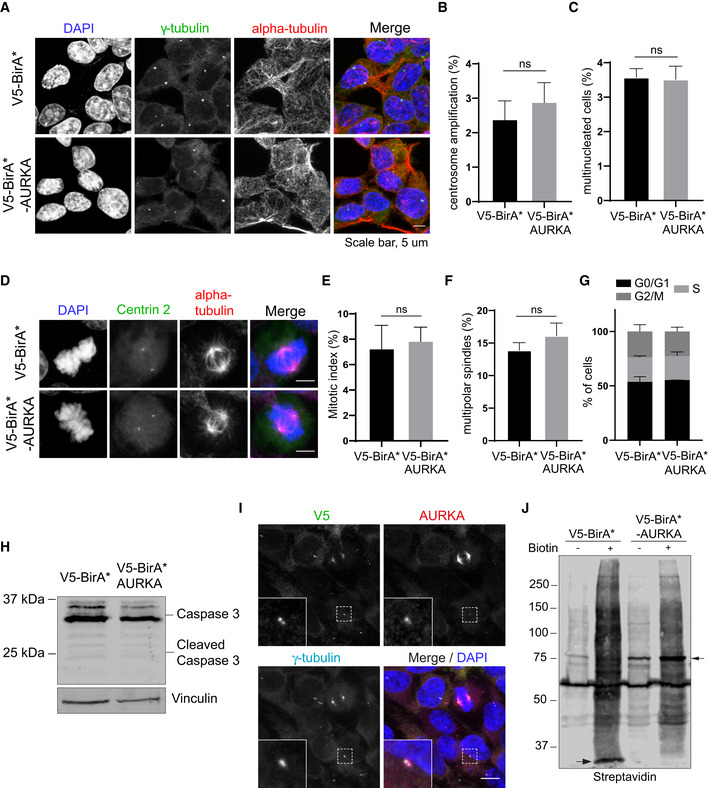
- A
Representative immunofluorescence images of HEK293T::V5‐BirA*‐AURKA fixed and stained for gamma‐tubulin, alpha‐tubulin, and DAPI. Centrosome number higher than 2 was quantified as “centrosome amplification”. Cells with more than one nucleus were quantified as “multinucleated”). Scale bar, 5 μm
- B, C
Quantification for (B) centrosome amplification and (C) multinucleation for A. Data represent mean value from two experiments per condition ± SEM (ns: non‐significant, unpaired Student's t‐test). n > 100 cells per experiment.
- D
Representative immunofluorescence images of mitotic HEK293T::V5‐BirA*‐AURKA fixed and stained for centrin 2 (centrioles), alpha‐tubulin, and DAPI. Scale bar, 5 μm.
- E, F
Quantification for (E) mitotic index (F) percentage of multipolar spindles for D. Data represent mean value from two experiments per condition ± SEM (ns: non‐significant, unpaired Student's t‐test). n > 100 cells per experiment.
- G
Cell cycle analysis of asynchronous HEK293T::V5‐BirA*‐AURKA cells. Cells were fixed and stained with propidium iodide (PI) and in flow cytometer. Data represent mean value from two experiments per condition ± SEM (ns: non‐significant, unpaired Student's t‐test).
- H
Relative expression of Caspase3 in control cells andHEK293T::V5‐BirA*‐AURKA cells. Cells were lysed and immunoblotted with antibodies against Caspase3 and vinculin (loading control).
- I
Representative images of HEK293T::V5‐BirA*AURKA cells stained for V5, AURKA, and gamma‐tubulin. DNA was stained with DAPI. Scale bar is 10 μm.
- J
Expression and biotinylation of BirA* (control) and BirA*‐AURKA in the absence and the presence of biotin (50 μM biotin, 18 h). Cells were lysed, run on an SDS–PAGE gel, and immunoblotted with streptavidin. Arrows indicate the bait proteins V5‐BirA* and V5‐BirA*‐AURKA.
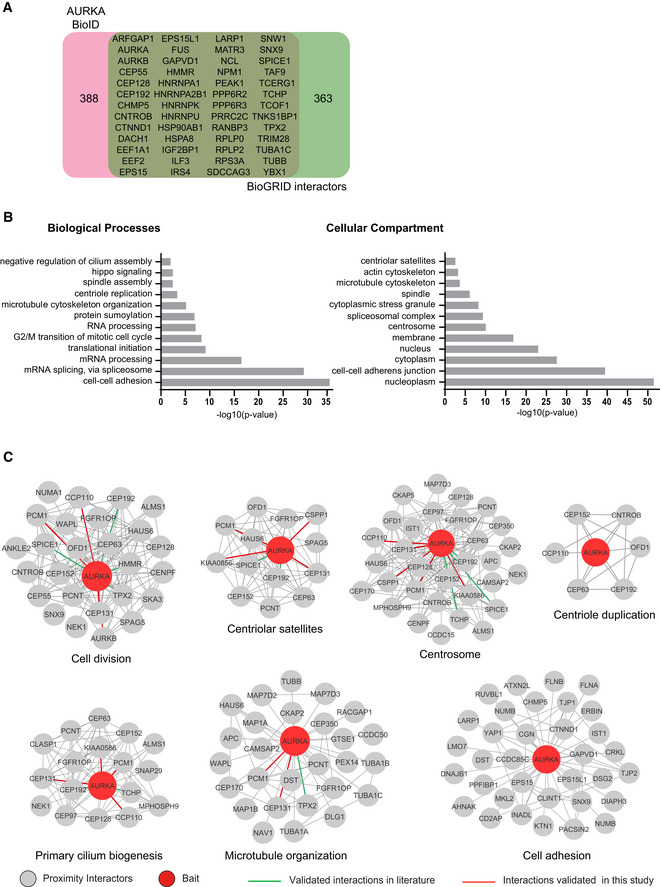
AURKA proximity interactome consists of both overlapping and distinct interactors with the published AURKA interactors. AURKA proximity interactome was compared with published physical interactors/substrates and proteins curated from the BioGRID repository. Venn diagram shows the identity of the overlapping 52 proteins and the number of proteins specific to the AURKA proximity interactome and BioGRID dataset.
GO‐enrichment analysis of the AURKA proximity interactors based on their biological process and cellular compartment. The x‐axis represents the log‐transformed p‐value (Fisher’s exact test) of GO terms.
Sub‐interaction networks of AURKA based on biological process and cellular compartment. The AURKA proximity interactors were grouped using DAVID functional annotation tool and literature mining. The interaction networks visualized for the biological processes include cell cycle, centriole duplication, primary cilium biogenesis, microtubule organization, and cell adhesion. The interaction networks visualized for cellular compartments include the centrosome and the centriolar satellites. The interconnectedness among the proteins of each network was determined by the STRING database. Edges in green color indicate the published physical AURKA interactors/substrates, and edges in red color indicate the proximate interactors validated in this study.
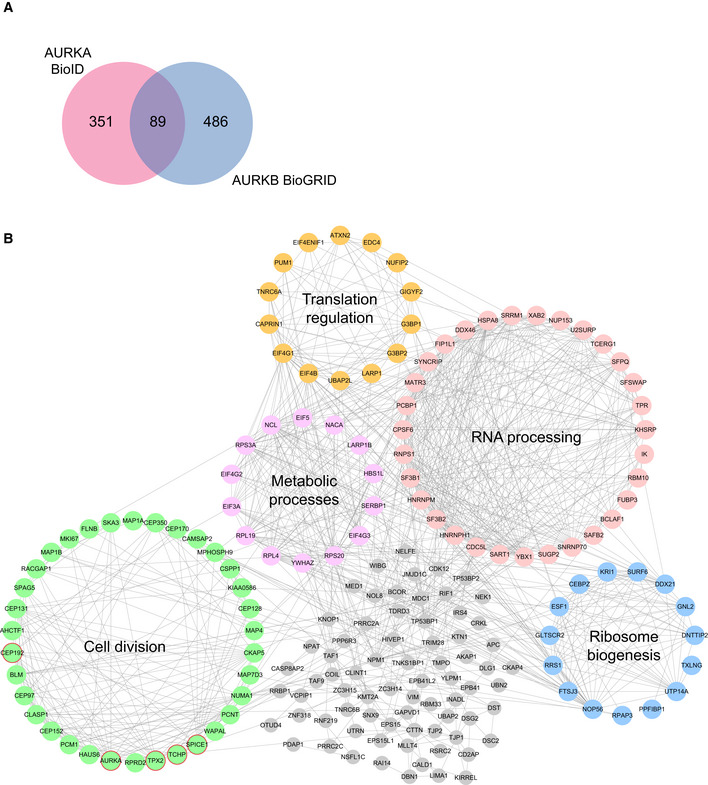
Comparison of AURKA proximity interactome with Aurora Kinase B (AURKB) interactors derived from BioGRID. Pink circle indicates the AURKA proximity interactome, and blue circle indicates AURKB interactome.
High‐confidence proximity interactors of AURKA were determined using SAINT analysis. AURKA proximity interactors were ranked by their fold change in the V5‐BirA*‐AURKA dataset relative to V5‐BirA*‐dataset. The first 200 proteins were visualized in CytoScape, and the functional clusters were determined by combining STRING analysis with the ClusterONE plug‐in. Five functional clusters were enriched in the interactome, which include cell cycle (green), RNA processing (pink), ribosome biogenesis (blue), translation regulation (yellow) metabolic processes (purple). Uncategorized interactors are shown in gray, and the published interactors are shown in red circles.
- A, B
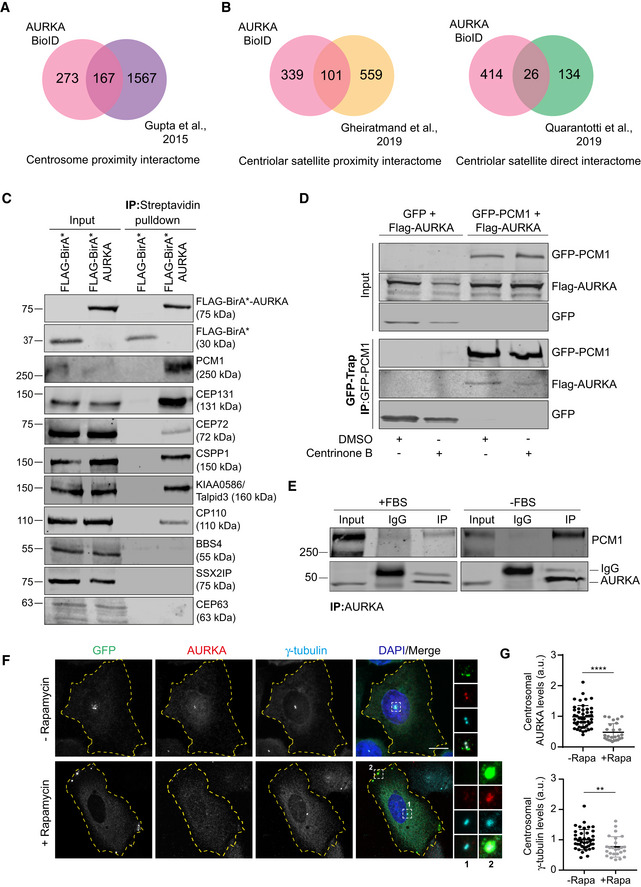
Comparison of the AURKA proximity interactome with the proximity interactome of the centrosome (Gupta et al, 2015), the proximity interactome of centriolar satellites (Gheiratmand et al, 2019), and the physical interactome of centriolar satellites (Quarantotti et al, 2019).
- C
AURKA interacts with the centriolar satellite proteins PCM1, CEP131, CEP72, CSPP1, KIAA0586/Talpid3, and CP110. HEK293T cells were transiently transfected with FLAG‐BirA* or FLAG‐BirA*‐AURKA. Following 18‐h biotin incubation, cells were lysed, and biotinylated proteins were precipitated by streptavidin beads. The initial sample and immunoprecipitated biotinylated proteins were run on a gel and immunoblotted with fluorescent streptavidin and antibodies against FLAG, CEP72, CEP131, PCM1, CEP63, CSPP1, KIAA0586/Talpid3, CP110, BBS4, and SSX2IP.
- D
AURKA interacts with PCM1 in centriole‐less cells. GFP‐PCM1 or GFP‐PCM1 was co‐expressed with FLAG‐AURKA in HEK293T cells treated with DMSO (control) or 500 nM centrinone B for 7 days. Complexes were precipitated with GFP‐Trap beads. The initial sample and immunoprecipitated proteins were run on a gel and immunoblotted with antibodies against GFP and FLAG.
- E
Endogenous interaction of PCM1 and AURKA. Lysates from synchronous and serum‐starved HEK293T were immunoprecipitated with AURKA antibody and rabbit IgG control. The initial sample and immunoprecipitated proteins were run on a gel and immunoblotted with antibodies against PCM1 and AURKA.
- F
AURKA co‐localize with PCM1 at the peripheral satellite clusters upon chemical dimerization of satellites with Kif5b motor domain. U2OS cells were co‐transfected with GFP‐PCM1‐FKBP and HA‐Kif5b(1–269 a.a.)‐FRB and treated with 500 nM rapamycin for 1 h followed by fixation at 6 h. Cells that were not treated with rapamycin were processed in parallel as a control. Fixed cells were stained with antibodies against GFP, AURKA, and gamma‐tubulin. DNA was stained with DAPI. Cell edges are outlined. Scale bar, 10 μm.
- G
Quantification of pericentrosomal levels of AURKA and gamma‐tubulin for F. n > 25 cells per experiment. Data represent mean value from two experiments per condition ± SEM (****P < 0.0001; **P < 0.01; unpaired Student's t‐test.).
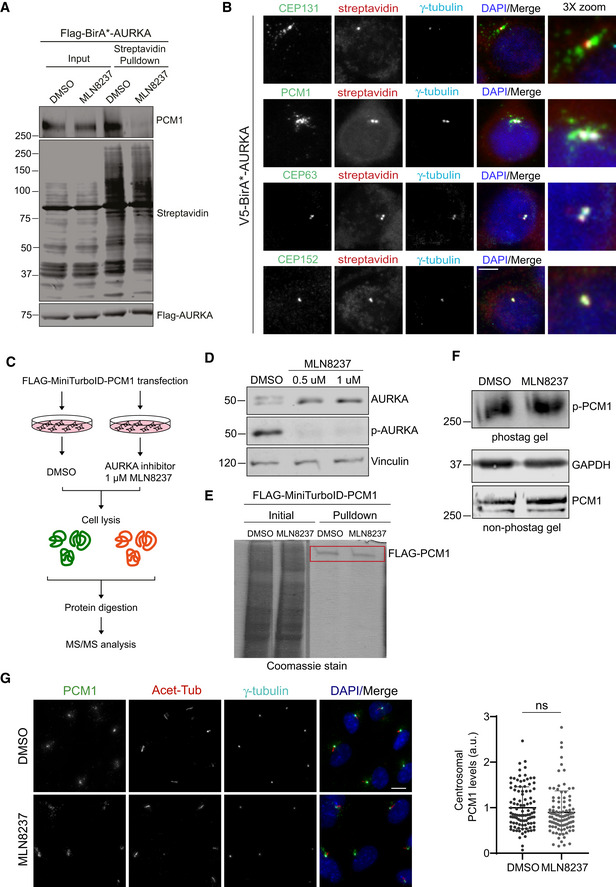
AURKA activity is required for its interaction with PCM1. HEK293T cells were transfected with FLAG‐BirA*‐AURKA. 24 h post‐transfection, cells were treated with DMSO+biotin or MLN8237+biotin, lysed, and biotinylated proteins were precipitated by streptavidin beads. The initial sample and precipitated proteins were run on an SDS–PAGE gel and immunoblotted for streptavidin, FLAG, and PCM1.
Localization of V5‐BirA*‐AURKA relative to markers of the centrosome and centriolar satellites. HEK293T::V5‐BirA*‐AURKA cells were incubated with 50 μM biotin for 18 h and immunostained with fluorescent streptavidin and antibodies against CEP63, CEP152, CEP131, and PCM1. DNA was stained with DAPI. Scale bar, 5 μm.
Experimental workflow for quantitative phosphoproteomics. HEK293T cells were transfected with FLAG‐PCM1 (4 × 15 cm plates), treated either DMSO (vehicle control) or 1 μM MLN8237. Following cell lysis and FLAG pulldown, FLAG‐PCM1 was excised, digested with trypsin, and analyzed by mass spectrometry.
Validation of AURKA inhibition upon MLN8237 treatment. Cells were treated with DMSO, 0.5 μM MLN8237 and 1 μM MLN8237, lysed, run on an SDS–PAGE, and immunoblotted with antibodies against AURKA, p‐AURKA, and vinculin (loading control).
Coomassie gel image of FLAG‐PCM1 pulldown. The rectangle indicates the corresponding band excised for mass spectrometry.
Phos‐tag and non‐phos‐tag immunoblots of cells were treated with DMSO (vehicle) or 1 μM MLN8237. Cells were lysed and immunoblotted for PCM1 and GAPDH.
Representative images and quantification of pericentrosomal levels of PCM1. RPE1 cells were treated with 0.5 μM MLN8237, fixed, and immunostained with PCM1, acetylated tubulin, and gamma‐tubulin. Centrosomal AURKA and p‐AURKA fluorescence intensities were measured from maximum projections, and average means of the levels in control cells were normalized to 1. Data represent mean value from two experiments per condition ± SEM (ns: non‐significant, unpaired Student's t‐test). n > 100 cells per experiment Scale bar, 5 μm.

Immunoblotting analysis of PCM1 depletion by RNAi. RPE1 cells were transfected with control or PCM1 siRNA #1 and #2 for 72 h. Cells were lysed and immunoblotted with PCM1 and Actin (loading control). Band intensities for immunoblots were quantified from two experimental replicates. Scale bar, 5 μm.
Immunofluorescence analysis of PCM1 depletion and loss of satellites by RNAi. RPE1 cells were transfected with control or PCM1 siRNA #1 and #2 for 72 h. Cells were fixed and stained with PCM1, gamma‐tubulin, and DNA. DNA was stained with DAPI. Scale bar, 10 μm.
Confirmation of CCDC66 depletion by RNAi and quantification of AURKA and p‐AURKA levels upon CCDC66 depletion. RPE1 cells were transfected with control or CCDC66 siRNA for 72 h. Cells were lysed and immunoblotted for AURKA, p‐AURKA, CCDC66, vinculin (loading control), and alpha‐tubulin (loading control).
Depletion of PCM1 in RPE1 GFPCCDC66 line. RPE1 cells were transfected with control or PCM1 siRNA 72 h. Cells were fixed and immunostained with GFP, PCM1, and centrin3. DNA was stained with DAPI. Scale bar, 10 μm.
Total AURKA in control and RPE1 PCM1 KO cells. RPE1 WT and RPE1 PCM1 KO cells were serum‐starved for 24 h, cell lysates were prepared and run on an SDS–PAGE gel. Proteins were detected by immunoblotting with antibodies against AURKA and vinculin (loading control). The band intensities were measured from two replicates (unpaired Student's t‐test).
Representative images and quantification of basal body levels of AURKA and phospho‐AURKA (p‐AURKA) in control and RPE1 PCM1 KO cells. Following 24 h serum starvation, cells were fixed and stained with the indicated antibodies and DAPI. Scale bar, 10 μm.
Quantification of AURKA and p‐AURKA levels in RPE1 WT and PCM1 KO cells for G. Centrosomal AURKA and p‐AURKA fluorescence intensities were measured from maximum projections, and average means of the levels in control cells were normalized to 1. n > 100 cells per experiment. Data represent mean value from two experiments per condition ± SEM (**P < 0.01, ns: non‐significant, unpaired Student's t‐test).
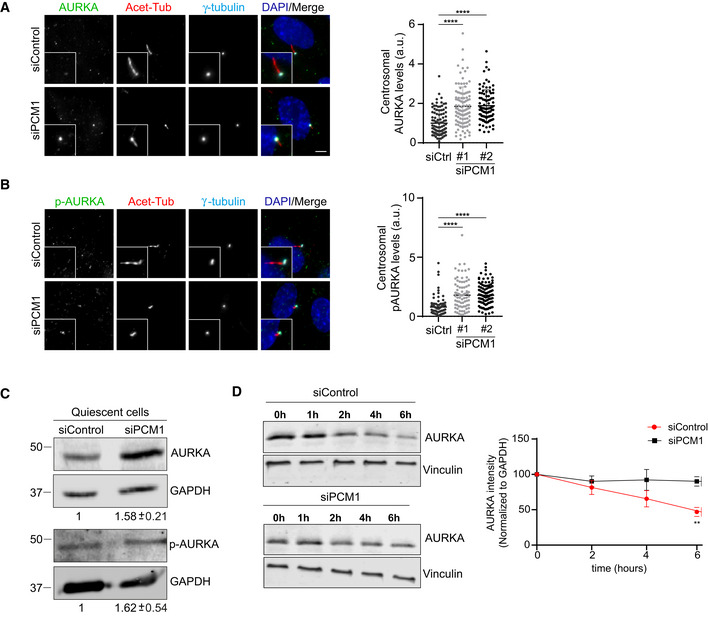
- A, B
Representative images and quantification of basal body levels of (A) AURKA and (B) phospho‐AURKA (p‐AURKA) in control and PCM1‐depleted cells. RPE1 cells were transfected with control or PCM1 siRNA #1 or siRNA #2 for 48 h. Following 24 h serum starvation, cells were fixed and stained with the indicated antibodies. Centrosomal AURKA and p‐AURKA fluorescence intensities were measured from maximum projections, and average means of the levels in control cells were normalized to 1. n > 500 cells per experiment. Data for (A) AURKA and (B) p‐AURKA represent mean value from three experiments per condition ± SEM (****P < 0.0001, unpaired Student's t‐test). Scale bar, 10 μm.
- C
Total AURKA and p‐AURKA levels in control and PCM1‐depleted cells. RPE1 cells were transfected with control or PCM1 siRNA#1 for 48 h. Following 24 h serum starvation, cell lysates were prepared and run on an SDS–PAGE gel. Proteins were detected by immunoblotting with antibodies against AURKA, p‐AURKA, and GAPDH (loading control).
- D
Cycloheximide chase experiment for quantification of AURKA half‐life. Cells were transfected with control or PCM1 siRNA#1 for 48 h and then treated with 200 nM cycloheximide along with serum starvation for indicated time points. AURKA intensities were quantified by immunoblotting for AURKA and vinculin (loading control) and AURKA levels were normalized to vinculin levels. Data represent mean value from three experiments per condition ± SEM (**P < 0.01, unpaired Student's t‐test).
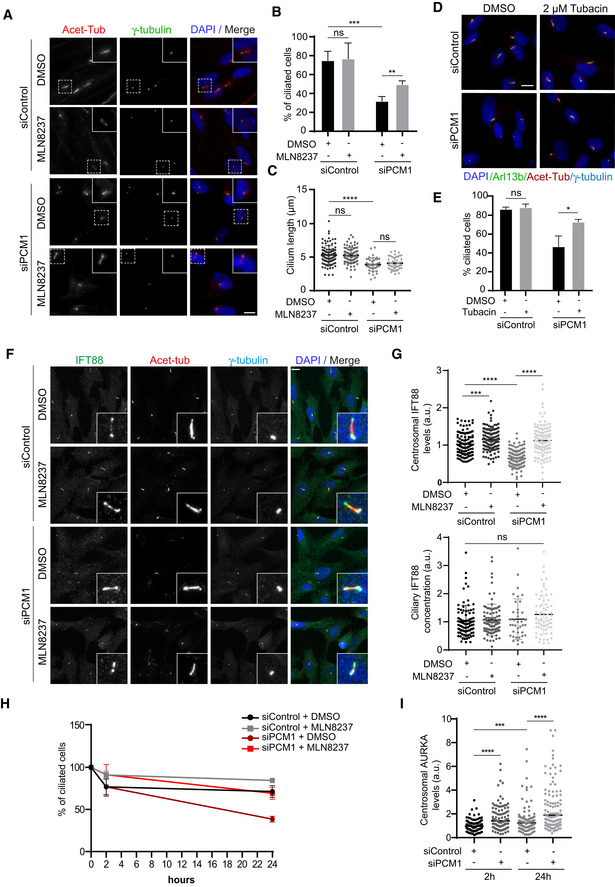
- A
Representative immunofluorescence images of cilium assembly experiments in control and PCM1‐depleted RPE1 cells treated with DMSO or MLN8237. Cells were transfected with control or PCM1 siRNA#1 for 48 h and treated with DMSO (vehicle control) or 0.5 μM MLN8237 in serum starvation medium for 24 h. Cells were fixed and immunostained for the primary cilium with acetylated tubulin antibody (Acet‐tub) and the centrosome with gamma‐tubulin antibody. DNA was stained with DAPI. Scale bar, 10 μm.
- B
Quantification of ciliogenesis efficiency for A. n > 100 cells per experiment. Data represent mean value from three experiments per condition ± SEM (***P < 0.001; **P < 0.01; ns, non‐significant, unpaired Student's t‐test.).
- C
Quantification of cilium length for A. n > 100 cells per experiment. Data represent mean value from three experiments per condition ± SEM (****P < 0.0001; ns, non‐significant, unpaired Student's t‐test.).
- D
Representative immunofluorescence images of cilium assembly experiments in control and PCM1‐depleted RPE1 cells treated with DMSO or tubacin. Cells were transfected with control or PCM1 siRNA#1 for 48 h and treated with DMSO or 2 μM tubacin in serum starvation medium for 24 h. Cells were fixed and immunostained for the primary cilium with Arl13b and acetylated tubulin antibody (Acet‐tub) and the centrosome with gamma‐tubulin antibody. DNA was stained with DAPI. Scale bar, 10 μm.
- E
Quantification of ciliogenesis efficiency for D. n > 100 cells per experiment. Data represent mean value from three experiments per condition ± SEM (*P < 0.05; ns, non‐significant, unpaired Student's t‐test).
- F
Representative immunofluorescence images and quantification of IFT88 levels at the centrosome and primary cilium. RPE1 cells were transfected with control or PCM1 siRNA#1 for 48 h, serum‐starved for 24 h, and treated with DMSO or 0.5 μM MLN8237. Cells were fixed and immunostained with antibodies against IFT88, acetylated tubulin, and gamma‐tubulin. DNA was stained with DAPI. Scale bar, 10 μm.
- G
Quantification of IFT88 centrosomal intensity and ciliary concentration for F. IFT88 fluorescence intensities at the centrosome and axoneme were measured from maximum projections, and average means of the levels in control cells were normalized to 1. Ciliary concentration was calculated by dividing ciliary fluorescence intensity to the cilium length. n > 100 cells per experiment. Data represent mean value from three experiments per condition ± SEM (***P < 0.001; ****P < 0.0001, unpaired Student's t‐test).
- H, I
Quantification of cilium disassembly and centrosomal AURKA levels after serum stimulation. RPE1 cells were transfected with control or PCM1 siRNA#1 for 48 h, serum‐starved for 24 h, and treated with DMSO or 0.5 μM MLN8237 in serum stimulation medium for 2 and 24 h. Cells were fixed and immunostained with antibodies against acetylated tubulin and gamma‐tubulin, and percentage of ciliated cells were quantified. X‐axis indicates the hours after serum stimulation. (H) n > 100 cells per experiment. Data represent mean value from three experiments per condition ± SEM. (I) n > 95 cells per experiment. Data represent mean value from three experiments per condition ± SEM (***P < 0.001; ****P < 0.0001, unpaired Student's t‐test).
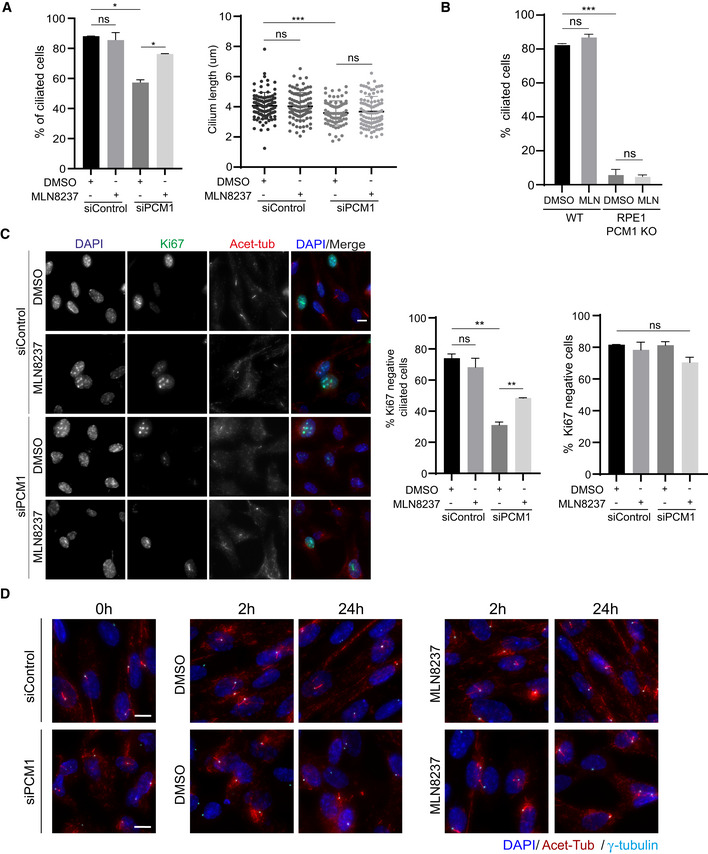
Quantification of ciliogenesis efficiency and cilium length in control and PCM1‐depleted RPE1 cells treated with DMSO or MLN8237. Cells were transfected with control or PCM1 siRNA#2 for 48 h and treated with DMSO (vehicle control) or 0.5 μM MLN8237 in serum starvation medium for 24 h. Cells were fixed and immunostained for the primary cilium with acetylated tubulin antibody (Acet‐tub) and the centrosome with gamma‐tubulin antibody. n > 100 cells per experiment. Data represent mean value from two experiments per condition ± SEM (***P < 0.001; *P < 0.1; ns, non‐significant, unpaired Student's t‐test).
Quantification of ciliogenesis percentage in RPE1 WT and PCM1 KO cells treated with DMSO (control) and 0.5 μM MLN8237. n > 100 cells per experiment. Data represent mean value from two experiments per condition ± SEM (***P < 0.001, ns: non‐significant, unpaired Student's t‐test).
Representative images and quantification of proliferating cells upon serum starvation. RPE1 cells were transfected with control or PCM1 siRNA for 48 h, serum‐starved for 24 h, and treated with DMSO or 0.5 μM MLN8237. Cells were fixed and immunostained with Ki67 to mark proliferating cells and acetylated tubulin to mark the primary cilium. DNA was stained with DAPI. Scale bar, 10 μm. Ciliated Ki67‐ cells and Ki67‐ cells were quantified. Data represent mean value from two experiments per condition ± SEM (**P < 0.01, ns: non‐significant, unpaired Student's t‐test).
Representative immunofluorescence images for cilium disassembly experiments. RPE1 cells were transfected with control or PCM1 siRNA for 48 h, serum‐starved for 24 h, and treated with DMSO (vehicle control) or 0.5 μM MLN8237 in serum stimulation medium for 2 and 24 h. Cells were fixed and immunostained with antibodies against acetylated tubulin antibody, gamma‐tubulin antibody to mark the centrosome. DNA was stained with DAPI. Scale bar, 10 μm.
References
Publication types
MeSH terms
Substances
LinkOut - more resources
Full Text Sources
Miscellaneous
