. 2021 Sep;81(12):799-811.
doi: 10.1002/pros.24146. Epub 2021 Jun 25.

Prostate cancer cells survive anti-androgen and mitochondrial metabolic inhibitors by modulating glycolysis and mitochondrial metabolic activities

Affiliations

Prostate cancer cells survive anti-androgen and mitochondrial metabolic inhibitors by modulating glycolysis and mitochondrial metabolic activities

Hirak S Basu et al. Prostate. 2021 Sep.

Abstract

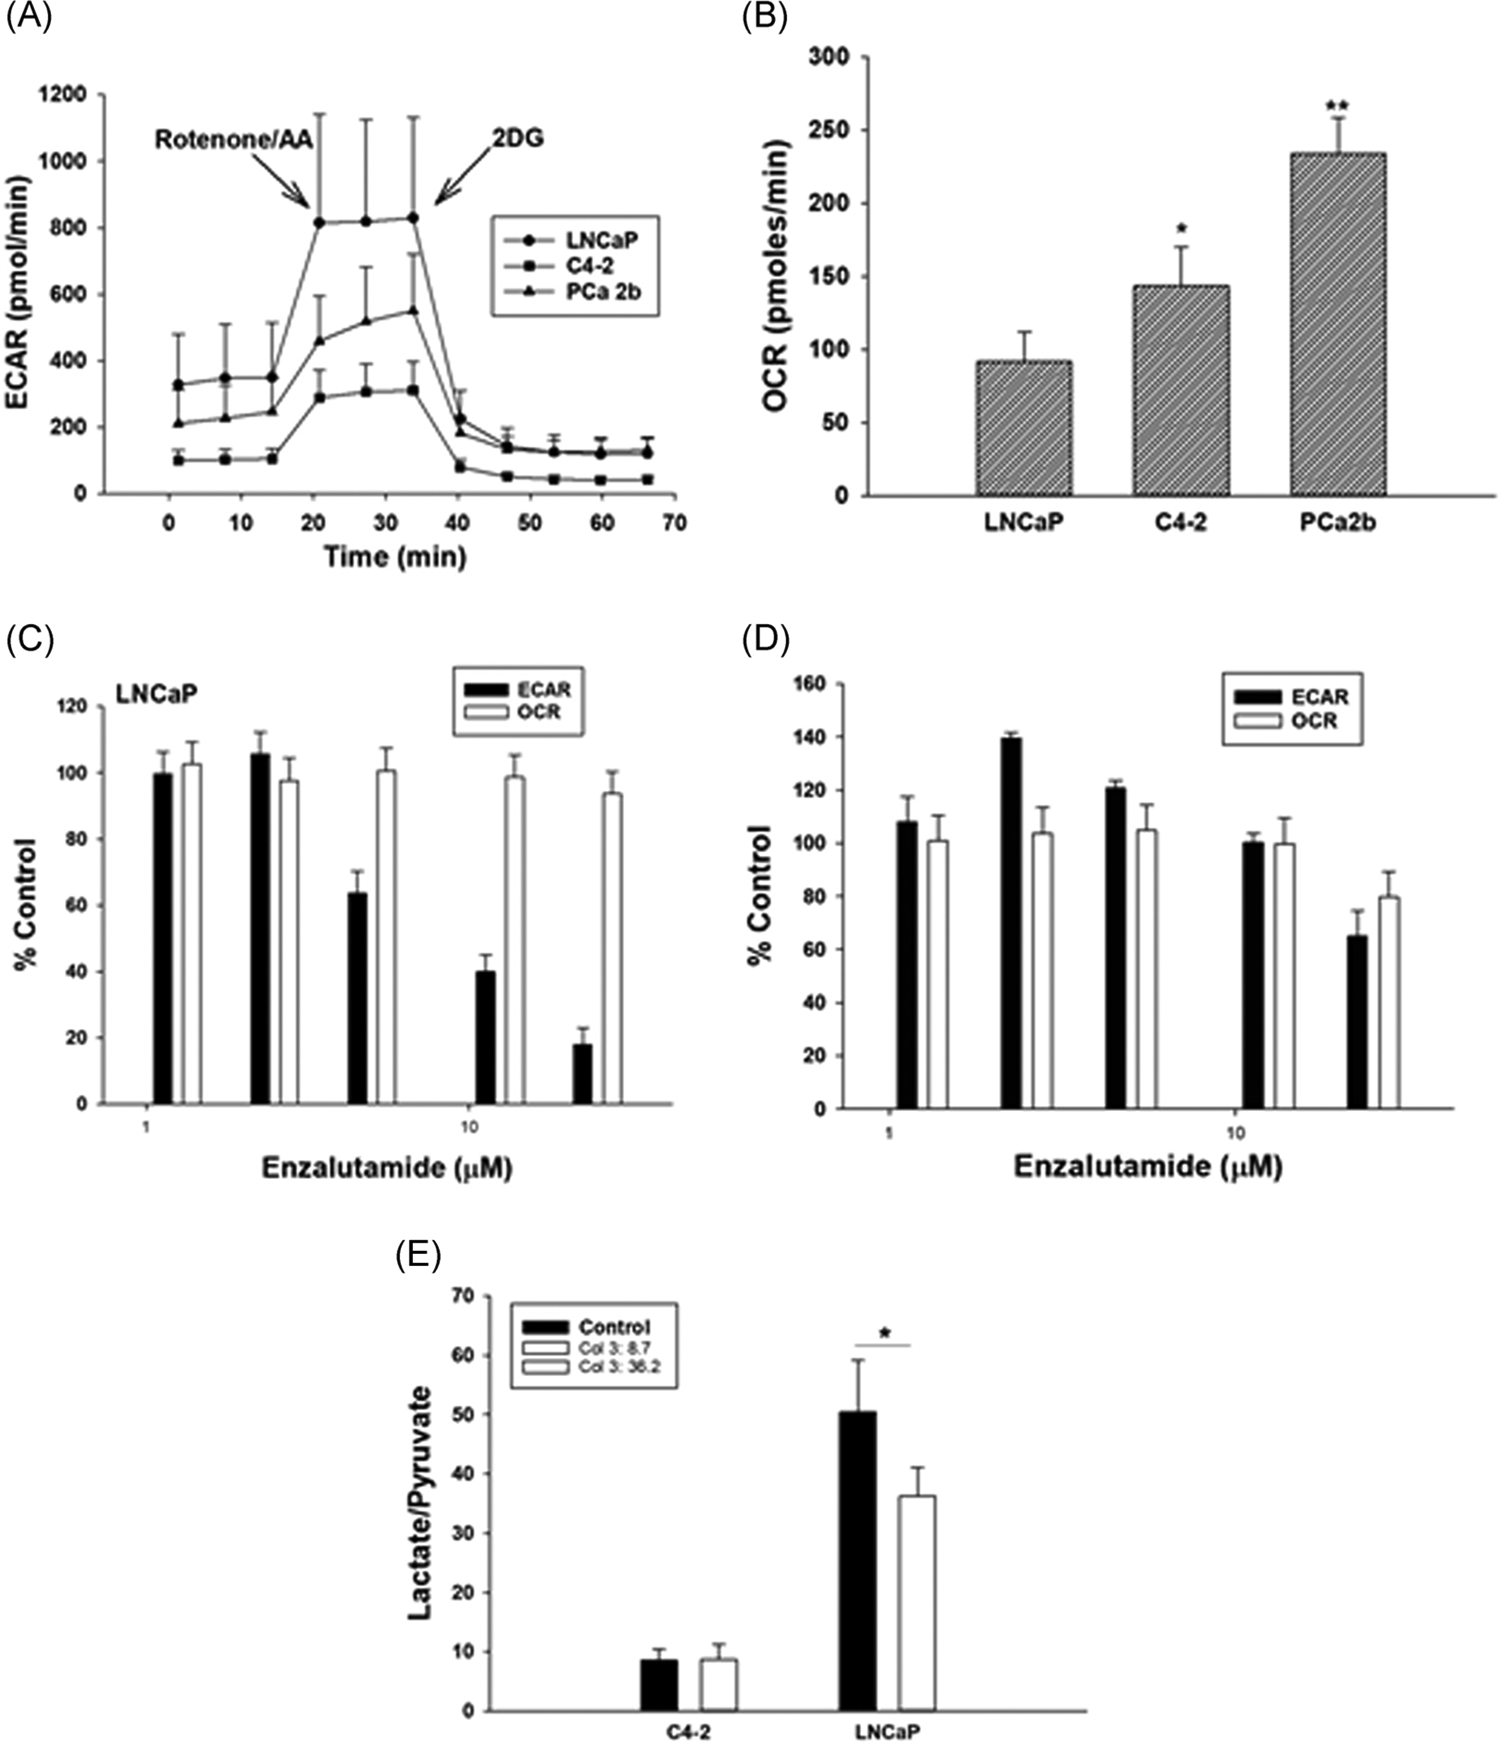
Background: Most cancer cells are more glycolytic even under aerobic conditions compared with their normal counterparts. Recent evidence of tumor cell metabolism, however, shows that some tumors also increase mitochondrial oxidative phosphorylation (ox-phos) at some disease states during progression and/or development of drug resistance. Our data show that anti-androgen enzalutamide (ENZA) resistant prostate cancer (PCa) cells use more mitochondrial metabolism leading to higher ox-phos as compared to the ENZA-sensitive cells and can become vulnerable to mitochondrial metabolism targeted therapies.

Methods: Seahorse assay, mass spectrometry and high resolution fluorescence confocal microscopy coupled with image analysis has been used to compare mitochondrial metabolism in ENZA-treated and -untreated anti-androgen-sensitive LNCaP and -resistant C4-2, CWR22ν1, and PCa2b cells. Ex vivo fluorescence microscopy and image analysis has been standardized to monitor mitochondrial electron transport (ETS) activity that likely increases ox-phos in circulating tumor cells (CTCs) isolated fom patients undergoing AR-targeted therapies.

Results: Our data show that PCa cells that are resistant to anti-androgen ENZA switch from glycolysis to ox-phos leading to an increased ETS activity. ENZA pretreated cells are more vulnerable to ETS component complex I inhibitor IACS-010759 (IACS) and mitochondrial glutaminase inhibitor CB-839 that reduces glutamate supply to tricarboxylic acid cycle. CTCs isolated from 6 of 20 patient blood samples showed relatively higher ETS activity than the rest of the patients. All six patients have developed ENZA resistance within less than 6 months of the sample collection.

Conclusion: The enhanced growth inhibitory effects of mitochondrial metabolic inhibitors IACS and CB-839 in ENZA pretreated PCa cells provides a rationale for designing a drug combination trial. Patients can be selected for such trials by monitoring the mitochondrial ETS activities in their CTCs to maximize success.


Conflict of interest statement

CONFLICT OF INTERESTS

All Authors declare no potential conflict of interest with this publication.

Figures

FIGURE 1
FIGURE 1
(A) Glycolysis (ECAR) and (B) oxygen consumption rate (OCR) in LNCaP, C4–2 and PCa2b cells grown in androgen reduced media for 48 h; (C) ECAR and OCR in LNCaP and (D) C4–2 cells grown in androgen depleted media for 48 h and then treated with ENZA for 24 h. All ECAR and OCR data were normalized to viable cells as determined by propidium iodide staining (see text) at the end of each assay. Each data point and error bar represent the mean and standard deviation of readings from 15 separate wells repeated three times. (E) Mass spectroscopic analysis of lactate/pyruvate ratio in C4–2 and LNCaP cells incubated in androgen depleted medium for 48 h and then treated for 24 h with ENZA at their respective IC50 doses (20 and 10 μM, respectively). Each data point and the error bar are the mean and standard deviation of 2 parallel samples run at least twice. *p < .01, **p < .001. ECAR, extracellular acidificationa rate; ENZA, enzalutamide; OCR, oxygen consumption rate
FIGURE 2
FIGURE 2
Representative confocal microscopy images of an optical section at ×100 and ×500 magnification each of (A) LNCaP and (B) C4–2 cells treated first 24 h with ENZA at their respective IC50 doses (10 and 20 μM, respectively) and then incubated with MSR dye for 4 h and examples of corresponding Image J segmentation (bottom section) for fluorescence intensity analysis. Mean pixel fluorescence intensities of oxidized MSR dye in the mitochondria were calculated from individual mitochondrion MSR fluorescence image quantitation and averaged over all mitochondria per cell as described in the text. of (C) LNCaP, (D) C4–2 and (E) CWR22ν1 cells treated with vehicle control, 10 μM ENZA (LNCaP) and 20 μM ENZA (C4–2 and CWR22ν1), androgen mimetic 2 nM R1881, and ENZA + R1881 (E + R) were calculated from individual mitochondrion MSR fluorescence image quantitation and averaged over all mitochondria per cell as described in the text. (F) MSR/MTG in C4–2 and LNCaP cells treated for 96 h with vehicle (control) and with IC50 dose of ENZA. Each data point and standard deviation are the mean of the readings from six wells run in triplicates and repeated at least three times. *p < .05, **p < .005. ENZA, enzalutamide; MSR, MitoSOX Red; MTG, MitoTracker Green
FIGURE 3
FIGURE 3
ECAR and OCR in (A) LNCaP, (C) C4–2 treated with graded concentration of IACS for 24 h and (E) C4–2 treated with graded concentration of CB-839 and (B), (D) and (F) are the corresponding treatment with IACS and CB-839 after 24 h pretreatment with ENZA. All ECAR and OCR data were normalized to viable cells as determined by propidium iodide staining (see text) at the end of the assay. Each data point and error bar represent the mean and standard deviation of readings from 15 separate wells repeated at least three times. *p < .005. ECAR, extracellular acidificationa rate; ENZA, enzalutamide; OCR, oxygen consumption rate
FIGURE 4
FIGURE 4
Effect of graded concentrations of IACS on the growth of (A, C) LNCaP and (B, D) C4–2 cells after 96 h treatment with IACS or CB-839 alone or after 24 h pretreatment with ENZA. (E) Effects of ENZA, IACS, and ENZA + IACS (F) and the effects of ENZA, CB-839 and ENZA + CB-839 on the growth of LNCaP, C4–2, and PDX-derived cells. Each data point and error bar represent the mean and standard deviation of readings from 18 separate wells repeated at least twice. *p < .005. ENZA, enzalutamide; PDX, patient-derived xenograft
FIGURE 5
FIGURE 5
Mean pixel fluorescence intensities of oxidized MSR dye in the mitochondria were calculated from individual mitochondrion MSR fluorescence image quantitation and averaged over all mitochondria per cell as described in the text. (A) LNCaP, (B) C4–2, (C) CWR22ν1, and (D) PCa2b cells treated with vehicle control, 10 μM ENZA (LNCaP) and 20 μM ENZA (C4–2, CWR22ν1 and PCa2h) for 96 h, CB-839 for 72 h, and ENZA (96 h)+CB-839 (72 h) computed from microscopic image analysis (see text). *p < .005. CTC, circulating tumor cell; ENZA, enzalutamide; MSR, MitoSOX Red
FIGURE 6
FIGURE 6
(A) CTC isolated from a PCa patient blood sample. The CTCs were identified from CD45 negative nucleated cells that are positive for androgen receptor and epithelial cell adhesion molecule as shown above the respective images; (B) a representative image of an optical section of MSR fluorescence due to oxidation by mitochondrial superoxide of a PCa patient CTC and (C) image segmentation analysis of the image in 5B for pixel fluorescence intensity analysis; (D) mean MSR dye fluorescence intensities of 10 or more CTCs obtained from each PCa patient undergoing androgen-signaling axis targeting therapies. Each sample was collected from an individual patient, except samples #6, #7 and #13, #14 (marked in gray). Samples marked with a line on top are from patients who developed resistance to anti-androgen therapy. (D) Mean CTC MSR dye fluorescence intensities in patients with stable and progressive disease, p value for linear mixed model (***p < .0001). (E) Mean CTC MSR dye fluorescence intensities for two patients while stable and near the time of progression, p value (**p < .005). CTC, circulating tumor cell; PCa, prostate cancer; MSR, MitoSOX Red

References

    1. Tindall DJ. PCa: Biochemistry. Molecular Biology and Genetics. New York: Springer; 2013.
    1. PCa: diagnosis and management. NICE Guideline Updates Team (UK). London: National Institute for Health and Care Excellence (UK); May 2019.
    1. Logothetis CJ, Aparicio A, Koinis F, Corn PG, Efstathiou E. PCa: Quo Vadis? Eur Urol 2019. pii: S0302–2838(19)30521–4 [Epub ahead of print]. - PubMed
    1. Culig Z Distinguishing indolent from aggressive PCa. Recent Results Cancer Res 2014;202:141–147. - PubMed
    1. Vander Heiden MG, Cantley LC, Thompson CB. Understanding the Warburg effect: the metabolic requirements of cell proliferation. Science. 324(5930):1029–1033. - PMC - PubMed

Publication types

MeSH terms