

Attenuation of clinical and immunological outcomes during SARS-CoV-2 infection by ivermectin
- PMID: 34170074
- PMCID: PMC8350903
- DOI: 10.15252/emmm.202114122
Attenuation of clinical and immunological outcomes during SARS-CoV-2 infection by ivermectin
Abstract
The devastating pandemic due to SARS-CoV-2 and the emergence of antigenic variants that jeopardize the efficacy of current vaccines create an urgent need for a comprehensive understanding of the pathophysiology of COVID-19, including the contribution of inflammation to disease. It also warrants for the search of immunomodulatory drugs that could improve disease outcome. Here, we show that standard doses of ivermectin (IVM), an anti-parasitic drug with potential immunomodulatory activities through the cholinergic anti-inflammatory pathway, prevent clinical deterioration, reduce olfactory deficit, and limit the inflammation of the upper and lower respiratory tracts in SARS-CoV-2-infected hamsters. Whereas it has no effect on viral load in the airways of infected animals, transcriptomic analyses of infected lungs reveal that IVM dampens type I interferon responses and modulates several other inflammatory pathways. In particular, IVM dramatically reduces the Il-6/Il-10 ratio in lung tissue and promotes macrophage M2 polarization, which might account for the more favorable clinical presentation of IVM-treated animals. Altogether, this study supports the use of immunomodulatory drugs such as IVM, to improve the clinical condition of SARS-CoV-2-infected patients.
Keywords: SARS-CoV-2; coronavirus; inflammation; ivermectin; viral infections.
© 2021 The Authors. Published under the terms of the CC BY 4.0 license.
Conflict of interest statement
The authors declare that they have no conflict of interest.
Figures
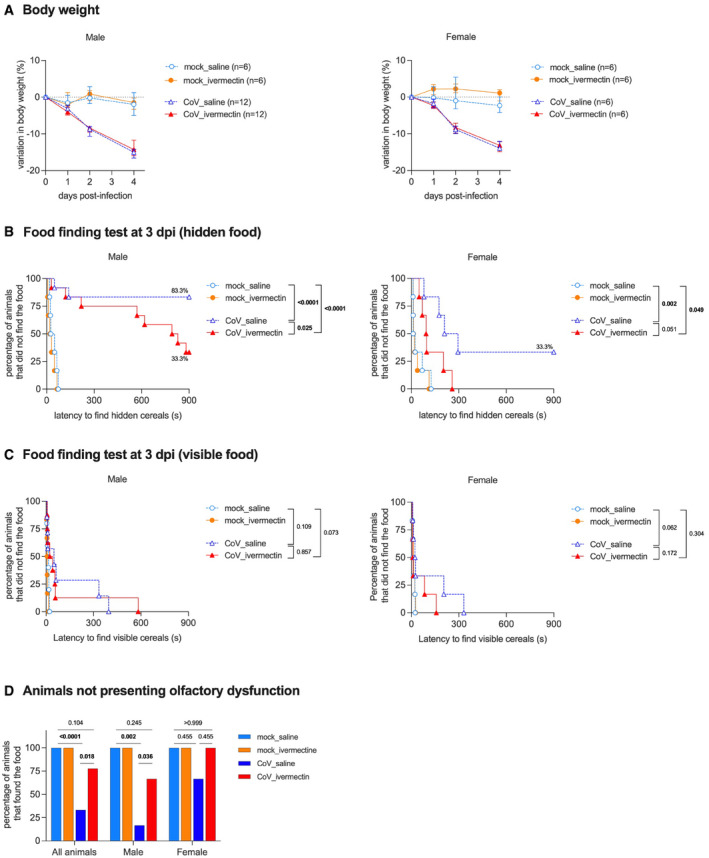
- A
Progression of body weight in male and female hamsters, mock‐infected or SARS‐CoV‐2‐infected, treated with saline or with 400 µg/kg ivermectin. Symbols indicate the median ± interquartile range.
- B
Curves represent the percentage of animals that did not find the hidden (buried) food.
- C
Curves represent the percentage of animals that did not find the visible (unburied) food.
- D
Summary of olfactory status.
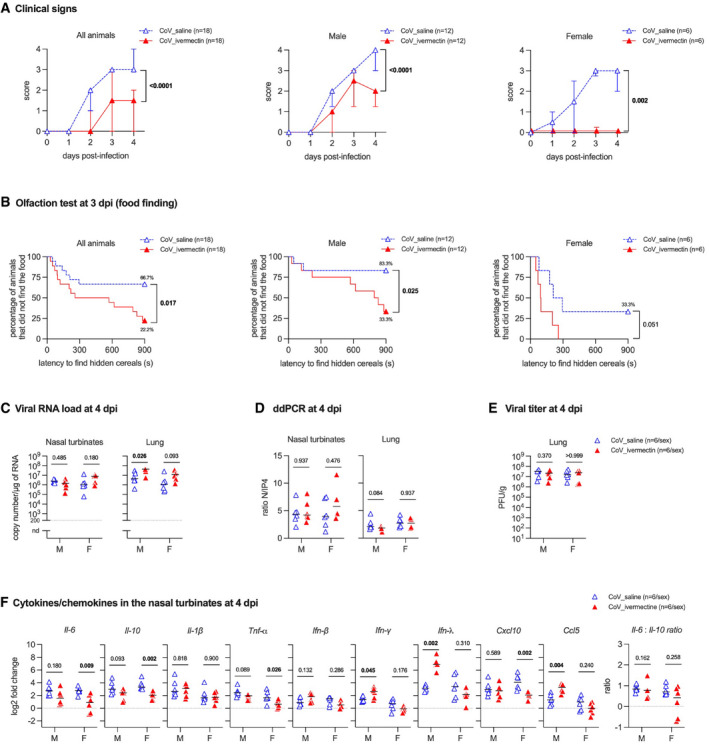
- A
Clinical signs in infected hamsters. The clinical score is based on a cumulative 0–4 scale: ruffled fur; slow movements; apathy; and absence of exploration activity. Symbols indicate the median ± interquartile range.
- B
Olfactory performance in infected hamsters. The olfaction test is based on the hidden (buried) food finding test. Curves represent the percentage of animals that did not find the buried food. Food finding assays were performed at 3 days post‐infection (dpi). Data were obtained from three independent experiments for males and two independent experiments for females.
- C
Viral load in the nasal turbinates and in the lungs at 4 dpi.
- D
Ratio between the CPD (copy per droplets, normalized to γ‐actin and Hprt reference gene relative expression) of structural [N, nucleocapsid] and non‐structural [IP4: RdRp, RNA‐dependent RNA polymerase] viral gene expression determined by digital droplet PCR (ddPCR) in the nasal turbinates and in the lungs at 4 dpi.
- E
Infectious viral titer in the lung at 4 dpi expressed as plaque‐forming units (PFU)/g of tissue.
- F
Cytokine and chemokine transcripts in the nasal turbinates at 4 dpi in male and female SARS‐CoV‐2‐infected hamsters, treated with saline or with 400 µg/kg ivermectin.
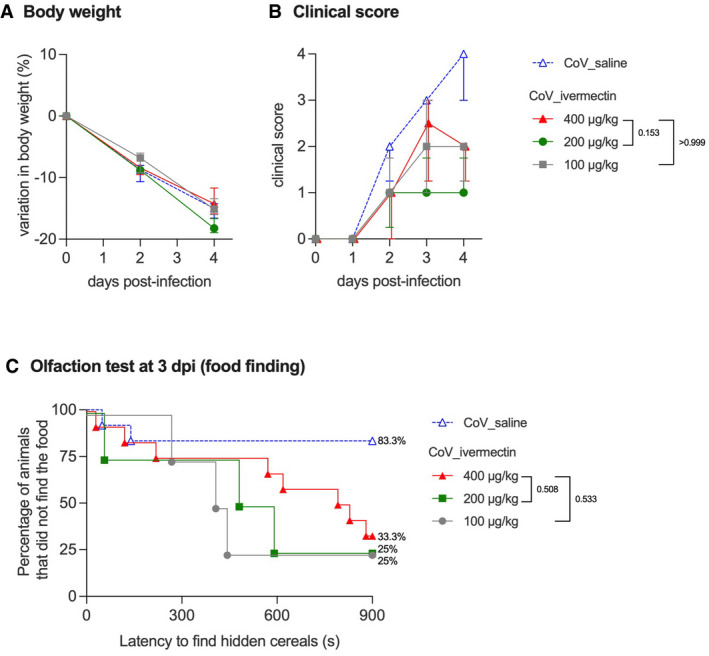
- A
Progression of body weight in male hamsters, treated with saline or with 400, 200, or 100 µg/kg ivermectin. Symbols indicate the median ± interquartile range.
- B
Clinical score based on a cumulative 0–4 scale: ruffled fur; slow movements; apathy; and absence of exploration activity. Symbols indicate the median ± interquartile range.
- C
Olfaction deficit based on the buried food finding test. Curves represent the percentage of animals that did not find the buried food. Food finding assays were performed at 3 days post‐infection.
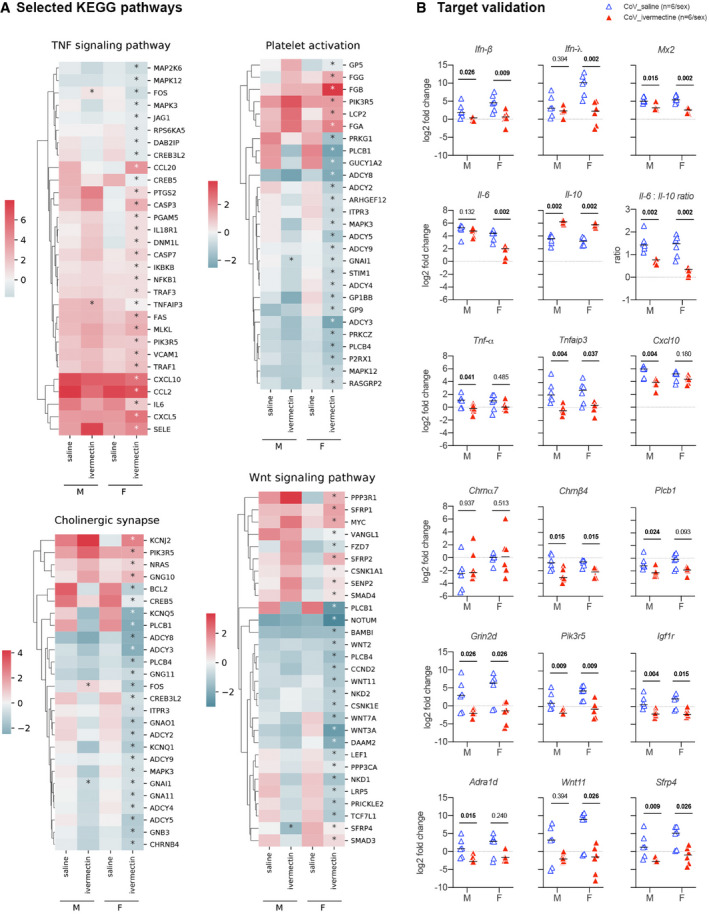
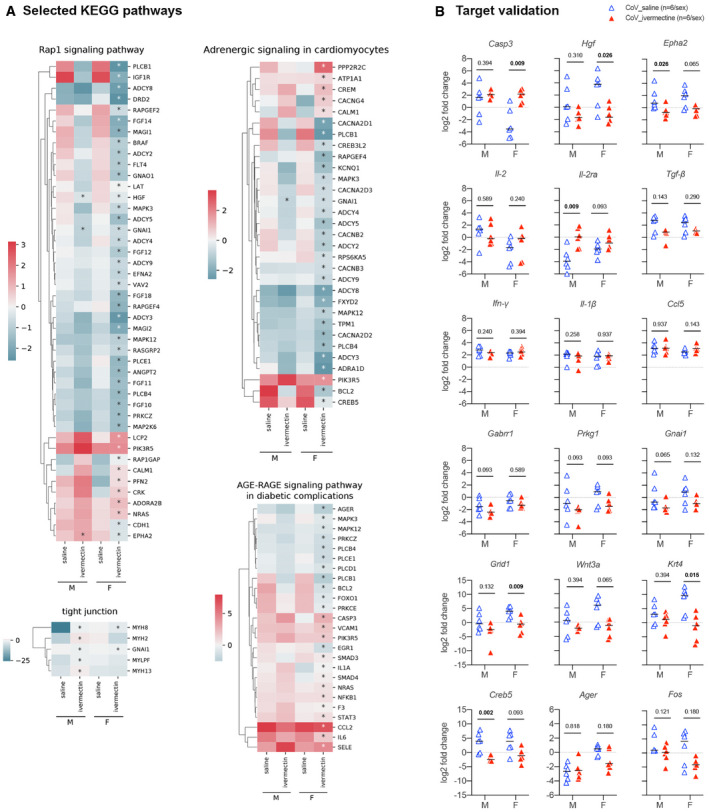
- A
Heatmaps showing the differentially expressed genes according to the selected KEGG pathways calculated in comparison with mock‐infected hamsters. * indicates Benjamini–Hochberg‐adjusted P‐value < 0.05 in the comparison between saline and ivermectin within the same sex. Color gradient represents the transcription log2 fold change comparing infected and mock‐infected. Complete analyses are listed in Dataset EV1.
- B
Validation targets in the lung at 4 dpi. Horizontal lines indicate medians. The P value is indicated in bold when significant at a 0.05 threshold. Mann–Whitney test.
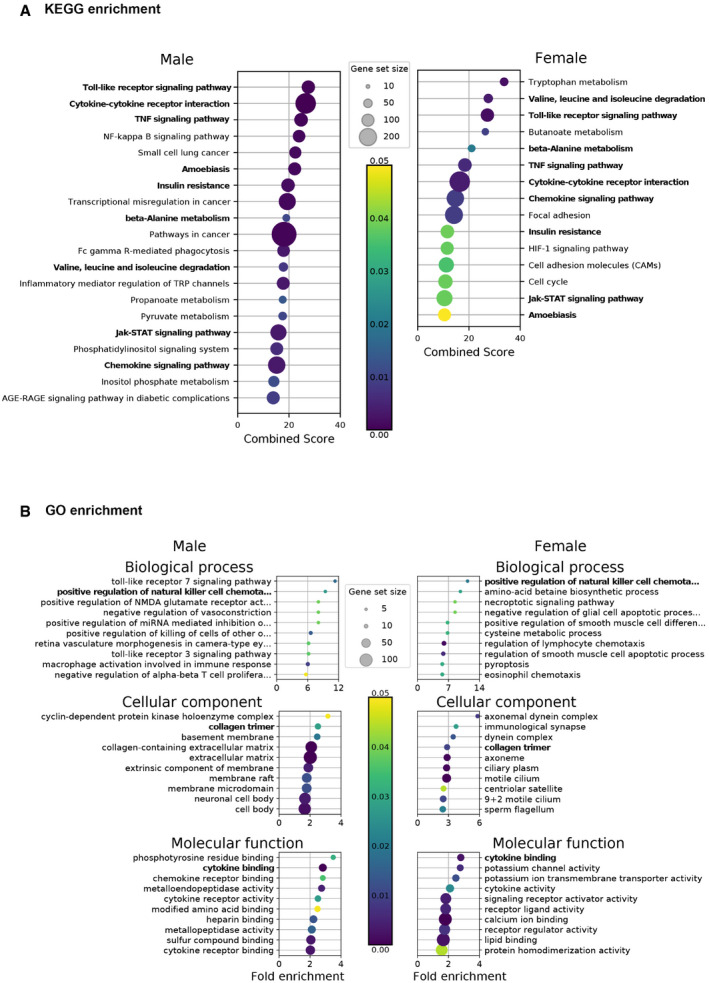
- A
KEGG enrichment.
- B
GO enrichment analysis.
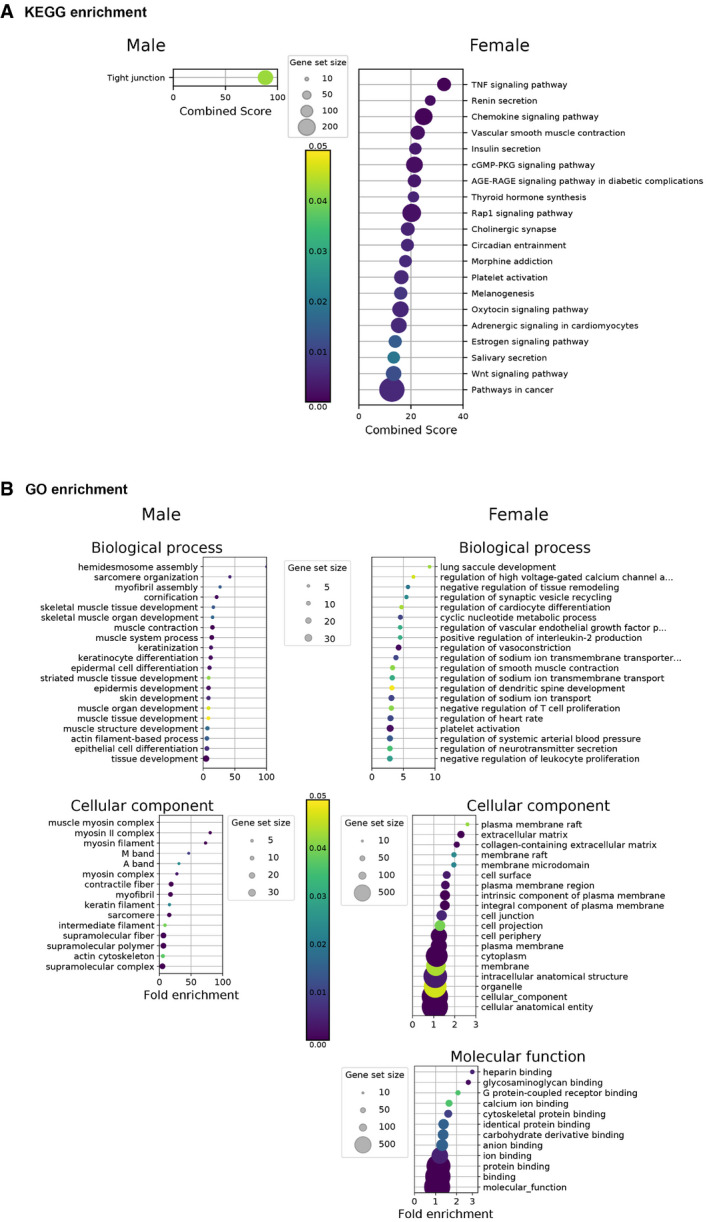
- A
KEGG enrichment.
- B
GO enrichment analysis.
- A
Heatmaps showing the differentially expressed genes according to the selected KEGG pathways, calculated in comparison with mock‐infected hamsters. * indicates Benjamini–Hochberg‐adjusted P‐value<0.05 in the comparison between saline and ivermectin within the same sex. Color gradient represents the transcription log2 fold change comparing infected and mock‐infected. Complete analyses are listed in Dataset EV1.
- B
Validation targets in the lung at 4 dpi. Horizontal lines indicate medians. The P value is indicated in bold when significant at a 0.05 threshold. Mann–Whitney test.
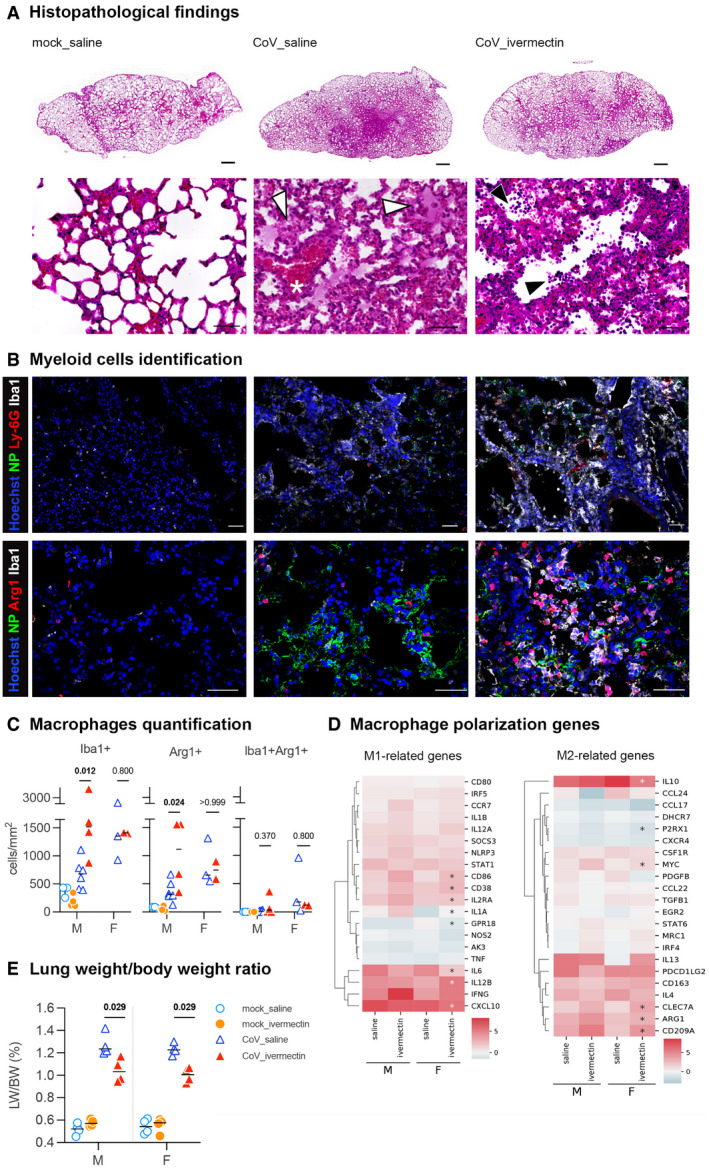
- A
Representative histopathology photomicrographies of lungs according to the different groups: mock_saline, CoV_saline, and CoV_ivermectin. Top panels: whole lung sections. Bottom panels: high magnification. CoV_saline section exhibits important congestion (*), edema associated with few mononuclear cells (white arrowheads). Note the thickening of the alveolar walls. CoV_ivermectin section exhibits important amounts of mononuclear cells (black arrowheads) and less marked signs of congestion or edema. Hematoxylin and eosin. Scale bars = 1 mm (top panels) and 20 μm (bottom panels).
- B
Representative immunofluorescence photomicrographies of neutrophils (Ly‐6G), monocytes/macrophages (Iba1), M2 macrophages (Arg1), and SARS‐CoV‐2 (NP) in the lung. Scale bars = 50 μm.
- C
Quantification of Iba1+ cells, Arg1+ cells, and Iba1+Arg1+ cells in the lungs. mock_saline n = 3 (males), mock_ivermectin n = 4 (males), CoV_saline n = 9 (6 males and 3 females), and CoV_ivermectin n = 6 (4 males and 2 females).
- D
Heatmaps showing the differentially expressed genes related to the M1/M2 polarization in comparison with mock‐infected hamsters. *indicates Benjamini–Hochberg‐adjusted P‐value < 0.05 in the comparison between saline and ivermectin within the same sex. Color gradient represents the transcription log2 fold change comparing infected and mock‐infected. Complete analyses are listed in Dataset EV1.
- E
Lung weight‐to‐body weight ratio in the different groups (n = 4/sex/group).
Similar articles
-
Prophylactic administration of ivermectin attenuates SARS-CoV-2 induced disease in a Syrian Hamster Model.J Antibiot (Tokyo). 2023 Aug;76(8):481-488. doi: 10.1038/s41429-023-00623-0. Epub 2023 Apr 25. J Antibiot (Tokyo). 2023. PMID: 37185581 Free PMC article.
-
The SARS-CoV-2 Ivermectin Navarra-ISGlobal Trial (SAINT) to Evaluate the Potential of Ivermectin to Reduce COVID-19 Transmission in low risk, non-severe COVID-19 patients in the first 48 hours after symptoms onset: A structured summary of a study protocol for a randomized control pilot trial.Trials. 2020 Jun 8;21(1):498. doi: 10.1186/s13063-020-04421-z. Trials. 2020. PMID: 32513289 Free PMC article.
-
Safety and Efficacy of Imatinib for Hospitalized Adults with COVID-19: A structured summary of a study protocol for a randomised controlled trial.Trials. 2020 Oct 28;21(1):897. doi: 10.1186/s13063-020-04819-9. Trials. 2020. PMID: 33115543 Free PMC article.
-
Repositioning Ivermectin for Covid-19 treatment: Molecular mechanisms of action against SARS-CoV-2 replication.Biochim Biophys Acta Mol Basis Dis. 2022 Feb 1;1868(2):166294. doi: 10.1016/j.bbadis.2021.166294. Epub 2021 Oct 20. Biochim Biophys Acta Mol Basis Dis. 2022. PMID: 34687900 Free PMC article. Review.
-
Viral Infections of the Upper Airway in the Setting of COVID-19: A Primer for Rhinologists.Am J Rhinol Allergy. 2021 Jan;35(1):122-131. doi: 10.1177/1945892420947929. Epub 2020 Aug 6. Am J Rhinol Allergy. 2021. PMID: 32762250 Free PMC article. Review.
Cited by
-
Clinical development of antivirals against SARS-CoV-2 and its variants.Curr Res Microb Sci. 2023 Dec 2;6:100208. doi: 10.1016/j.crmicr.2023.100208. eCollection 2024. Curr Res Microb Sci. 2023. PMID: 38149085 Free PMC article. Review.
-
Association Among the Gut Microbiome, the Serum Metabolomic Profile and RNA m6A Methylation in Sepsis-Associated Encephalopathy.Front Genet. 2022 Mar 30;13:859727. doi: 10.3389/fgene.2022.859727. eCollection 2022. Front Genet. 2022. PMID: 35432460 Free PMC article.
-
Efficacy of Ivermectin, Chloroquine/Hydroxychloroquine, and Azithromycin in Managing COVID-19: A Systematic Review of Phase III Clinical Trials.Biomedicines. 2024 Sep 27;12(10):2206. doi: 10.3390/biomedicines12102206. Biomedicines. 2024. PMID: 39457519 Free PMC article. Review.
-
Potential therapeutic effects of Ivermectin in COVID-19.Exp Biol Med (Maywood). 2022 Aug;247(15):1388-1396. doi: 10.1177/15353702221099579. Epub 2022 Jun 10. Exp Biol Med (Maywood). 2022. PMID: 35686662 Free PMC article.
-
Prophylactic administration of ivermectin attenuates SARS-CoV-2 induced disease in a Syrian Hamster Model.J Antibiot (Tokyo). 2023 Aug;76(8):481-488. doi: 10.1038/s41429-023-00623-0. Epub 2023 Apr 25. J Antibiot (Tokyo). 2023. PMID: 37185581 Free PMC article.
References
-
- Aamir K, Khan HU, Sethi G, Hossain MA, Arya A (2020) Wnt signaling mediates TLR pathway and promote unrestrained adipogenesis and metaflammation: therapeutic targets for obesity and type 2 diabetes. Pharmacol Res 152: 104602 - PubMed
-
- AVMA (2020) AVMA guidelines for the euthanasia of animals: 2020 edition*. Schaumburg, IL: American Veterinary Medical Association;
Publication types
MeSH terms
Substances
Grants and funding
LinkOut - more resources
Full Text Sources
Other Literature Sources
Medical
Miscellaneous
