

Trends in Prevalence of Diabetes and Control of Risk Factors in Diabetes Among US Adults, 1999-2018
- PMID: 34170288
- PMCID: PMC8233946
- DOI: 10.1001/jama.2021.9883
Trends in Prevalence of Diabetes and Control of Risk Factors in Diabetes Among US Adults, 1999-2018
Abstract
Importance: Understanding population-wide trends in prevalence and control of diabetes is critical to planning public health approaches for prevention and management of the disease.
Objective: To determine trends in prevalence of diabetes and control of risk factors in diabetes among US adults between 1999-2000 and 2017-2018.
Design, setting, and participants: Ten cycles of cross-sectional National Health and Nutrition Examination Survey (NHANES) data between 1999-2000 and 2017-2018 were included. The study samples were weighted to be representative of the noninstitutionalized civilian resident US population. Adults aged 18 years or older were included, except pregnant women.
Exposures: Survey cycle.
Main outcomes and measures: Diabetes was defined by self-report of diabetes diagnosis, fasting plasma glucose level of 126 mg/dL or more, or hemoglobin A1c (HbA1c) level of 6.5% or more. Three risk factor control goals were individualized HbA1c targets, blood pressure less than 130/80 mm Hg, and low-density lipoprotein cholesterol level less than 100 mg/dL. Prevalence of diabetes and proportion of adults with diagnosed diabetes who achieved risk factor control goals, overall and by sociodemographic variables, were estimated.
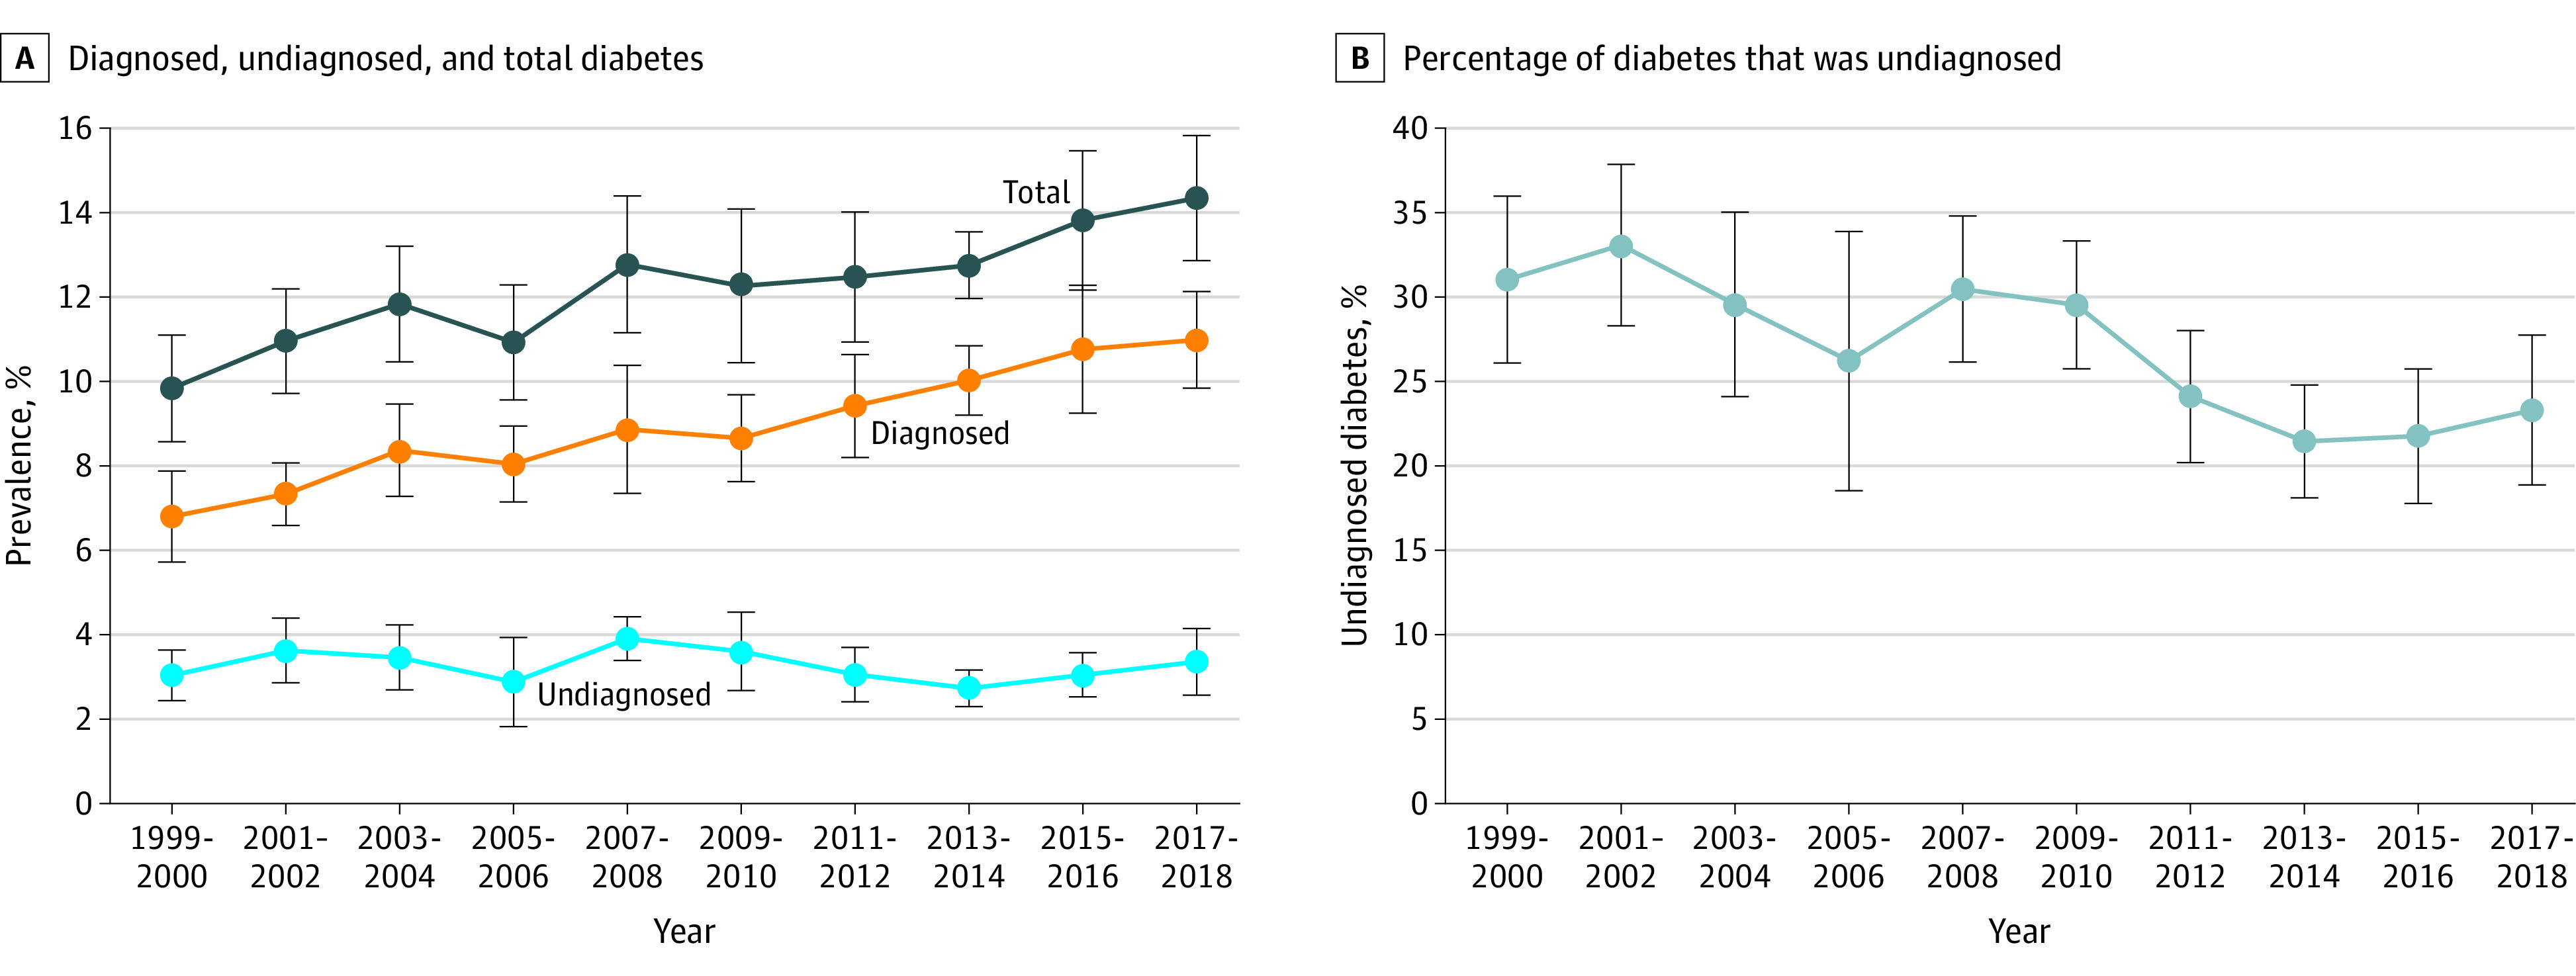
Results: Among the 28 143 participants included (weighted mean age, 48.2 years; 49.3% men), the estimated age-standardized prevalence of diabetes increased significantly from 9.8% (95% CI, 8.6%-11.1%) in 1999-2000 to 14.3% (95% CI, 12.9%-15.8%) in 2017-2018 (P for trend < .001). From 1999-2002 to 2015-2018, the estimated age-standardized proportion of adults with diagnosed diabetes who achieved blood pressure less than 130/80 mm Hg (P for trend = .007) and low-density lipoprotein cholesterol level less than 100 mg/dL (P for trend < .001) increased significantly, but not individualized HbA1c targets (P for trend = .51). In 2015-2018, 66.8% (95% CI, 63.2%-70.4%), 48.2% (95% CI, 44.6%-51.8%), and 59.7% (95% CI, 54.2%-65.2%) of adults with diagnosed diabetes achieved individualized HbA1c targets, blood pressure less than 130/80 mm Hg, and low-density lipoprotein cholesterol level less than 100 mg/dL, respectively. Only 21.2% of these adults (95% CI, 15.5%-26.8%) achieved all 3. During the entire study period, these 3 goals were significantly less likely to be achieved among young adults aged 18 to 44 years (vs older adults ≥65 years: estimated proportion, 7.4% vs 21.7%; adjusted odds ratio, 0.32 [95% CI, 0.16-0.63]), non-Hispanic Black adults (vs non-Hispanic White adults: estimated age-standardized proportion, 12.5% vs 20.6%; adjusted odds ratio, 0.60 [95% CI, 0.40-0.90]), and Mexican American adults (vs non-Hispanic White adults: estimated age-standardized proportion, 10.9% vs 20.6%; adjusted odds ratio, 0.48 [95% CI, 0.31-0.77]).
Conclusions and relevance: Based on NHANES data from US adults, the estimated prevalence of diabetes increased significantly between 1999-2000 and 2017-2018. Only an estimated 21% of adults with diagnosed diabetes achieved all 3 risk factor control goals in 2015-2018.
Conflict of interest statement
Figures
Comment in
-
Worsening of risk factor control in US diabetic patients: a call to action.Eur Heart J. 2021 Aug 31;42(33):3120-3121. doi: 10.1093/eurheartj/ehab501. Eur Heart J. 2021. PMID: 34324654 No abstract available.
-
New USPSTF Recommendations for Screening for Prediabetes and Type 2 Diabetes: An Opportunity to Create National Momentum.JAMA. 2021 Aug 24;326(8):701-703. doi: 10.1001/jama.2021.12559. JAMA. 2021. PMID: 34427620 No abstract available.
References
-
- GBD 2017 Risk Factor Collaborators . Global, regional, and national comparative risk assessment of 84 behavioural, environmental and occupational, and metabolic risks or clusters of risks for 195 countries and territories, 1990-2017: a systematic analysis for the Global Burden of Disease Study 2017. Lancet. 2018;392(10159):1923-1994. doi: 10.1016/S0140-6736(18)32225-6 - DOI - PMC - PubMed
-
- World Health Organization . Global report on diabetes. Accessed May 2, 2021. https://apps.who.int/iris/bitstream/handle/10665/204871/9789241565257_en...
-
- Centers for Disease Control and Prevention . National Diabetes Statistics Report, 2020. Centers for Disease Control and Prevention, US Dept of Health and Human Services; 2020.
