. 2021 Jul;75(6-7):255-272.
doi: 10.1007/s10858-021-00373-x. Epub 2021 Jun 25.

Biomolecular solid-state NMR spectroscopy at 1200 MHz: the gain in resolution

Affiliations

Biomolecular solid-state NMR spectroscopy at 1200 MHz: the gain in resolution

Morgane Callon et al. J Biomol NMR. 2021 Jul.

Abstract

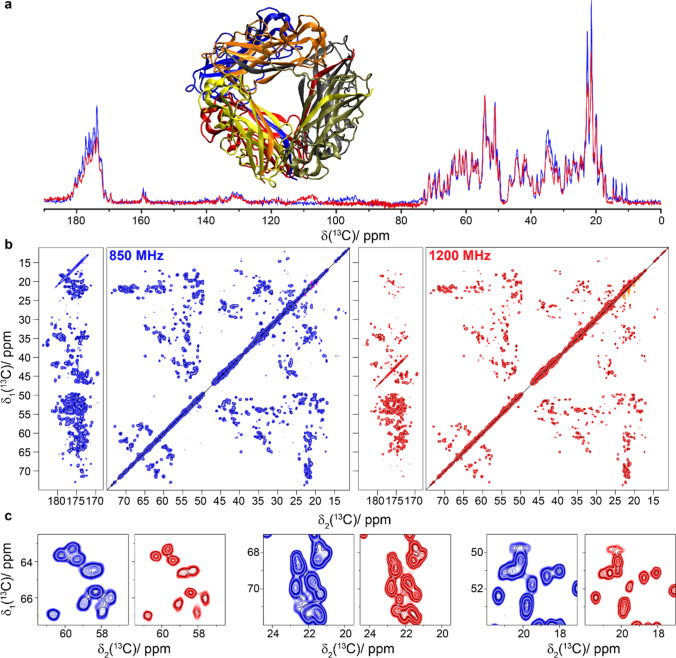
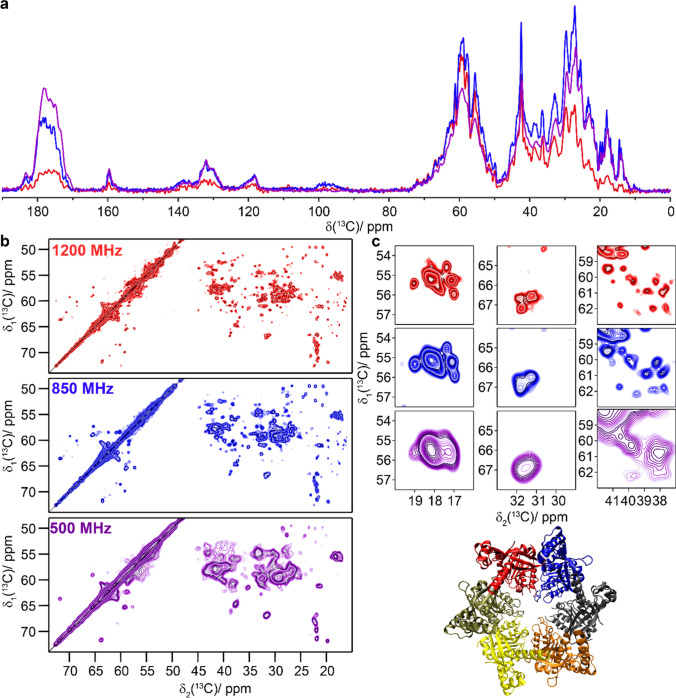
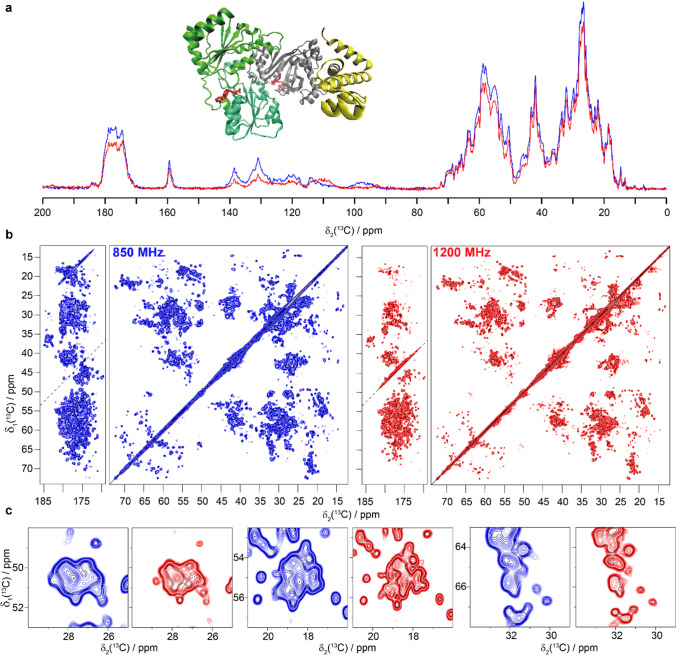
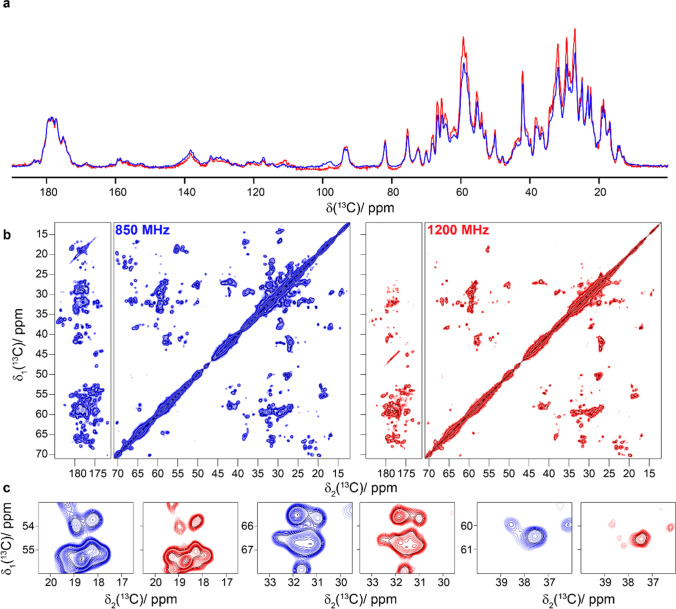
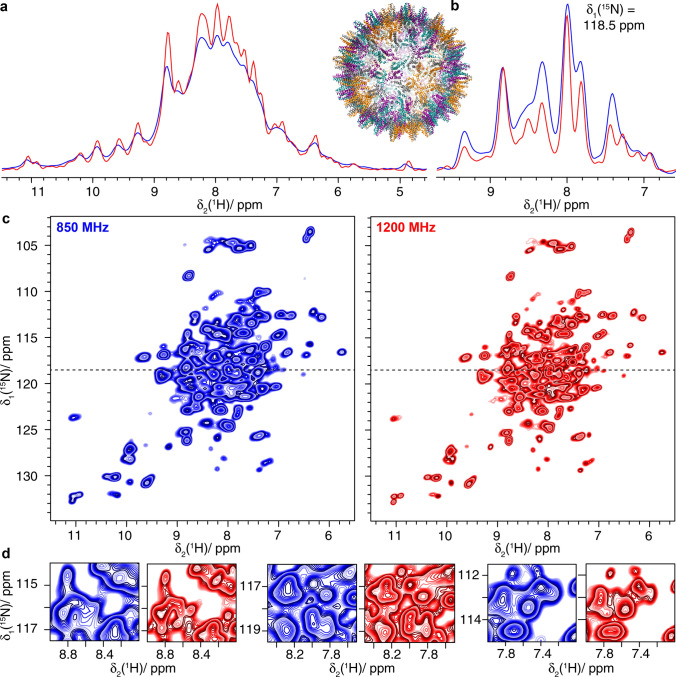
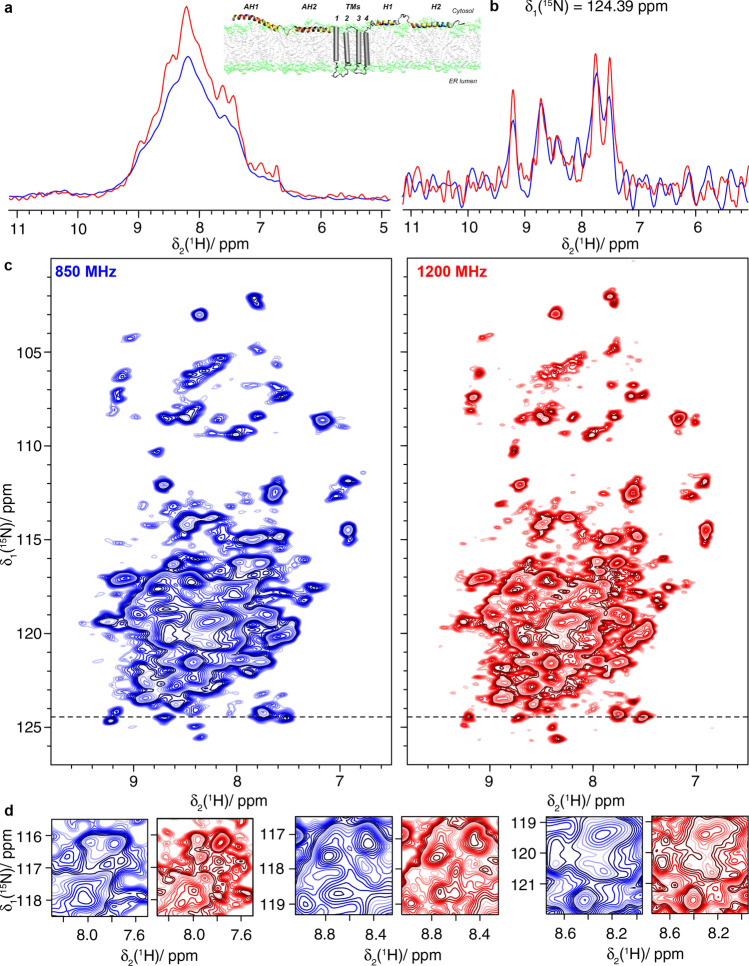
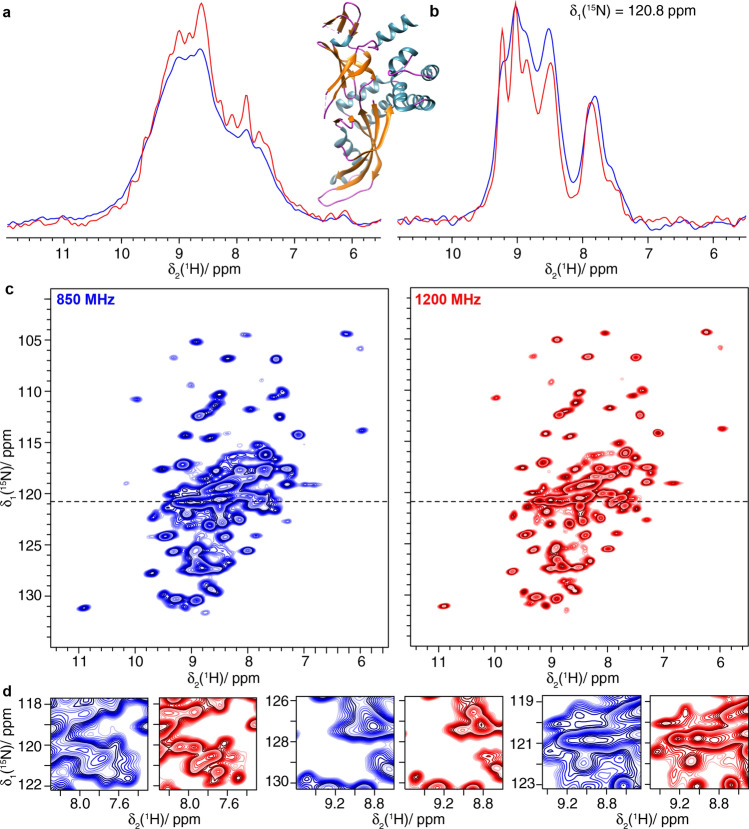
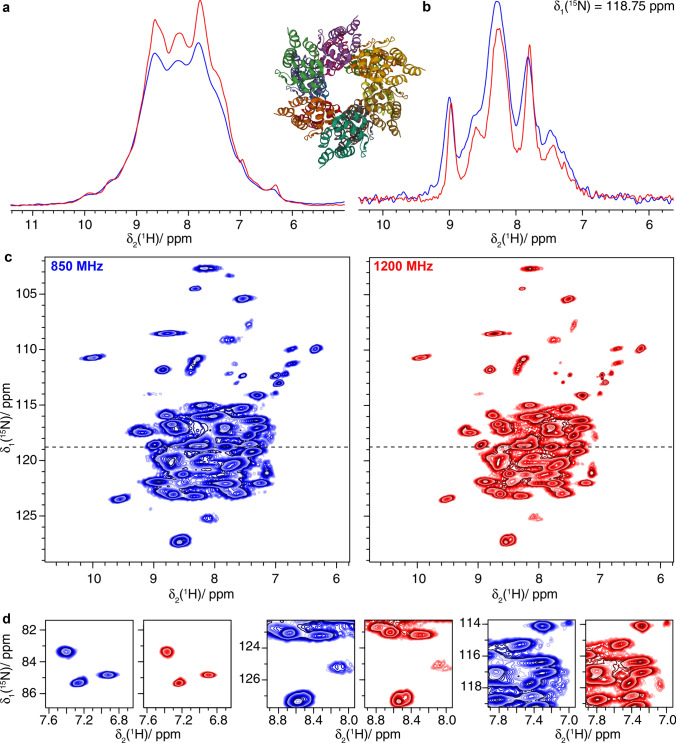
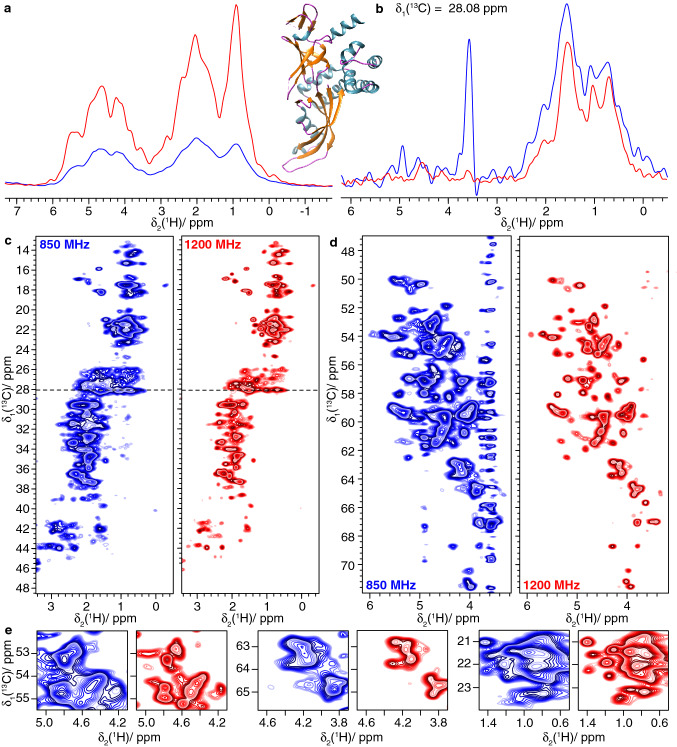
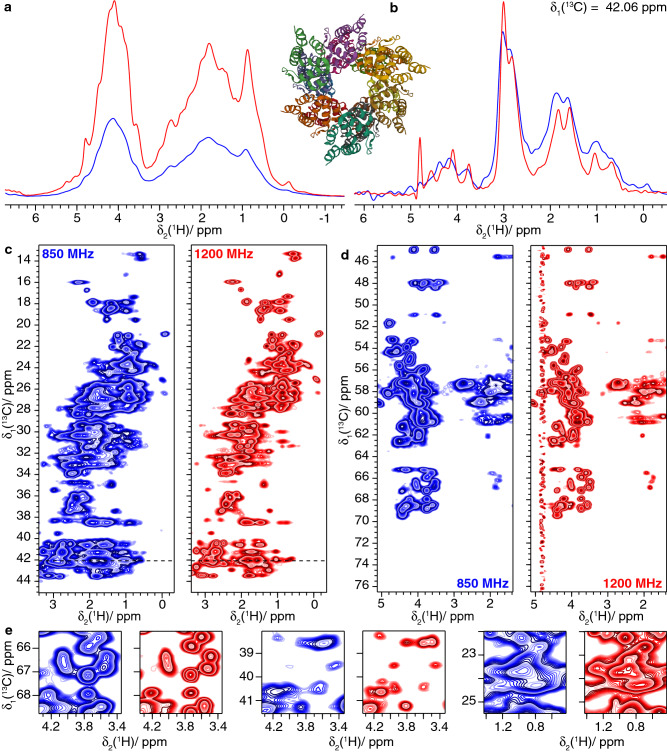
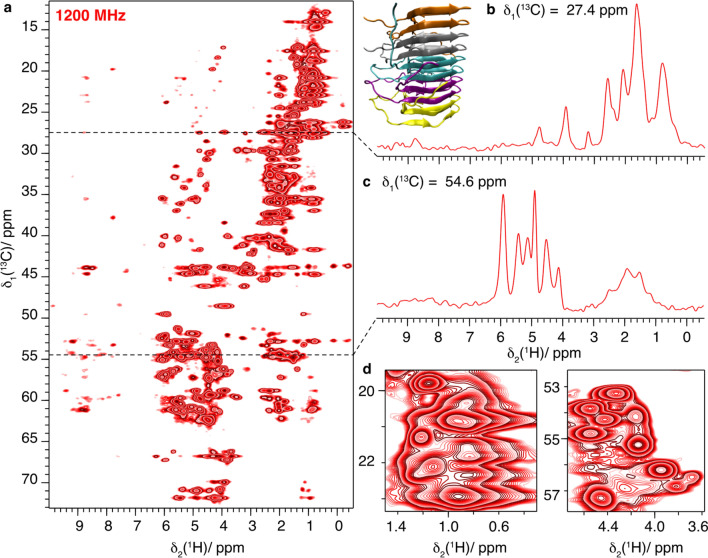
Progress in NMR in general and in biomolecular applications in particular is driven by increasing magnetic-field strengths leading to improved resolution and sensitivity of the NMR spectra. Recently, persistent superconducting magnets at a magnetic field strength (magnetic induction) of 28.2 T corresponding to 1200 MHz proton resonance frequency became commercially available. We present here a collection of high-field NMR spectra of a variety of proteins, including molecular machines, membrane proteins, viral capsids, fibrils and large molecular assemblies. We show this large panel in order to provide an overview over a range of representative systems under study, rather than a single best performing model system. We discuss both carbon-13 and proton-detected experiments, and show that in 13C spectra substantially higher numbers of peaks can be resolved compared to 850 MHz while for 1H spectra the most impressive increase in resolution is observed for aliphatic side-chain resonances.

Keywords: Biomolecular NMR; Helicases; High field; Magic-angle spinning; Solid-state NMR; Viruses.


Figures

Fig. 1
Fig. 1
HET-s(218–289) amyloid fibrils. a Structure model (PDB ID: 2RNM) (Wasmer et al. 2008) and 1D 13C-detected CP-MAS spectrum, b 1D 15N-detected CP-MAS spectrum, c 20 ms DARR spectra and d expanded regions from the spectra in c. Spectra colored in blue were recorded at 850 MHz and spectra in red were measured at 1200 MHz. CP was matched at 75 and 48 kHz for 1H and 13C at 1200 MHz and 60 and 43 kHz at 850 MHz. Experimental parameters are listed in Table S1. The two spectra were normalized using isolated well-resolved peaks and the contour levels are the same for the two spectra
Fig. 2
Fig. 2
Protein filaments of type 1 pili. a Structural model (PDB ID: 2N7H) (Habenstein et al. 2015) and 1D 13C-detected CP-MAS spectrum, b 20 ms DARR spectra and c spectral fingerprints expanded from the spectra in b. Spectra colored in blue were recorded at 850 MHz and spectra in red were measured at 1200 MHz. CP was matched at 70 and 44 kHz for 1H and 13C at 1200 MHz and at 60 and 43 kHz at 850 MHz
Fig. 3
Fig. 3
The bacterial DnaB helicase. a 1D 13C-detected CP-MAS spectra recorded at 500, 850, and 1200 MHz; b 20 ms DARR spectra recorded at the same magnetic fields as in a. c Expanded regions from the spectra in b. Spectra colored in purple were measured at 500 MHz, spectra in blue were recorded at 850 MHz and spectra in red were measured at 1200 MHz. CP was matched at 55 and 29 kHz for 1H and 13C at 1200 MHz and at 60 and 43 kHz at 500 and 850 MHz. The 1D spectra in a were scaled to a similar noise level. Structural model with each subunit colored differently (PDB ID: 4ZC0) (Bazin et al. 2015)
Fig. 4
Fig. 4
The RNA helicase and acetyltransferase TmcA. a Structural model (PDB ID: 2ZPA) (Chimnaronk et al. 2009) and 1D 13C-detected CP-MAS spectrum, b 20 ms DARR spectra and c expanded regions from the spectra in b. Spectra colored in blue were recorded at 850 MHz and spectra in red were measured at 1200 MHz. CP was matched at 70 and 44 kHz for 1H and 13C at 1200 MHz and at 60 and 43 kHz at 850 MHz
Fig. 5
Fig. 5
The African cichlid nackednavirus capsid ACNDVc. a 1D 13C-detected CP-MAS spectrum, b 20 ms DARR spectra and c expanded regions from the spectra in b. Spectra colored in blue were recorded at 850 MHz and spectra in red were measured at 1200 MHz. CP was matched at 75 and 47 kHz for 1H and 13C at 1200 MHz and at 60 and 41 kHz at 850 MHz
Fig. 6
Fig. 6
The Hepatitis B Virus Capsid dCp149. a 1D-hnH spectra and structural model (PDB ID:1QGT) (Wynne et al. 1999), b one-dimensional trace at δ1(15N) = 118.5 ppm of c 2D hNH spectra and d expanded regions from the spectra in c. Spectra colored in blue were recorded at 850 MHz and spectra in red were measured at 1200 MHz
Fig. 7
Fig. 7
The hepatitis C virus non-structural protein dNS4B. a 1D-hnH spectra and structural model based on (Gouttenoire et al. 2014), b one-dimensional trace at δ1(15N) = 124.39 ppm of c 2D hNH spectra and d expanded regions from the spectra in c. Spectra colored in blue were recorded at 850 MHz and spectra in red were measured at 1200 MHz. MAS at 100 kHz was used
Fig. 8
Fig. 8
The Rpo4/7 protein complex (Rpo4C36S/Rpo7K123C). a 1D-hnH spectra and structural model of Rpo4/7 (PDB ID: 1GO3) (Todone et al. 2001), b one-dimensional trace at δ1(15N) = 120.8 ppm of c 2D hNH spectra and d expanded regions from the spectra in c. Spectra colored in blue were recorded at 850 MHz and spectra in red were measured at 1200 MHz. All experiments used 100 kHz MAS
Fig. 9
Fig. 9
The filaments of PYRIN domain of mouse ASC. a 1D-hnH spectra and structural model of ASC filaments (PDB ID: 2N1F) (Sborgi et al. 2015), b one-dimensional trace at δ1(15N) = 118.75 ppm of c 2D hNH spectra and d expanded regions from the spectra in c. Spectra colored in blue were recorded at 850 MHz and spectra in red were measured at 1200 MHz. All experiments used 100 kHz MAS
Fig. 10
Fig. 10
The Rpo4/7 protein complex (Rpo4C36S/Rpo7K123C). a 1D-hcH spectra and structural model of Rpo4/7 (PDB 1GO3) (Todone et al. 2001), b one-dimensional trace at δ1(13C)=28.08 ppm of c, d 2D hCH spectra and e expanded regions from the spectra in c-d. Spectra colored in blue were recorded at 850 MHz and spectra in red were measured at 1200 MHz
Fig. 11
Fig. 11
Filaments of the PYRIN domain of fully protonated mouse ASC. a 1D-hcH spectrum and structural model of ASC filaments (PDB 2N1F) (Sborgi et al. 2015), b one-dimensional trace at δ1(13C) = 42.06 ppm of cc, d 2D hCH spectra and e expanded regions from the spectra in c, d. Spectra colored in blue were recorded at 850 MHz and spectra in red were measured at 1200 MHz
Fig. 12
Fig. 12
HET-s(218–289) fibrils fully protonated at 1200 MHz and 100 kHz MAS a 2D-hCH spectrum and structural model of HET-s(218–289)(PDB ID: 2RNM) (Wasmer et al. 2008), b one-dimensional trace at δ1(13C) = 118.75 ppm, c at 54.6 ppm and d expanded regions from the spectrum in a

References

    1. Abragam A. The principles of nuclear magnetism. Oxford: Oxford Science Publications; 1961.
    1. Agarwal V, Reif B. Residual methyl protonation in perdeuterated proteins for multi-dimensional correlation experiments in MAS solid-state NMR spectroscopy. J Magn Reson. 2008;194:16–24. doi: 10.1016/j.jmr.2008.05.021. - DOI - PubMed
    1. Agarwal V, Penzel S, Székely K, et al. De novo 3D structure determination from sub-milligram protein samples by solid-state 100 kHz MAS NMR spectroscopy. Angew Chem Int Ed Engl. 2014;53:12253–12256. doi: 10.1002/anie.201405730. - DOI - PubMed
    1. Andreas LB, Le Marchand T, Jaudzems K, Pintacuda G. High-resolution proton-detected NMR of proteins at very fast MAS. J Magn Reson. 2015;253:36–49. doi: 10.1016/j.jmr.2015.01.003. - DOI - PubMed
    1. Asami S, Reif B. Assignment strategies for aliphatic protons in the solid-state in randomly protonated proteins. J Biomol NMR. 2012;52:31–39. doi: 10.1007/s10858-011-9591-4. - DOI - PubMed

LinkOut - more resources