. 2021 Jun 25;17(6):e1009523.
doi: 10.1371/journal.ppat.1009523. eCollection 2021 Jun.

Highly-potent, synthetic APOBEC3s restrict HIV-1 through deamination-independent mechanisms

Affiliations

Highly-potent, synthetic APOBEC3s restrict HIV-1 through deamination-independent mechanisms

Mollie M McDonnell et al. PLoS Pathog. .

Abstract

The APOBEC3 (A3) genes encode cytidine deaminase proteins with potent antiviral and anti-retroelement activity. This locus is characterized by duplication, recombination, and deletion events that gave rise to the seven A3s found in primates. These include three single deaminase domain A3s (A3A, A3C, and A3H) and four double deaminase domain A3s (A3B, A3D, A3F, and A3G). The most potent of the A3 proteins against HIV-1 is A3G. However, it is not clear if double deaminase domain A3s have a generalized functional advantage to restrict HIV-1. In order to test whether superior restriction factors could be created by genetically linking single A3 domains into synthetic double domains, we linked A3C and A3H single domains in novel combinations. We found that A3C/A3H double domains acquired enhanced antiviral activity that is at least as potent, if not better than, A3G. Although these synthetic double domain A3s package into budding virions more efficiently than their respective single domains, this does not fully explain their gain of antiviral potency. The antiviral activity is conferred both by cytidine-deaminase dependent and independent mechanisms, with the latter correlating to an increase in RNA binding affinity. T cell lines expressing this A3C-A3H super restriction factor are able to control replicating HIV-1ΔVif infection to similar levels as A3G. Together, these data show that novel combinations of A3 domains are capable of gaining potent antiviral activity to levels similar to the most potent genome-encoded A3s, via a primarily non-catalytic mechanism.


Conflict of interest statement

The authors have declared that no competing interests exist.

Figures
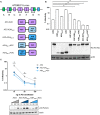
Fig 1
Fig 1. A3C/A3H double domains are more potent restriction factors than A3G.
(A) Cartoon schematic the A3 gene locus and of the A3C/A3H double domains synthesized. The Z1 domains are labeled in green, the Z2 domains in purple, and the Z3 domains in blue (light blue for A3Hhap I and dark blue for A3Hhap II). The synthetic double domains, A3C-A3H and A3H-A3C are Z2/Z3 and Z3/Z2, respectively. All double domains used in these experiments have a C-terminal 3XFLAG epitope tag. (B) Top: Single-cycle infectivity assay measuring the percent infectivity of each A3 variant against HIV-1ΔEnvΔVif normalized to transfections in the absence of A3. Cells were transfected with 100ng of A3 and 600ng of HIV-1ΔEnvΔVif pseudotyped with 100ng of VSV-g. Virus production was quantified by an RT assay (see Methods) and equal amounts of virus was used to infect SUPT1 cells. The bar graph shows an average of 3 biological replicates, each with triplicate infections (+/- SEM). Statistical differences were determined by unpaired t tests: ** P≤0.01, ns = not significant. Bottom: Representative western blot of the intracellular levels of A3 in 293Ts. Antibodies to FLAG were used to detect A3s and actin was used as a loading control. (C) Top: The % infectivity of HIV-1ΔEnvΔVif pseudotyped with VSV-g and increasing doses of transfected A3G (grey), A3C-A3Hhap II (dark blue), or A3Hhap II-A3C (light blue) are plotted, normalized to a control with no A3. The amount of each A3 plasmid transfected in ng is shown on the X-axis. Data points are an average of 3 biological replicates, with each biological replicate consisting of 3 triplicate infections (+/- SEM). Statistical differences were determined by unpaired t tests between A3G and A3C-A3Hhap II and A3G and A3Hhap II-A3C: * P ≤ 0.05, ns = not significant. Bottom: Western blot showing the intracellular expression levels of A3G, A3C-A3Hhap II, and A3Hhap II-A3C probed with anti-FLAG antibody showing intracellular expression levels for A3s and actin as a loading control. The ng of A3 transfected are denoted on top of the western blot.
Fig 2
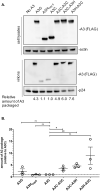
Fig 2. A3C/A3H double domains are packaged more than their single domain counterparts.
(A) Intracellular expression and packaging of A3 into virions. HIV-1ΔEnvΔVif provirus was co-transfected into 293T cells with 100ng of each A3. Top: western blot of cellular lysates probed with anti-FLAG antibody showing intracellular expression levels for A3s and actin as a loading control. Bottom: Western blot of proteins in the pelleted virions and probed with anti-FLAG antibody for A3 levels and anti-p24gag for normalization. An empty vector condition was used as a negative control and labeled no A3. A3C-A3Hhap II is shortened to A3C-A3H and A3Hhap II-A3C is shortened A3H-A3C. Western blot shown is representative of 3 biological replicates. (B) Quantification of the amount of A3 packaged relative to A3C from three biological replicate transfections. A3 packaged was calculated by dividing the abundance of A3 in the virions normalized to p24gag by the level of A3 expression in the cell normalized to actin. The amount of A3 packaged is reported relative to A3C, whose level was set to a value of 1 and denoted with the dotted line. Error bars represent the SEM. Statistical differences were determined by unpaired t tests between A3C and A3G, A3C and A3C-A3Hhap II, A3C and A3H, and A3C and A3Hhap II-A3C: * P ≤ 0.05, ** P ≤ 0.01, and ns = not significant.
Fig 3
Fig 3. A3C/A3H double domains use deaminase independent mechanisms to restrict HIV-1.
(A) Paired-end sequencing reads were analyzed for G-to-A mutations. Data is shown as frequency distribution bar graphs of the percent of reads by the number of G-to-A substitutions in each read for each A3 tested. Plasmid control (referred to as plasmid ctrl) was used as a sequencing control and a no A3 sample was used to distinguish background mutations, including reverse transcriptase-induced mutations. A3C-A3Hhap II is shortened to A3C-A3H and A3Hhap II-A3C is shortened A3H-A3C. (B) Single-cycle infectivity assay measuring the percent infectivity of each A3 variant against HIV-1ΔEnvΔVif. Catalytic knockouts of the essential glutamic acid in both N- and C- terminal domains of A3C-A3Hhap II and A3Hhap II-A3C (shortened to cat KO) were created and compared to their catalytically active counterpart. Cells are transfected with 100ng of A3 and 600ng of HIV-1ΔEnvΔVif pseudotyped with 100ng of VSV-g. Virus production was normalized and equal amounts of virus was used to infect SUPT1 cells. Results from each experiment were normalized to a no A3 control. Bar graph shows an average of 3 biological replicates, each with triplicate infections (+/- SEM). Statistical differences were determined by unpaired t tests: ns = not significant. (C) To evaluate the relative copies of late reverse transcription products, SUPT1 cells were infected with HIV-1ΔEnvΔVif and either no A3 or 100ng of A3 to test for inhibition of HIV-1 reverse transcriptase products. 18 hours later, viral cDNA was harvested and the levels of HIV-1 proviral DNA was assayed by qPCR. Each circle represents a normalized value for the respective biological replicate, with qPCR technical duplicates. A3C-A3Hhap II is shortened to A3C-A3H and A3Hhap II-A3C is shortened A3H-A3C. Each sample has been adjusted for equal viral infection and a nevirapine control. Bars represent the mean across 3 biological replicates.
Fig 4
Fig 4. A3C-A3H has increased binding affinity for the HIV-1 5’UTR.
The apparent Kd of A3 enzymes from the fluorescein labeled 497 nt RNA was analyzed by steady-state rotational anisotropy for (A) A3C-A3Hhap II (0.03 ± 0.01 nM); (B) A3Hhap II (0.52 ± 0.18 nM) and (C) A3G (6.36 ± 3.18 nM). The x-axis on each graph is different due to the different amount of protein added in order to fully saturate the RNA. Error bars represent the standard deviation from three independent experiments.
Fig 5
Fig 5. A3C-A3H suppresses HIV-1ΔVif spreading infection to day 14.
(A) Western blot of the Jurkat cells constitutively expressing no A3, A3G, or A3C-A3Hhap II (shortened to A3C-A3H) probed with anti-FLAG for the A3 levels and actin as a loading control. (B) Spreading infection kinetics of a replication-competent HIV-1 with a deletion that spans the Vif open reading frame (called HIV-1ΔVif). The Jurkat cells expressing no A3 (circles, grey line), A3G (squares, green line), or A3C-A3Hhap II (shortened to A3C-A3H, triangles, purple line) were infected at a low MOI (MOI = 0.01) in triplicates. Virus production was monitored over time by collecting supernatant and measuring RT activity (mU/mL) using a SG-PERT assay. Error bars represent the standard error across the 3 biological replicates. To compare spreading infection kinetics, area under the curve (AUC) was calculated for each biological replicate. The mean AUC and standard error of the mean are represented to the right. (C) A3 mediated hypermutation analysis of gDNA from cells harvested on day 14. Paired-end sequencing reads were analyzed for G-to-A mutations. Data is shown as frequency distribution bar graphs of the percent of reads by the number of G-to-A substitutions in each read for each A3 tested. Plasmid control was used as a sequencing control and a no A3 sample was used to distinguish mutations that occurred throughout the 14-day time course. Frequencies are calculated as the average frequency of each biological infection replicates and read counts are shown as the sum of the reads for each replicate. (D) Spreading infection kinetics of a replication-competent wtHIV-1 (LAI isolate). Jurkat cells expressing no A3 (circles, grey line), A3G (squares, green line), and A3C-A3Hhap II (shortened to A3C-A3H, triangles, purple line) were infected in triplicate at a low MOI (MOI = 0.01). Virus production was monitored over time by collecting supernatant and measuring RT activity (mU/mL) using a SG-PERT assay. Error bars represent the standard error across the 3 biological replicates. To compare spreading infection kinetics, area under the curve (AUC) was calculated for each biological replicate. The mean AUC and standard error of the mean are represented to the right. (E) Western blot of cell lysates collected on day 14 from HIV-1ΔVif infection (B), shortened to ΔVif, and from wtHIV-1 infection (D), shortened to wt. Cells expressing A3G or A3C-A3Hhap II were evaluated for their intracellular expression levels of A3 in each of the triplicate infections. The anti-FLAG antibody was used to probe for the FLAG tagged A3s and actin was used as a loading control.

Similar articles

Cited by

References

    1. Daugherty MD, Malik HS. Rules of engagement: Molecular insights from host-virus arms races. Annu Rev Genet. 2012;46: 677–700. doi: 10.1146/annurev-genet-110711-155522 - DOI - PubMed
    1. Duggal NK, Emerman M. Evolutionary conflicts between viruses and restriction factors shape immunity. Nat Rev Immunol. 2012;12: 687–695. doi: 10.1038/nri3295 - DOI - PMC - PubMed
    1. Schilling M, Bulli L, Weigang S, Graf L, Naumann S, Patzina C, et al.. Human MxB Protein Is a Pan-herpesvirus Restriction Factor. J Virol. 2018;92: 1–11. doi: 10.1128/JVI.01056-18 - DOI - PMC - PubMed
    1. Verhelst J, Hulpiau P, Saelens X. Mx Proteins: Antiviral Gatekeepers That Restrain the Uninvited. Microbiol Mol Biol Rev. 2013;77: 551–566. doi: 10.1128/MMBR.00024-13 - DOI - PMC - PubMed
    1. Liu Z, Pan Q, Ding S, Qian J, Xu F, Zhou J, et al.. The interferon-inducible MxB protein inhibits HIV-1 infection. Cell Host Microbe. 2013;14: 398–410. doi: 10.1016/j.chom.2013.08.015 - DOI - PubMed

Publication types