

The FOS/AP-1 Regulates Metabolic Changes and Cholesterol Synthesis in Human Periovulatory Granulosa Cells
- PMID: 34171102
- PMCID: PMC8315293
- DOI: 10.1210/endocr/bqab127
The FOS/AP-1 Regulates Metabolic Changes and Cholesterol Synthesis in Human Periovulatory Granulosa Cells
Abstract
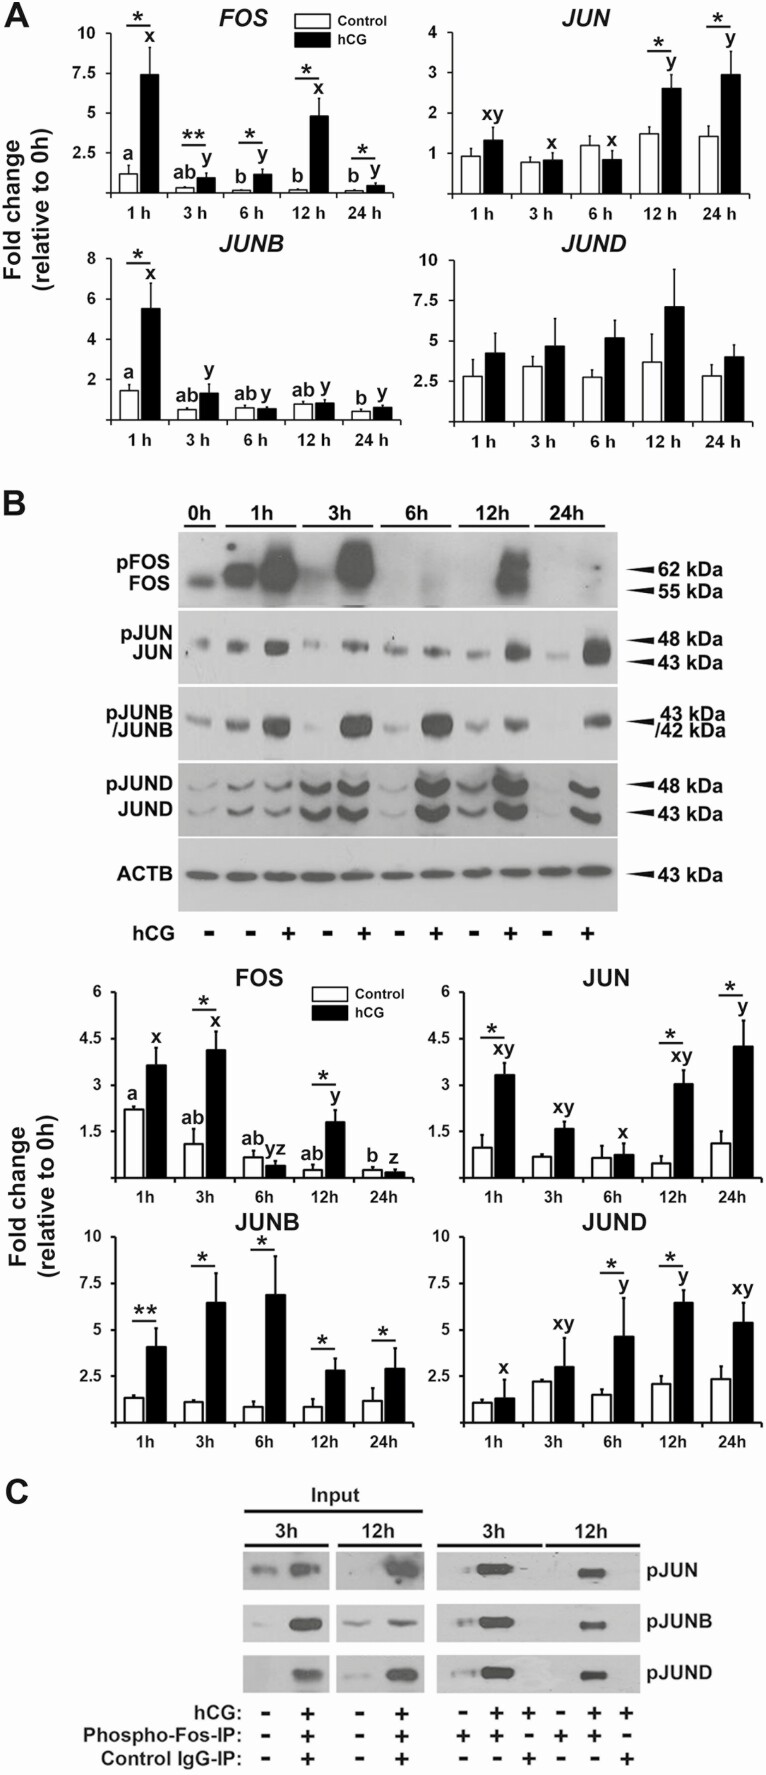
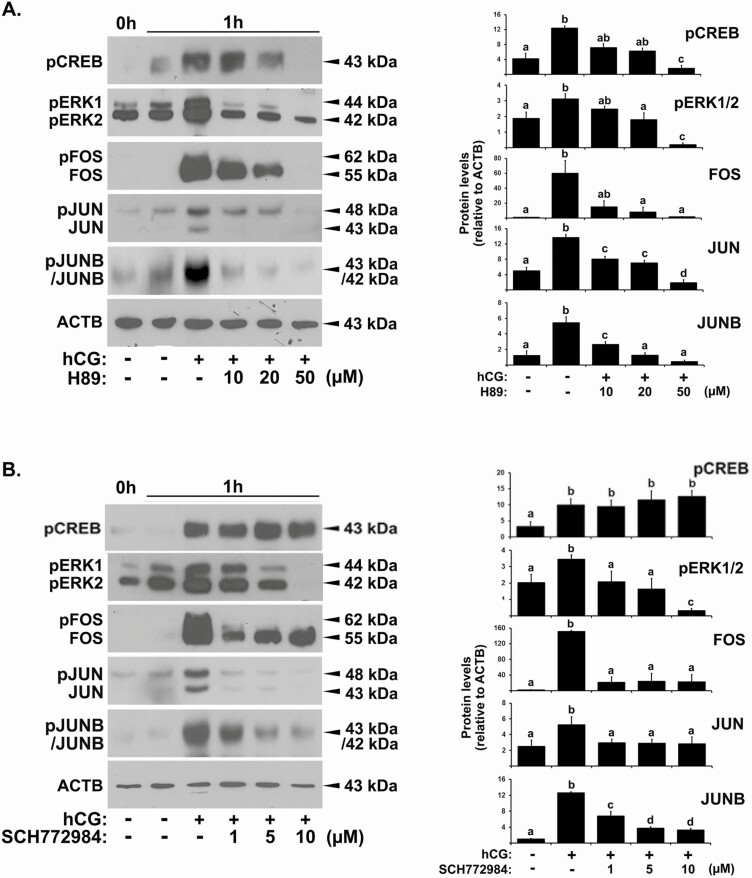
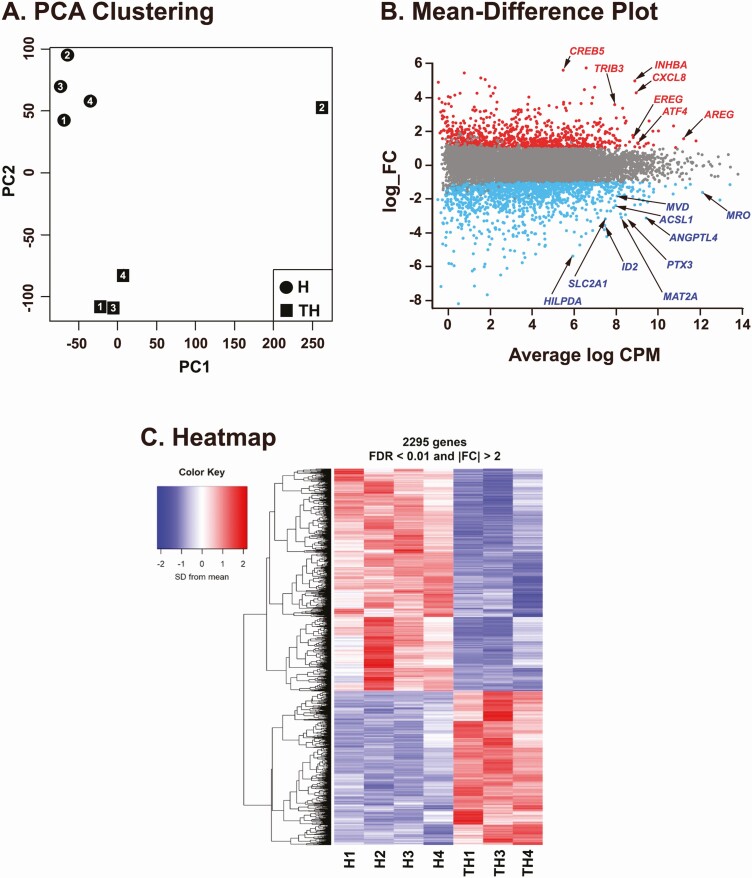
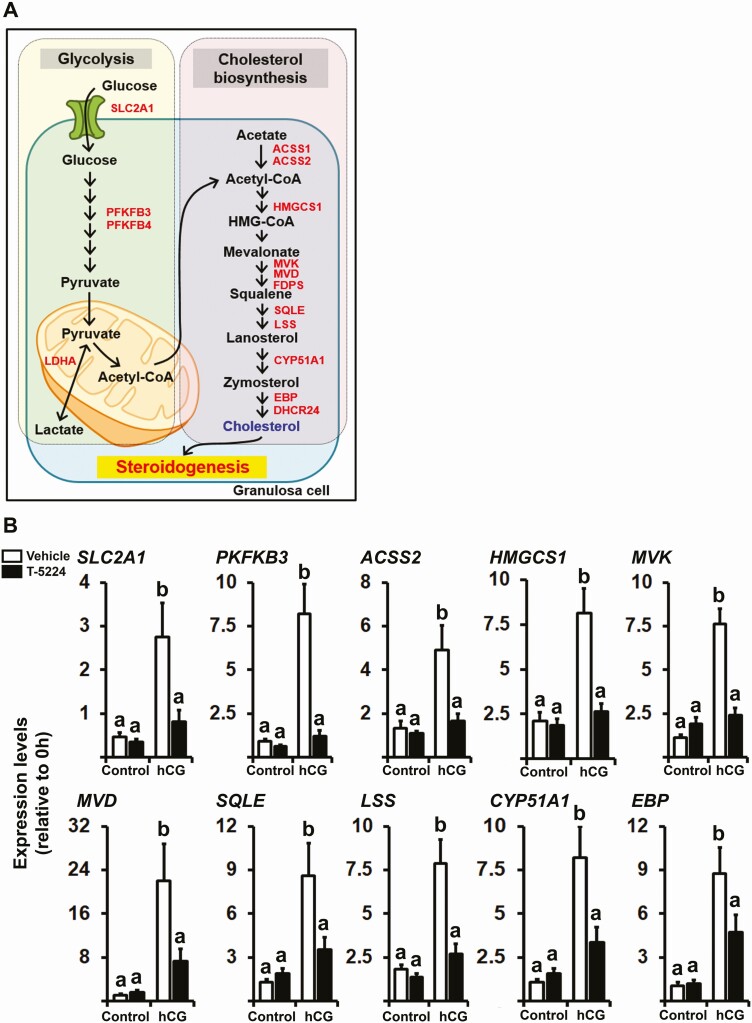
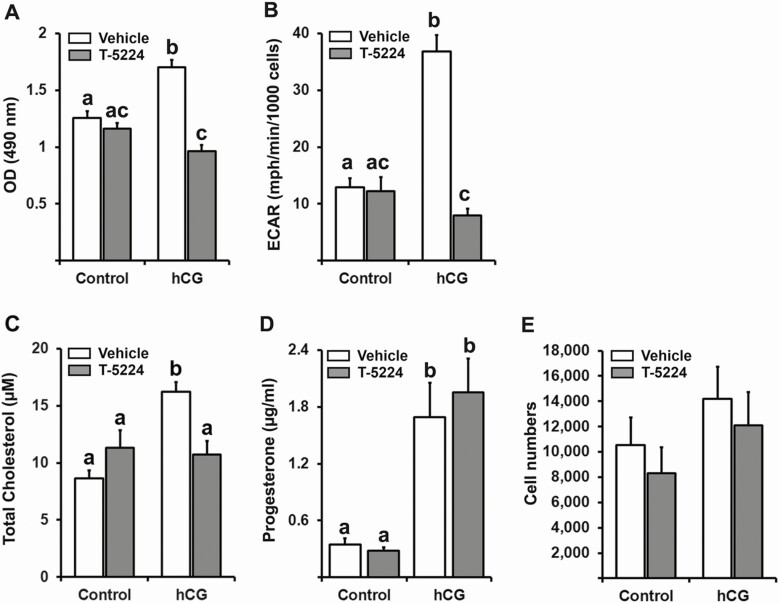
FOS, a subunit of the activator protein-1 (AP-1) transcription factor, has been implicated in various cellular changes. In the human ovary, the expression of FOS and its heterodimeric binding partners JUN, JUNB, and JUND increases in periovulatory follicles. However, the specific role of the FOS/AP-1 remains elusive. The present study determined the regulatory mechanisms driving the expression of FOS and its partners and functions of FOS using primary human granulosa/lutein cells (hGLCs). Human chorionic gonadotropin (hCG) induced a biphasic increase in the expression of FOS, peaking at 1 to 3 hours and 12 hours. The levels of JUN proteins were also increased by hCG, with varying expression patterns. Coimmunoprecipitation analyses revealed that FOS is present as heterodimers with all JUN proteins. hCG immediately activated protein kinase A and p42/44MAPK signaling pathways, and inhibitors for these pathways abolished hCG-induced increases in the levels of FOS, JUN, and JUNB. To identify the genes regulated by FOS, high-throughput RNA sequencing was performed using hGLC treated with hCG ± T-5224 (FOS inhibitor). Sequencing data analysis revealed that FOS inhibition affects the expression of numerous genes, including a cluster of genes involved in the periovulatory process such as matrix remodeling, prostaglandin synthesis, glycolysis, and cholesterol biosynthesis. Quantitative PCR analysis verified hCG-induced, T-5224-regulated expression of a selection of genes involved in these processes. Consistently, hCG-induced increases in metabolic activities and cholesterol levels were suppressed by T-5224. This study unveiled potential downstream target genes of and a role for the FOS/AP-1 complex in metabolic changes and cholesterol biosynthesis in granulosa/lutein cells of human periovulatory follicles.
Keywords: FOS; JUN proteins; granulosa cells; human; ovulation.
© The Author(s) 2021. Published by Oxford University Press on behalf of the Endocrine Society. All rights reserved. For permissions, please e-mail: journals.permissions@oup.com.
Figures


Similar articles
-
FOS, a Critical Downstream Mediator of PGR and EGF Signaling Necessary for Ovulatory Prostaglandins in the Human Ovary.J Clin Endocrinol Metab. 2018 Nov 1;103(11):4241-4252. doi: 10.1210/jc.2017-02532. J Clin Endocrinol Metab. 2018. PMID: 30124866 Free PMC article.
-
Expression and distribution of AP-1 transcription factors in the porcine ovary.Biol Reprod. 2003 Jul;69(1):64-74. doi: 10.1095/biolreprod.102.013995. Epub 2003 Feb 19. Biol Reprod. 2003. PMID: 12606371
-
Gonadotropin regulation of c-fos and c-jun messenger ribonucleic acids in cultured rat granulosa cells.Mol Cell Endocrinol. 1992 Dec;90(1):17-25. doi: 10.1016/0303-7207(92)90096-o. Mol Cell Endocrinol. 1992. PMID: 1338729
-
Bone development and inflammatory disease is regulated by AP-1 (Fos/Jun).Ann Rheum Dis. 2010 Jan;69 Suppl 1:i86-88. doi: 10.1136/ard.2009.119396. Ann Rheum Dis. 2010. PMID: 19995753 Review.
-
Functions of AP1 (Fos/Jun) in bone development.Ann Rheum Dis. 2002 Nov;61 Suppl 2(Suppl 2):ii40-2. doi: 10.1136/ard.61.suppl_2.ii40. Ann Rheum Dis. 2002. PMID: 12379619 Free PMC article. Review.
Cited by
-
Single-cell RNA-seq analysis and cell-cluster deconvolution of the human preovulatory follicular fluid cells provide insights into the pathophysiology of ovarian hyporesponse.Front Endocrinol (Lausanne). 2022 Oct 21;13:945347. doi: 10.3389/fendo.2022.945347. eCollection 2022. Front Endocrinol (Lausanne). 2022. PMID: 36339426 Free PMC article.
-
NRF2 is a spatiotemporal metabolic hub essential for the polyfunctionality of Th2 cells.Proc Natl Acad Sci U S A. 2024 Jul 9;121(28):e2319994121. doi: 10.1073/pnas.2319994121. Epub 2024 Jul 3. Proc Natl Acad Sci U S A. 2024. PMID: 38959032 Free PMC article.
-
Identification of Gene Markers Associated with COVID-19 Severity and Recovery in Different Immune Cell Subtypes.Biology (Basel). 2023 Jul 2;12(7):947. doi: 10.3390/biology12070947. Biology (Basel). 2023. PMID: 37508378 Free PMC article.
-
Identification of hub genes associated with acute kidney injury induced by renal ischemia-reperfusion injury in mice.Front Physiol. 2022 Sep 29;13:951855. doi: 10.3389/fphys.2022.951855. eCollection 2022. Front Physiol. 2022. PMID: 36246123 Free PMC article.
-
Identification of central regulators related to abdominal fat deposition in chickens based on weighted gene co-expression network analysis.Poult Sci. 2024 Mar;103(3):103436. doi: 10.1016/j.psj.2024.103436. Epub 2024 Jan 5. Poult Sci. 2024. PMID: 38237326 Free PMC article.
References
Publication types
MeSH terms
Substances
Grants and funding
LinkOut - more resources
Full Text Sources
Medical
Research Materials
Miscellaneous
