. 2021 Sep;14(5):1990-2008.
doi: 10.1111/1751-7915.13871. Epub 2021 Jun 25.

Strain diversity of plant-associated Lactiplantibacillus plantarum

Affiliations

Strain diversity of plant-associated Lactiplantibacillus plantarum

Annabelle O Yu et al. Microb Biotechnol. 2021 Sep.

Abstract

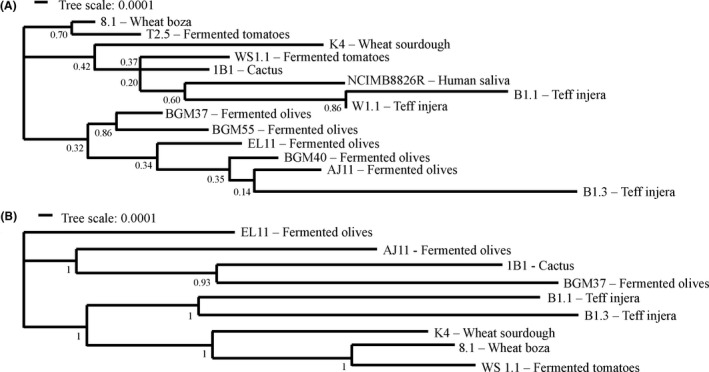
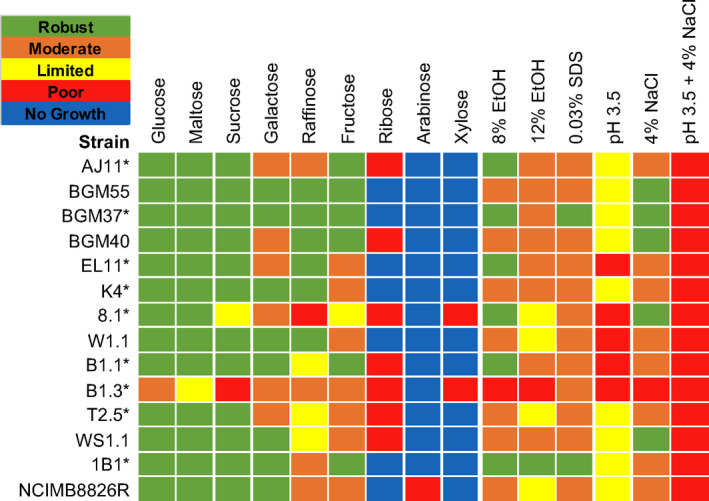
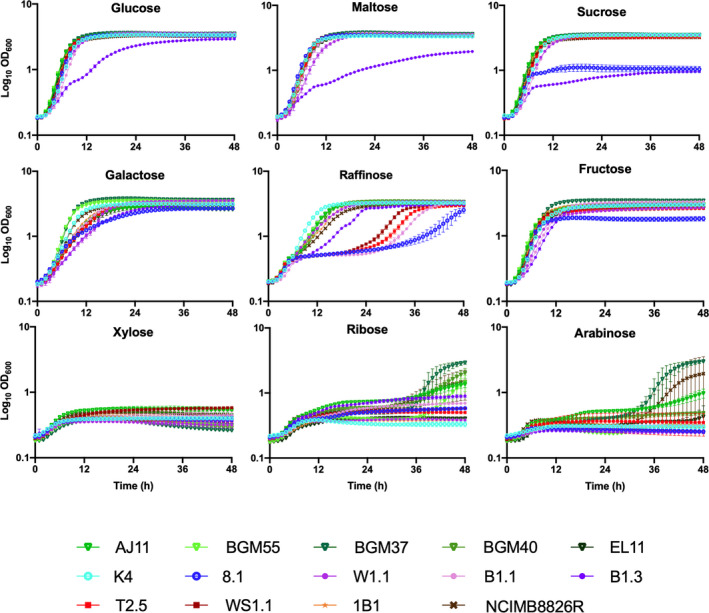
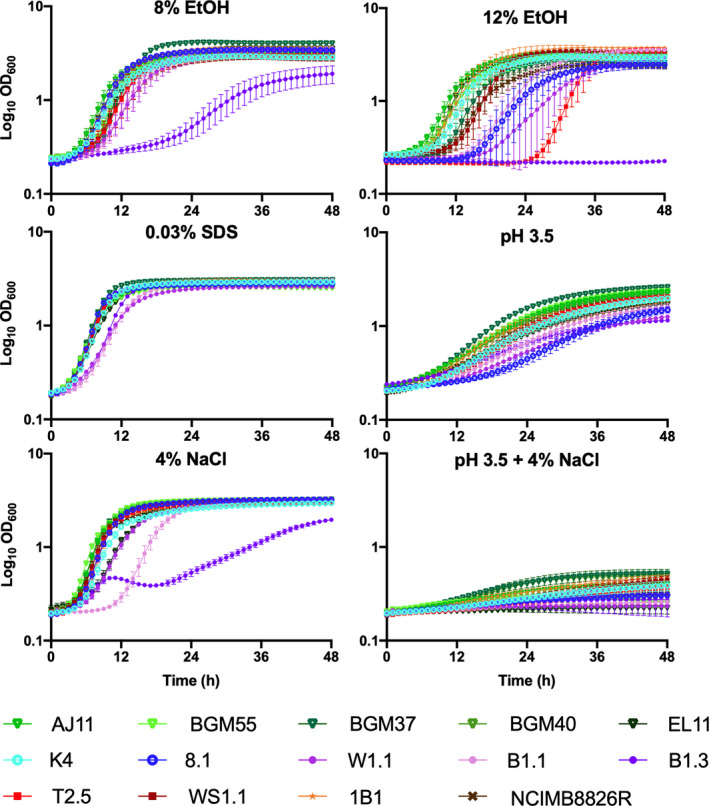
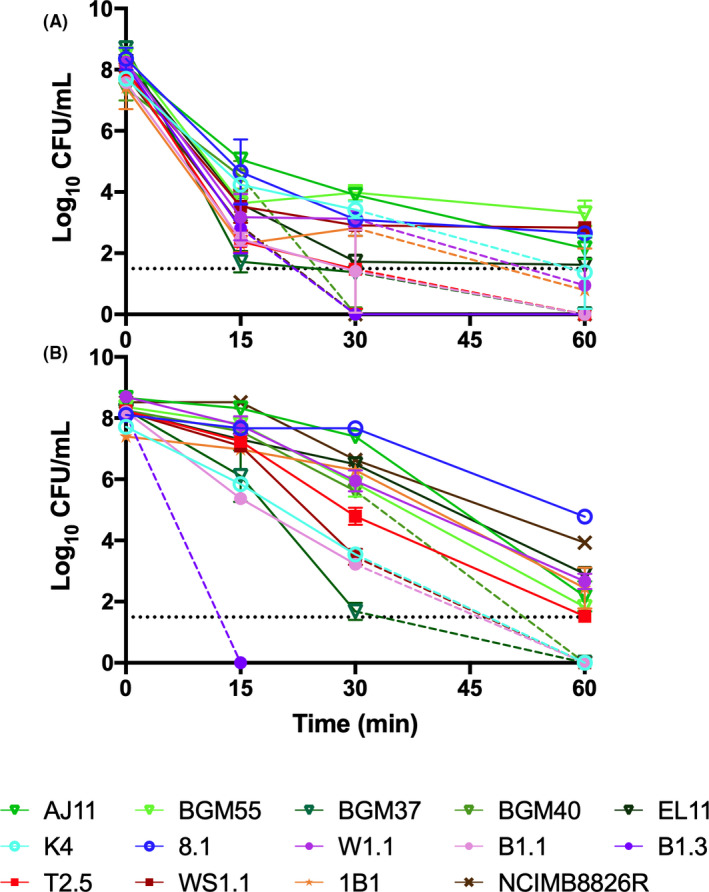
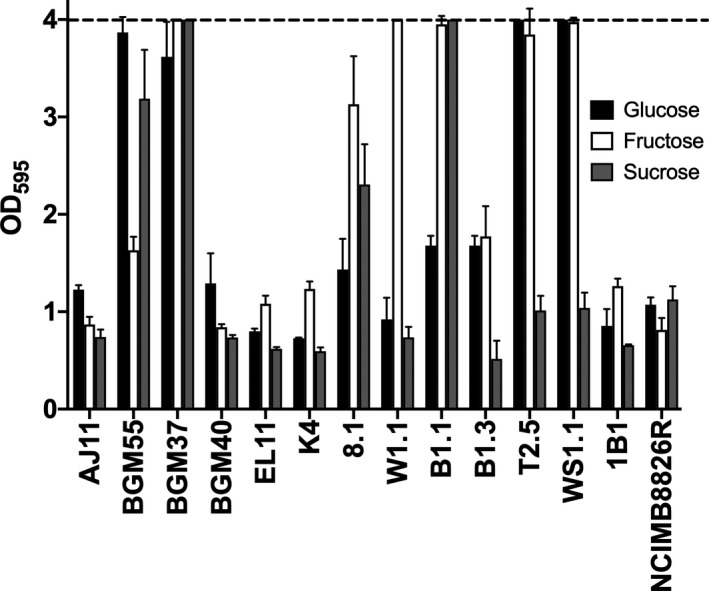
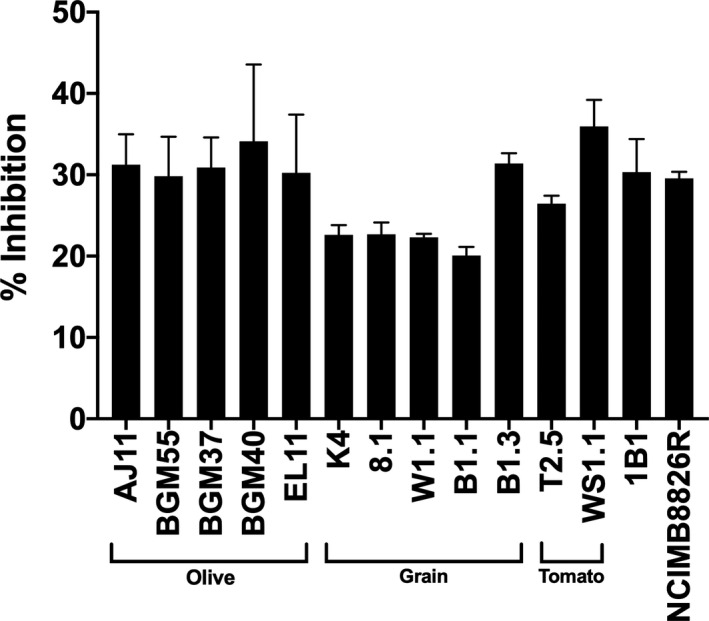
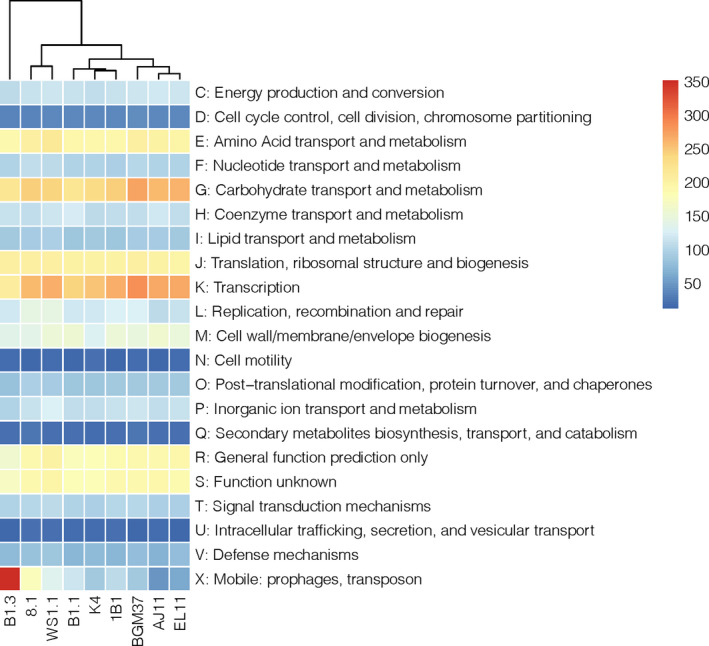
Lactiplantibacillus plantarum (formerly Lactobacillus plantarum) is a lactic acid bacteria species found on plants that is essential for many plant food fermentations. In this study, we investigated the intraspecific phenotypic and genetic diversity of 13 L. plantarum strains isolated from different plant foods, including fermented olives and tomatoes, cactus fruit, teff injera, wheat boza and wheat sourdough starter. We found that strains from the same or similar plant food types frequently exhibited similar carbohydrate metabolism and stress tolerance responses. The isolates from acidic, brine-containing ferments (olives and tomatoes) were more resistant to MRS adjusted to pH 3.5 or containing 4% w/v NaCl, than those recovered from grain fermentations. Strains from fermented olives grew robustly on raffinose as the sole carbon source and were better able to grow in the presence of ethanol (8% v/v or sequential exposure of 8% (v/v) and then 12% (v/v) ethanol) than most isolates from other plant types and the reference strain NCIMB8826R. Cell free culture supernatants from the olive-associated strains were also more effective at inhibiting growth of an olive spoilage strain of Saccharomyces cerevisiae. Multi-locus sequence typing and comparative genomics indicated that isolates from the same source tended to be genetically related. However, despite these similarities, other traits were highly variable between strains from the same plant source, including the capacity for biofilm formation and survival at pH 2 or 50°C. Genomic comparisons were unable to resolve strain differences, with the exception of the most phenotypically impaired and robust isolates, highlighting the importance of utilizing phenotypic studies to investigate differences between strains of L. plantarum. The findings show that L. plantarum is adapted for growth on specific plants or plant food types, but that intraspecific variation may be important for ecological fitness and strain coexistence within individual habitats.


Conflict of interest statement

The authors declare that the research was conducted in the absence of any commercial or financial relationships that could be construed as a potential conflict of interest.

Figures

Fig. 1
Fig. 1
Phylogenetic relationships between Lactiplantibacillus plantarum strains. A. Phylogenetic relationships of 14 strains of L. plantarum based on MLST profiles with pheS, pyrG, uvrC, recA, clpX, murC, groEL and murE (Table S8). B. Relationships of nine L. plantarum strains based on concatenated core protein sequences using the maximum likelihood method with bootstrap values calculated from 500 replicates using Mega (7.0) (Kumar et al., 2016).
Fig. 2
Fig. 2
Lactiplantibacillusplantarum phenotype profiles. Area under the curve (AUC) values were used to illustrate L. plantarum capacities to grow in mMRS containing different sugars and in mMRS‐glucose in the presence of 8% (v/v) ethanol (EtOH), 8% (v/v) ethanol and then 12% (v/v) ethanol (12% ethanol), 0.03% (w/v) SDS, 4% (w/v) NaCl or set at pH 3.5 without or with 4% (w/v) NaCl. AUC values for the growth curves were ranked as ‘robust’ (AUC between 150 and 115), ‘moderate’ (AUC between 114 and 80), ‘limited’ (AUC between 79 and 45), ‘poor’ (AUC < 45) or ‘no growth’ (AUC was equivalent to the strain growth in mMRS lacking a carbohydrate source). L. plantarum growth in mMRS‐glucose supplemented with an equal volume of water instead of ethanol, NaCl or SDS was not significantly different compared to growth in mMRS‐glucose (P > 0.05). * indicates strains examined by whole genome sequencing.
Fig. 3
Fig. 3
Growth of Lactiplantibacillus plantarum in mMRS containing different mono‐, di‐ and tri‐saccharides. L. plantarum was incubated in mMRS containing 2% (w/v) of each sugar at 30°C for 48 h. The avg ± stdev OD600 values of three replicates for each strain are shown.
Fig. 4
Fig. 4
Growth of Lactiplantibacillus plantarum in mMRS‐glucose exposed to different environmental stresses. L. plantarum was incubated in mMRS‐glucose containing 8% (v/v) ethanol (EtOH), 12% (v/v) ethanol, 0.03% (w/v) SDS or 4% (w/v) NaCl with or without adjustment to pH 3.5 and incubated at 30°C for 48 h. The avg ± stdev OD600 values of three replicates for each strain are shown.
Fig. 5
Fig. 5
Survival of Lactiplantibacillus plantarum at (A) pH 2 and at (B) 50°C. (A) Viable cells were enumerated after 0, 15, 30 and 60 min of incubation in physiological saline at pH 2 or (B) in PBS at 50°C. The dashed lines indicate when the number of viable cells was below the detection limit (34 CFU ml−1). The avg ± stdev CFU ml−1 values of three replicates for each strain are shown.
Fig. 6
Fig. 6
Lactiplantibacillusplantarum biofilm formation during growth in mMRS with glucose, fructose or sucrose. L. plantarum was incubated in mMRS‐glucose, mMRS‐fructose and mMRS‐sucrose in 96‐well, polystyrene microtiter plates at 30°C for 48 h. The non‐adherent cells were removed by washing with PBS. The remaining cells were stained with 0.05% crystal violet (CV). OD595 values of wells without cells did not exceed 0.22. The upper detection limit as indicated by the stippled line was an OD595 of 4.0. The avg ± stdev OD595 values of three replicate wells after CV staining are shown.
Fig. 7
Fig. 7
Saccharomycescerevisiae growth inhibition in the presence of Lactiplantibacillus plantarum CFCS. S. cerevisiae UCDFST‐09‐448 was incubated in a 1:1 ratio of 2X YM and pH adjusted L. plantarum CFCS from cMRS (pH 3.8). Growth was measured by monitoring the change in OD600 over 24 h. Per cent inhibition was determined by comparing the final OD600 of S. cerevisiae incubated in the presence of CFCS to cells incubated in a 1:1 ratio of 2X YM and pH adjusted (pH 3.8) cMRS (pH 3.8).
Fig. 8
Fig. 8
Distribution of COG Categories across Lactiplantibacillus plantarum genomes. Hierarchical clustering of L. plantarum based on the number of gene clusters assigned to each functional COG category. Number of gene clusters present in each strain is indicated by the colour gradient.

Similar articles

Cited by

References

    1. Altschul, S.F., Gish, W., Miller, W., Myers, E.W., and Lipman, D.J. (1990) Basic local alignment search tool. J Mol Biol 215: 403–410. - PubMed
    1. Aquilanti, L., Santarelli, S., Silvestri, G., Osimani, A., Petruzzelli, A., and Clementi, F. (2007) The microbial ecology of a typical Italian salami during its natural fermentation. Int J Food Microbiol 120: 136–145. - PubMed
    1. Barache, N., Ladjouzi, R., Belguesmia, Y., Bendali, F., and Drider, D. (2020) Abundance of Lactobacillus plantarum strains with beneficial attributes in blackberries (Rubus sp.), fresh figs (Ficus carica), and prickly pears (Opuntia ficus‐indica) grown and harvested in Algeria. Probiot Antimicro Protein 12: 1514–1523. - PubMed
    1. Benedict, M.N., Henriksen, J.R., Metcalf, W.W., Whitaker, R.J., and Price, N.D. (2014) ITEP: An integrated toolkit for exploration of microbial pan‐genomes. BMC Genom 15: 8. - PMC - PubMed
    1. Blom, J., Kreis, J., Spänig, S., Juhre, T., Bertelli, C., Ernst, C., and Goesmann, A. (2016) EDGAR 2.0: an enhanced software platform for comparative gene content analyses. Nucleic Acids Res 44: W22–W28. - PMC - PubMed

Publication types

Associated data