. 2021 Jul 12;39(7):999-1014.e8.
doi: 10.1016/j.ccell.2021.06.003. Epub 2021 Jun 24.

The AML microenvironment catalyzes a stepwise evolution to gilteritinib resistance

Affiliations

The AML microenvironment catalyzes a stepwise evolution to gilteritinib resistance

Sunil K Joshi et al. Cancer Cell. .

Abstract

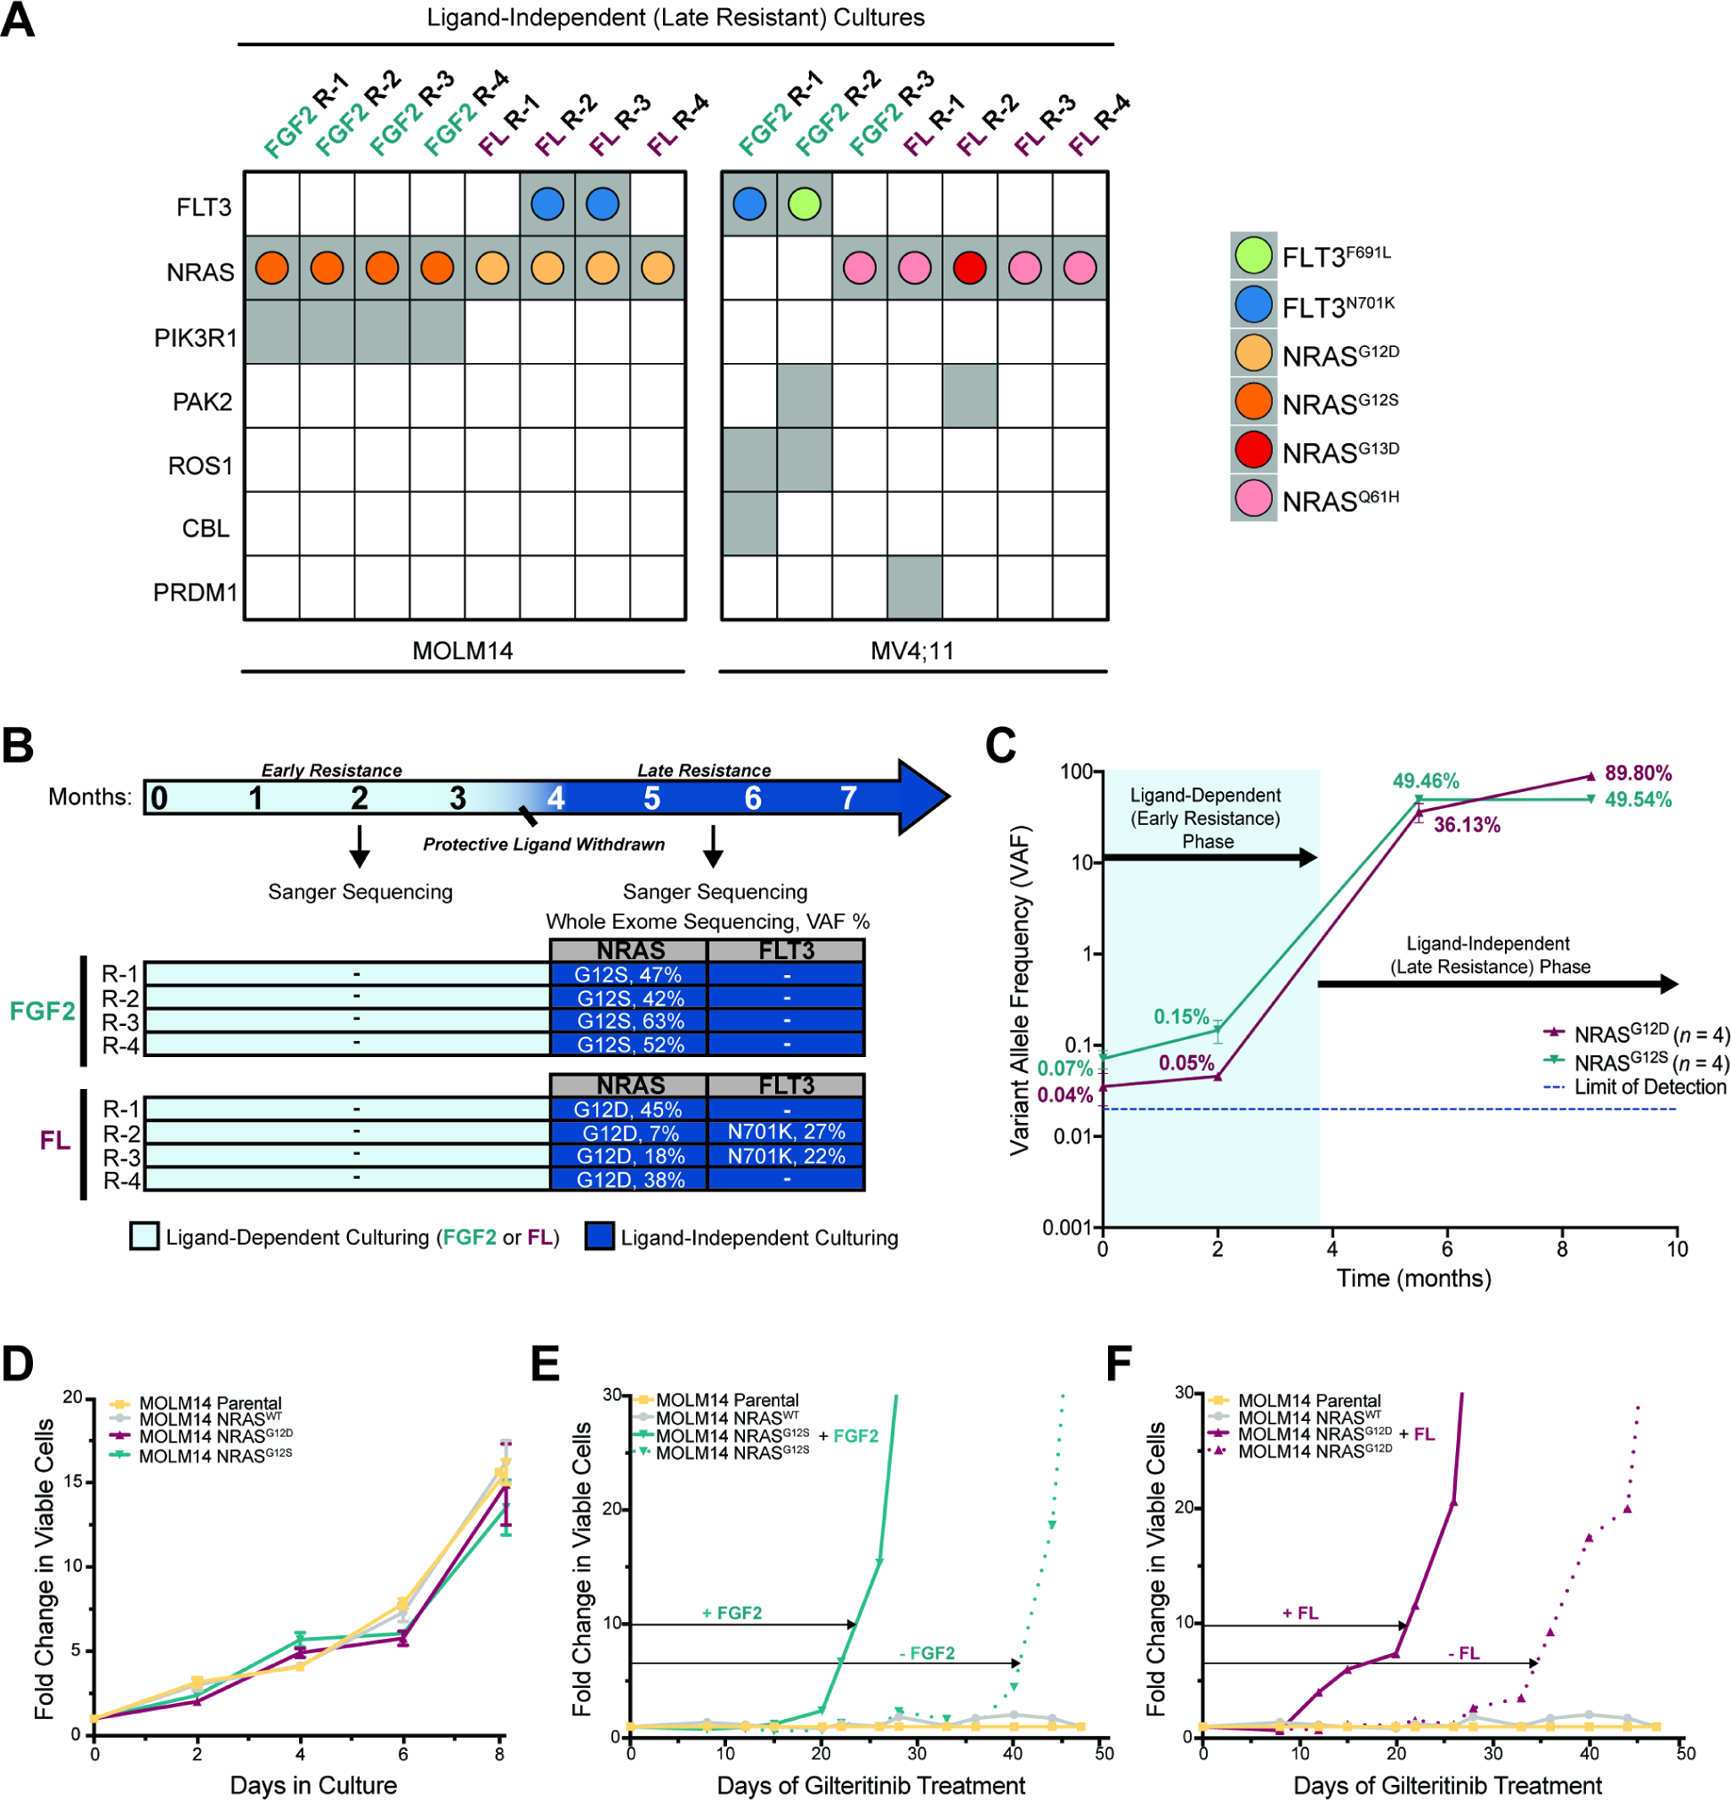
Our study details the stepwise evolution of gilteritinib resistance in FLT3-mutated acute myeloid leukemia (AML). Early resistance is mediated by the bone marrow microenvironment, which protects residual leukemia cells. Over time, leukemia cells evolve intrinsic mechanisms of resistance, or late resistance. We mechanistically define both early and late resistance by integrating whole-exome sequencing, CRISPR-Cas9, metabolomics, proteomics, and pharmacologic approaches. Early resistant cells undergo metabolic reprogramming, grow more slowly, and are dependent upon Aurora kinase B (AURKB). Late resistant cells are characterized by expansion of pre-existing NRAS mutant subclones and continued metabolic reprogramming. Our model closely mirrors the timing and mutations of AML patients treated with gilteritinib. Pharmacological inhibition of AURKB resensitizes both early resistant cell cultures and primary leukemia cells from gilteritinib-treated AML patients. These findings support a combinatorial strategy to target early resistant AML cells with AURKB inhibitors and gilteritinib before the expansion of pre-existing resistance mutations occurs.

Keywords: AML; Aurora kinase B; FLT3; NRAS; drug resistance; gilteritinib; lipid metabolism; quizartinib; tumor microenvironment; tyrosine kinase inhibitor.


Conflict of interest statement

Declaration of interests B.J.D. potential competing interests—SAB: Aileron Therapeutics, Therapy Architects (ALLCRON), Cepheid, Vivid Biosciences, Celgene, RUNX1 Research Program, Novartis, Gilead Sciences (inactive), Monojul (inactive); SAB & Stock: Aptose Biosciences, Blueprint Medicines, EnLiven Therapeutics, Iterion Therapeutics, Third Coast Therapeutics, GRAIL (SAB inactive); Scientific Founder: MolecularMD (inactive, acquired by ICON); Board of Directors & Stock: Amgen, Vincera Pharma; Board of Directors: Burroughs Wellcome Fund, CureOne; Joint Steering Committee: Beat AML LLS; Founder: VB Therapeutics; Sponsored Research Agreement: EnLiven Therapeutics; Clinical Trial Funding: Novartis, Bristol-Myers Squibb, Pfizer; Royalties from Patent 6958335 (Novartis exclusive license) and OHSU and Dana-Farber Cancer Institute (one Merck exclusive license and one CytoImage, Inc., exclusive license). E.T. potential competing interests—Advisory Board/Consulting: Abbvie, Agios, Astellas, Daiichi-Sankyo; Clinical Trial Funding: Janssen, Incyte, LLS BeatAML. Stock options: Notable Labs. J.W.T. potential competing interests—research support: Agios, Aptose, Array, AstraZeneca, Constellation, Genentech, Gilead, Incyte, Janssen, Petra, Seattle Genetics, Syros, Tolero and Takeda. A.D. potential competing interests—founder: Omix Technologies, Inc., and Altis Biosciences, LLC; Consultant: Hemanext Inc. All other authors declare no potential competing interests.

Figures

Figure 1:
Figure 1:. Emergence of early and late gilteritinib resistant cultures.
A. MOLM14 parental cells were treated with a gradient of gilteritinib ± recombinant FGF2 or FL (10 ng/mL). Viability was measured after 72 hours and normalized to untreated cells. The mean of five replicates ± SE are shown. B. MOLM14 cells were cultured continuously with 100 nM gilteritinib ± FGF2 or FL (10 ng/mL; N = 4 for each). Mean fold increase in viable cells is plotted ± SE. C. Immunoblot blot analyses of MOLM14 parental cells treated for 48 hours with 100 nM gilteritinib or DMSO (first two lanes of each panel) compared with early (left panel, lanes 3 – 10) and late (right panel, lanes 3 – 10) extended gilteritinib resistant MOLM14 cultures. D. Graphic summary of immunoblot results from early and late gilteritinib resistant cultures. E. Schematic of approach to study the evolution of gilteritinib resistance.
Figure 2:
Figure 2:. NRAS mutations are enriched in late but not early resistance.
A. Mutations (gray squares) identified by WES in late gilteritinib resistant MOLM14 and MV4;11 replicate cultures. AML drivers or genes in common cancer pathways are shown. Colored dots within the gray squares represent specific FLT3 or NRAS mutations. B. Overlap between WES analyses and mutation confirmation by Sanger sequencing. Arrows indicate timepoints at which WES or Sanger sequencing were performed. Mutations not detected are indicated with “-”. C. ddPCR analyses for detection of NRAS G12S/D mutations in parental, ligand-dependent, and independent MOLM14 cultures over time. Mean of 4 biological replicates ± SE are shown. D. NRAS G12S/D mutations provide no growth advantage relative to MOLM14 parental or NRASWT cells in the absence of gilteritinib. Fold change in number of viable cells relative to day 0 is plotted. Mean of triplicates ± SE are shown. E-F. NRAS mutant cell lines develop resistance to 100 nM gilteritinib treatment after one month in culture, whereas MOLM14 parental and NRASWT do not. FGF2 or FL (10ng/mL), accelerate development of resistance (solid vs. dotted lines).
Figure 3:
Figure 3:. Early gilteritinib resistance is multifactorial while late resistance exhibits dependency on NRAS.
A. Genome-wide CRISPR resensitization screen workflow. B. Volcano plots display results from CRISPR resensitization screens performed on FGF2 (left) and FL (right) early gilteritinib resistant (R-4) MOLM14 cells. Mid Log2 fold change is shown per genes. Only sgRNAs that significantly decrease in gilteritinib-treated cells relative to DMSO-treated cells (p < 0.05) are shown. C. Volcano plot combining results from two independent CRISPR resensitization screens performed with FGF2 and FL late gilteritinib resistant (R-4) MOLM14 cells. Mid Log2 fold change versus P-values(-Log(RRA P-value)) are plotted(Kolde et al., 2012). Horizontal lines connect genes of highest significance in both screens. D. Growth curves of NRAS knockout single clones in FGF2 (top) and FL (bottom) late cells following treatment with gilteritinib. Viability of gilteritinib-treated cells was measured after 72 hours and normalized to untreated cells. Mean ± SE are shown. E. WES and CRISPR-Cas implicate importance of NRAS in late resistance. F. Schematic of NRAS signaling, downstream effectors, and pertinent small-molecule inhibitors. G-J. FGF2 (G, I) or FL (H, J) late cells were treated with MEK (selumetinib) or PI3K (taselisib) inhibitors alone or in combination with gilteritinib. Viability was measured after 72 hours and normalized to untreated cells. Mean of triplicates ± SE are shown.
Figure 4:
Figure 4:. Early and late gilteritinib resistant cells exhibit unique metabolic dependencies.
A. Plot summarizes major pathways important in early gilteritinib resistance as identified by CRISPR resensitization screens in Figure 3B. B. Heat map of hierarchical clustering analysis of significantly changed metabolites (ANOVA; p < 0.05) in early and late gilteritinib resistant cultures relative to MOLM14 parental cells. C. Partial least squares-discriminant analysis of normalized data from 4B reveals the progression of acquired gilteritinib resistance. D-E. Comparison of selected metabolite abundance (au) in early and late gilteritinib resistant MOLM14 cultures relative to parental cells. Statistical significance was assessed by one-way ANOVA followed by SIDAK correction. *p < 0.05, **p < 0.01, ***p < 0.001, ****p < 0.0001 F. Overview of carnitine shuttle. CPT1, Carnitine palmitoyltransferase I; CACT, Carnitine-acylcarnitine translocase; CPT2, Carnitine palmitoyltransferase 2 G-I. Oxygen consumption rate (OCR) for MOLM14 parental cells (G), FL early (H), and FL late (I) following inhibition of CPT1 activity with etomoxir (ETO, arrow). Each data point has at least three technical replicates; mean ± SE are shown. Vertical dotted lines show inhibitor injection times used in the Seahorse assay.
Figure 5:
Figure 5:. Early and late gilteritinib resistant cultures have distinct proteomic profiles, and early resistance has significantly reduced cell cycle protein activity.
A. Overview of integrated proteomics and phosphoproteomics workflow. B. Visualization of proteomic (left) and phosphoproteomic (right) profiling by PCA shows clear separation among parental, early, and late resistant MOLM14 cultures. C. KSEA infers changes in kinase activity (p < 0.05) throughout the development of gilteritinib resistance from parental to early resistance (left plot) and then early to late resistance (right plot). Higher Z scores correspond to increased activity of a given kinase and vice versa (MOLM14 FGF2 and FL resistant cultures analyzed together). D-E. Pathway and causality analysis using CausalPath (FDR < 0.1), visualized by ChiBE. Protein-protein network diagram in D shows proteins dynamically regulated in early resistant cells relative to MOLM14 parental and E shows protein activity altered in late resistant cells relative to early cells (FGF2 and FL resistant cultures analyzed together).
Figure 6:
Figure 6:. Early resistant cultures have a slower cell cycle and inhibition of AURKB resensitizes early resistant MOLM14 cells to gilteritinib.
A. Representative cell cycle analysis profile of MOLM14 parental, treated with 100 nM gilteritinib for 24 and 48 hours, early, and late resistant cultures maintained with 100 nM gilteritinib. Analyses were performed in triplicate using PI staining and flow cytometry. B. Representative contour plots are shown. Cell cycle (PI) plotted against proliferation (Ki-67) to determine G0 vs G1. C. Quantification of cell cycle profile shown in A and B. Percent of cells per phase ± SD. D-E. FGF2 (D) and FL (E) early gilteritinib resistant MOLM14 cell lines were treated with the AURKB inhibitor, AZD2811, and gilteritinib as single agents or in combination. Viability was measured after 72 hours and normalized to untreated cells. Experiments were performed in triplicate. Mean ± SE are plotted. F-G. CRISPR-Cas knockout of AURKB in FGF2 (H) and FL (I) early resistant MOLM14 cells restored gilteritinib sensitivity. Viability was measured in triplicate as stated above. Mean ± SE are plotted.
Figure 7:
Figure 7:. Targeted proteomics of primary early resistant AML samples shows reduced cell cycle proteins, increase in lipid metabolism proteins, and alterations in MAPK signaling proteins. Ex vivo treatment confirms AURKB vulnerability in early resistance.
A. Pre-treatment (PT) and early resistant (ER) AML patient samples (N = 11) were enriched for leukemia cells by CD33+/CD34+ selection and underwent targeted proteomic analysis. PCA of normalized peak intensity ratios shows clear segregation between PT and ER samples. B. Heatmap of unsupervised hierarchical clustering analysis of differentially-expressed proteins between PT and ER samples (N = 52, q < 0.05). C. Network cluster analyses of differentially-expressed proteins shows significantly altered clusters of proteins involved in cell cycle, fatty acid metabolism, and MAPK signaling. Glay (undirected)(Su et al., 2010) was used to perform clustering analysis using STRING interactions(Szklarczyk et al., 2018) within the cytoscape interface(Shannon et al., 2003). D. AML stroma from paired pre-treatment and on-gilteritinib treatment patient samples (N = 7) was cultured in vitro and characterized via RNA-sequencing. FGF2 expression is increased in on-gilteritinib treatment samples. E. AML cells from paired PT and ER patient samples (N = 4) were enriched with CD33+/CD34+ selection and treated with AURKB inhibitor, AZD2811 and gilteritinib as single agents or in combination. Viability was measured after 72 hours and normalized to untreated cells. Mean of triplicates ± SD are shown. F. Beat AML data(Tyner et al., 2018) of primary AML patient samples (N = 397) shows positive correlation of AZD2811 sensitivity with FLT3-ITD mutations and negative correlation with NRAS mutations.

Comment in

References

    1. BABUR O, DOGRUSOZ U, CAKIR M, AKSOY BA, SCHULTZ N, SANDER C & DEMIR E 2014. Integrating biological pathways and genomic profiles with ChiBE 2. BMC Genomics, 15, 642. - PMC - PubMed
    1. BABUR O, DOGRUSOZ U, DEMIR E & SANDER C 2010. ChiBE: interactive visualization and manipulation of BioPAX pathway models. Bioinformatics, 26, 429–31. - PMC - PubMed
    1. BABUR Ö, LUNA A, KORKUT A, DURUPINAR F, SIPER MC, DOGRUSOZ U, ASLAN JE, SANDER C & DEMIR E 2018. Causal interactions from proteomic profiles: molecular data meets pathway knowledge. bioRxiv, 258855. - PMC - PubMed
    1. BANELLI B, CARRA E, BARBIERI F, WURTH R, PARODI F, PATTAROZZI A, CAROSIO R, FORLANI A, ALLEMANNI G, MARUBBI D, FLORIO T, DAGA A & ROMANI M 2015. The histone demethylase KDM5A is a key factor for the resistance to temozolomide in glioblastoma. Cell Cycle, 14, 3418–29. - PMC - PubMed
    1. BATTULA VL, LE PM, SUN JC, NGUYEN K, YUAN B, ZHOU X, SONNYLAL S, MCQUEEN T, RUVOLO V, MICHEL KA, LING X, JACAMO R, SHPALL E, WANG Z, RAO A, AL-ATRASH G, KONOPLEVA M, DAVIS RE, HARRINGTON MA, CAHILL CW, BUESO-RAMOS C & ANDREEFF M 2017. AML-induced osteogenic differentiation in mesenchymal stromal cells supports leukemia growth. JCI Insight, 2. - PMC - PubMed

Publication types

MeSH terms