. 2021 Jul 26;56(14):2029-2042.e5.
doi: 10.1016/j.devcel.2021.06.003. Epub 2021 Jun 24.

Mitochondrial-derived vesicles compensate for loss of LC3-mediated mitophagy

Affiliations

Mitochondrial-derived vesicles compensate for loss of LC3-mediated mitophagy

Christina G Towers et al. Dev Cell. .

Abstract

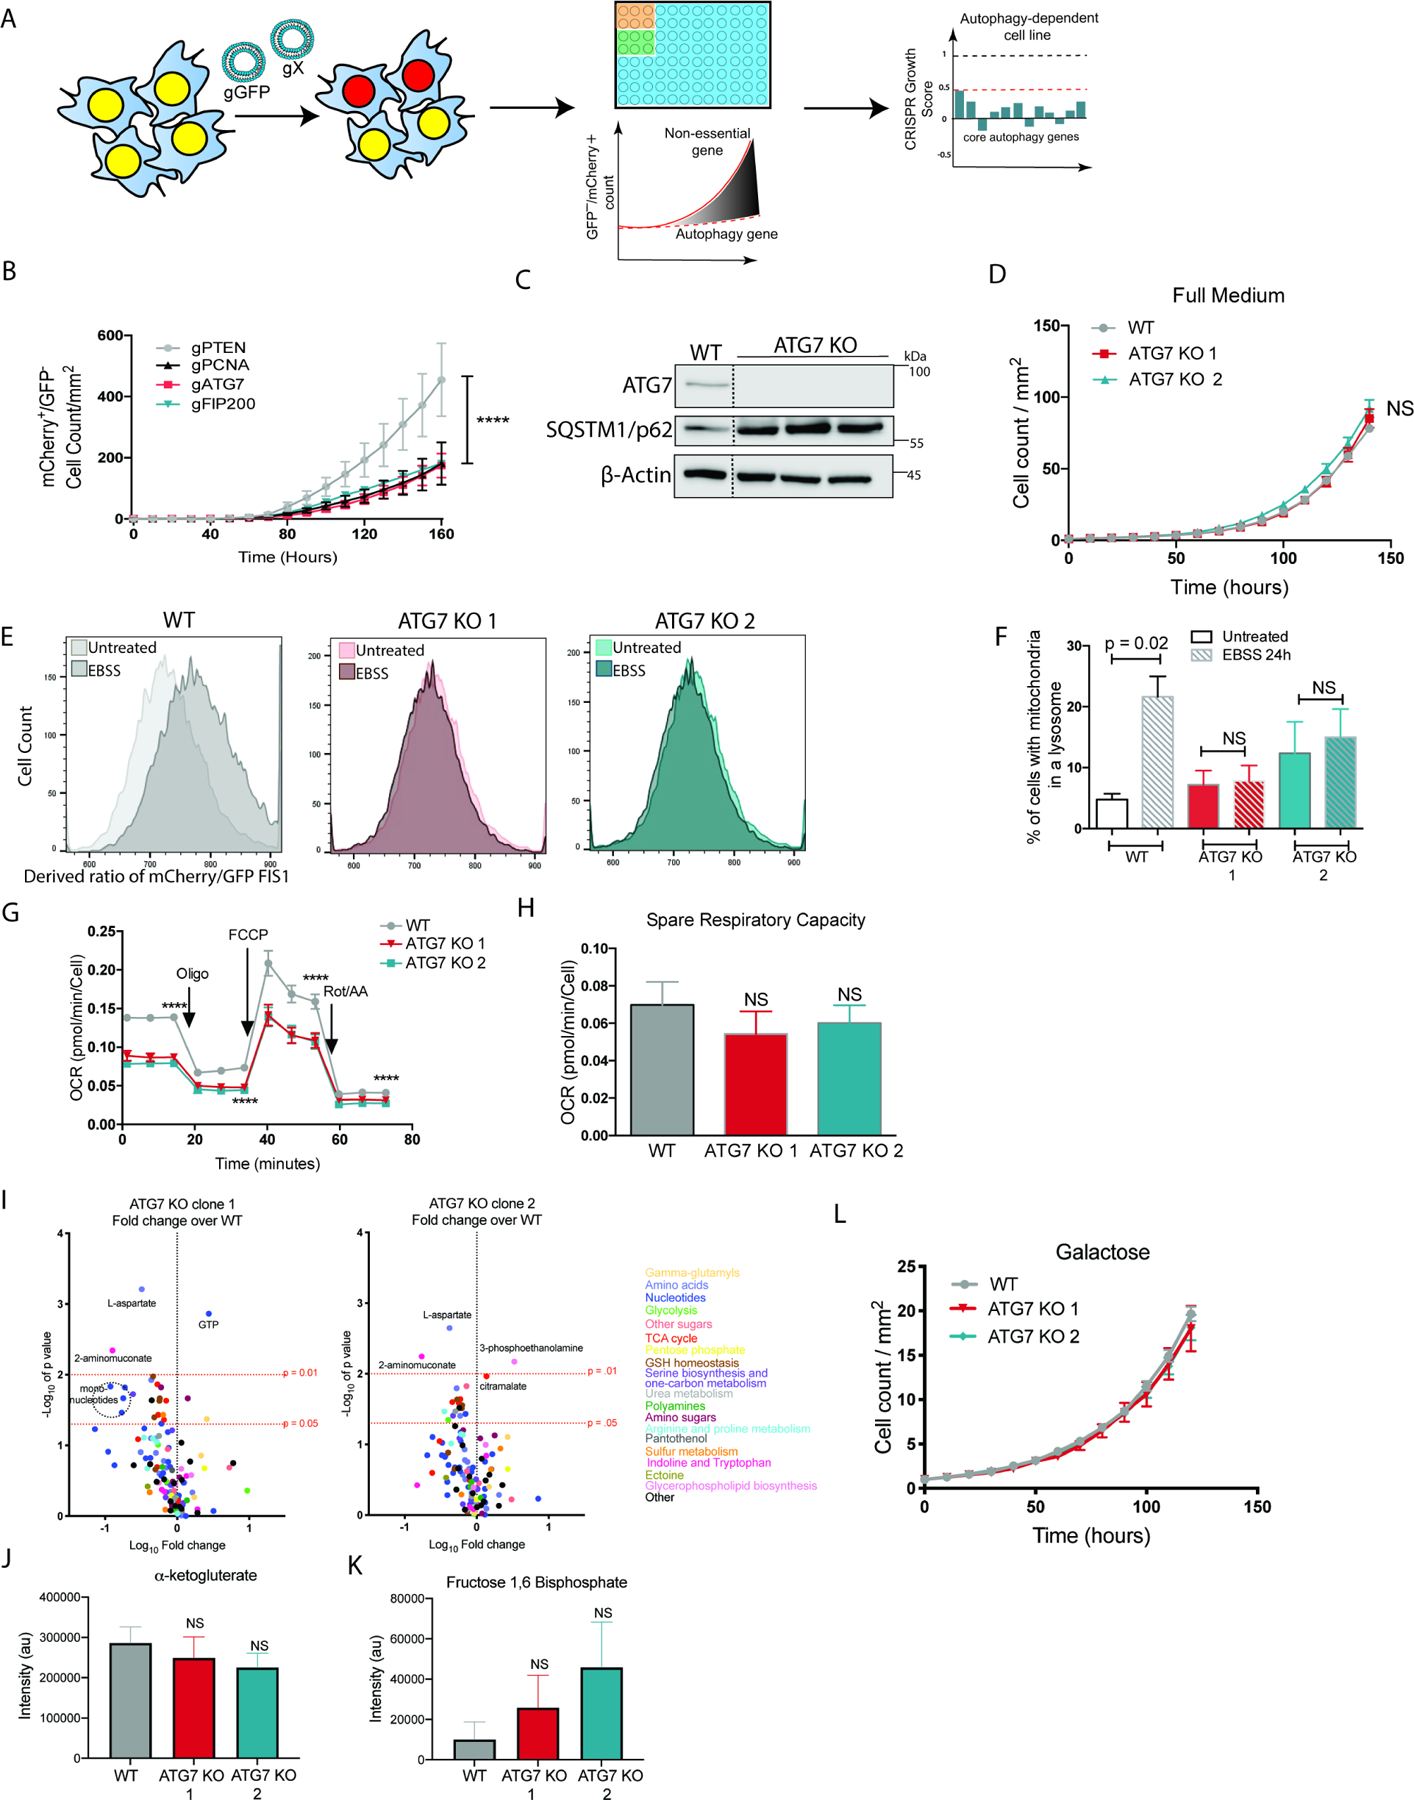
Mitochondria are critical metabolic and signaling hubs, and dysregulated mitochondrial homeostasis is implicated in many diseases. Degradation of damaged mitochondria by selective GABARAP/LC3-dependent macro-autophagy (mitophagy) is critical for maintaining mitochondrial homeostasis. To identify alternate forms of mitochondrial quality control that functionally compensate if mitophagy is inactive, we selected for autophagy-dependent cancer cells that survived loss of LC3-dependent autophagosome formation caused by inactivation of ATG7 or RB1CC1/FIP200. We discovered rare surviving autophagy-deficient clones that adapted to maintain mitochondrial homeostasis after gene inactivation and identified two enhanced mechanisms affecting mitochondria including mitochondrial dynamics and mitochondrial-derived vesicles (MDVs). To further understand these mechanisms, we quantified MDVs via flow cytometry and confirmed an SNX9-mediated mechanism necessary for flux of MDVs to lysosomes. We show that the autophagy-dependent cells acquire unique dependencies on these processes, indicating that these alternate forms of mitochondrial homeostasis compensate for loss of autophagy to maintain mitochondrial health.

Keywords: ATG7; FIP200; SNX9; autophagy; cancer; late endosomes; mitochondria; mitochondrial dynamics; mitochondrial-derived vesicles; mitophagy.


Conflict of interest statement

Declaration of interests The authors declare no competing interests.

Figures

Figure 1:
Figure 1:. Rare clones derived from autophagy-dependent cell lines adapt to maintain mostly functional mitochondria.
(A) Schematic describing the live-cell CRISPR assay using ribonucleic particles co-targeting a gene of interest and GFP arrayed in a 96 well plate and monitored by Incucyte live cell imaging. BT549 cells showing (B) Incucyte live cell imaging of the mCherry+/GFP- cell count/mm2 immediately after delivery of gRNAs targeting the indicated genes along with gRNAs targeting GFP in cells with stable expression of GFP-NLS and mCherry-NLS. Data are represented as mean ± SEM for technical replicates (N of 2–3). The graphs are representative of 3 experiments. Statistical analysis: two-way ANOVA and the significance at the last time point is shown. (C) Western blot analysis of rare clones that survived loss of ATG7. Blots are representative of 3 experiments. Unnecessary lanes were removed from the blot indicated by a dotted line. (D) Incucyte live cell imaging of mCherry+ cell count/mm2 normalized to time point 0. Data are represented as mean ± SEM for technical replicates (N of 3). The graphs are representative of 3 experiments. Statistical analysis: two-way ANOVA and the significance at the last time point is shown. (E-F) In cells with stable expression of mCh-GFP-Fis1 (E) representative histograms of ratiometric flow cytometry analysis before and after 24hours of starvation in EBSS medium. Graphs are representative of 3 experiments. (F) Quantitative analysis of ratiometric flow cytometry (mCherry/GFP). Graphs are represented as mean ± SEM for biological replicates (N of 4–5). Statistical analysis: one-way ANOVA. (G) Oxygen consumption rates and (H) spare respiratory capacity measured via a Seahorse mitochondrial stress test. Data are represented as the mean ± SD for technical replicates (N = 6) and are representative of 3 individual experiments. (I-K) Quantification of relative intensity of metabolite peaks determined by mass spectrometry and (I) displayed as a waterfall plot of the Log10 fold change of each clone compared to WT cells graphed relative to the p-value. Levels of significance are indicated with dotted red lines and metabolites are color coded according to pathway. The data is represented as the mean of 3 individual experiments. (J-K) Relative intensity (au) of the peaks corresponding to the indicated metabolites. The data is represented as the mean ± SEM of 3 individual experiments. Statistical analysis was performed with a one-way ANOVA. (L) Incucyte live cell imaging of mCherry+ cell count/mm2 normalized to time point 0 of cells grown in media where the glucose was substituted with 100mM galactose. Data are represented as mean ± SEM for technical replicates (N of 5). The graphs are representative of 3 experiments. Statistical analysis: two-way ANOVA and the significance at the last time point is shown. *p≤0.05, **p≤0.01, *** p≤0.01, **** p≤0.001. See also Figure S1, Figure S5, Tables S1 and Table S2.
Figure 2:
Figure 2:. Autophagy deficient clones have an acquired dependency on mitochondrial fusion for survival
BT549 WT and ATG7 KO clones. (A) Representative electron microscopy images. Black arrows indicate mitochondria. (B) SIM images of mitotracker-red labeled mitochondria where yellow and red arrow heads indicate fragmented and hyperfused mitochondria, respectively. (C) Western blot for indicated proteins, representative blot shown (representative of 3 experiments). (D) Representative confocal images from movies of cells transfected with PA-GFP and co-labeled with mitotracker-red, images shown before and after 405nM light. (E) Quantification of loss of GFP signal 30 minutes after activation relative to the TP0. Data combined from 3 individual experiments, each point is a single cell. Statistical analysis: one-way ANOVA. (F) Representative confocal images of mitotracker-red labeled mitochondria. Yellow arrow heads: fractured mitochondria, red arrow heads: elongated/hyperfused mitochondria. Scale bars represent 10µm. (G) Top: Cartoon of how cells were categorized. Bottom: Quantification of categorized cells. Images from 4 individual experiments were combined and the data are represented as the mean± SEM and one-way ANOVA was performed to determine statistical significance. (H) Representative confocal imaging of immunofluorescent staining of 3X-MYC-MFN1(K88T) in mitotracker-red labeled cells with zoomed insets of merged images shown at the bottom. Scale bars represent 10µm. (I-J) Incucyte live cell imaging of mCherry+ cells transiently transfected with 3X-MYC-MFN1(K88T) and (I) the mCherry+ cell count/mm2 is shown normalized to TP0. Data are represented as mean ± SEM for technical replicates (N of 3). The graphs are representative of 2–3 experiments. Statistical analysis: two-way ANOVA and the significance at the last time point is shown. (J) CellEvent Caspase3/7 green count normalized to mCherry cell count after 4 days of imaging. The data is shown as the fold change of 3X-MYCMFN1(K88T) transfected cells compared to cells transfected with an EV and a one-way ANOVA was performed to assess statistical analysis. (K) Representative confocal live cell imaging of mitotracker-red labeled mitochondria 24hr after treatment with CCCP (20µM). (L-M) Incucyte live cell imaging of mCherry+ cells treated with CCCP (50µM) and CellEvent caspase 3/7 green. The data is shown as (L) mCherry+ cell count normalized to TP0 and (M) the Caspase3/7 green count normalized to the red count over time and represented as the mean ± SD for technical replicates (N of 3). The graphs are representative of 3 experiments. Statistical analysis: two-way ANOVA and the significance at the last time point is shown. *p≤0.05, **p≤0.01, *** p≤0.01, **** p≤0.001. See also Figure S2 and Figure S5.
Figure 3:
Figure 3:. ATG7 KO cells have increase mitochondrial derived vesicles.
BT549 WT and ATG7 KO clones. (A) Representative confocal images from IF labeled cells with antibodies against TOM20 and PDH. Scale bar represents 10µm. Blue and white arrow heads point to examples of TOM20+/PDH- and TOM20-/PDH+, respectively. (A-i) Zoomed inset from merged image with ROI labeled and scale bar represents 2µM. (A-ii) Quantification of intensity along the ROI indicated in a-i inset. (B) Quantification of the number of MDVs identified per cell across multiple images combining two individual experiments. The data is represented as the mean ± SEM and each dot represents a cell. The total MDV count was determined by adding the TOM20+/PDH- count and the TOM20-/PDH+ count and a one-way ANOVA was performed to determine statistical analysis. (C) Representative confocal images from IF labeled cells with antibodies against TOM20 and PDH 24hr after treatment with DFP (1mM). Scale bar represents 5µm. Blue and white arrow heads point to examples of TOM20+/PDH- and TOM20-/PDH+, respectively. (D) Quantification of the number of MDVs identified per cell across multiple images and the data is representative of 2–3 experiments. The data is shown as the mean ± SEM and each dot represents a cell. The total MDV count was determined by adding the TOM20+/PDH- count and the TOM20-/PDH+ count and a one-way ANOVA was performed to determine statistical analysis. *p≤0.05, **p≤0.01, *** p≤0.01, **** p≤0.001. See also Figure S2 and Figure S6.
Figure 4:
Figure 4:. Mitochondrial derived vesicle trafficking to lysosomes can be monitored by mCh-GFP-Fis1.
(A) Schematic representation of mCh-GFP-Fis1 localization to TOM20+/PDH- MDVs and Cox8Keima localization to TOM20-/PDH+ MDVs. BT549 WT and ATG7 KO clones with stable expression of mCh-GFP-Fis1. (B-C) Representative confocal images from IF labeled cells with antibodies against TOM20 and PDH either (B) untreated or (C) treated for 24hr with DFP (1mM). Scale bar represents 5µm. The mCherry is pseudo-colored blue and the GFP is pseudo-colored white. Blue and white arrow heads point to examples of TOM20+/PDH- and TOM20/PDH+, respectively. The merged image shows the ROI quantified for intensity in the graphs to the right where the bottom of the ROI line corresponds to the graph origin. (D-E) Quantitative analysis of ratiometric flow cytometry (mCherry/GFP) 24hr after indicated treatments. (D) Representative histograms with gate set to 5% in untreated WT cells and (E) shows multiple biological experiments combined for statistical analysis. Graphs are represented as mean ± SEM for biological replicates (N of 2–6). Statistical analysis: one-way ANOVA. *p≤0.05, **p≤0.01, *** p≤0.01, **** p≤0.001. See also Figure S3 and Figure S6.
Figure 5:
Figure 5:. WT and ATG7 KO cells utilize SNX9 to traffic MDVs to lysosomes.
(A-D) BT549 WT and ATG7 KO cells 4 days after transduction with shRNAs targeting SNX9 or shNS. (A) Representative confocal images from IF labeled cells with antibodies against TOM20 and PDH 24hr after treatment with DFP (1mM). Scale bar represents 5µm. (B) Western blot to show knock down of SNX9. (C) Quantification of the number of MDVs identified per cell across multiple images combining two individual experiments. The data is represented as the mean ± SEM and each dot represents a cell. The total MDV count was determined by adding the TOM20+/PDH- count and the TOM20-/PDH+ count and a one-way ANOVA was performed to determine statistical analysis. (D) In cells with stable expression of mCh-GFP-Fis1, quantitative analysis of ratiometric flow cytometry (mCherry/GFP) 24 hr after indicated treatments. Graphs are represented as mean ± SEM for biological replicates (N of 2–4). (E) In BT549 WT and ATG7 KO cells with stable expression of mCh-GFP-SNX9, quantitative analysis of ratiometric flow cytometry (mCherry/GFP) 24hr after treatment with CCCP (50μM) or DFP (1mM). The histograms shown are representative of multiple experiments (N of 3). See also Figure S4.
Figure 6:
Figure 6:. ATG7 KO cells have an acquired dependency on SNX9-mediated MDVs for survival.
BT549 WT and ATG7 KO cells 4 days after transduction with shRNAs targeting SNX9 or shNS. (A-B) Incucyte live cell imaging of cells with stable mCherry-NLS where mCherry+ counts are graphed over time in cells with shSNX9 and representative images 4 days after plating are shown in B. The data in A is shown as mCherry+ count/mm2 and represented as the mean ± SEM for technical replicates (N of 3). The graphs are representative of 3 experiments. Statistical analysis: two-way ANOVA and the significance at the last time point is shown. Scale bar is 200μM. (C) Incucyte live cell imaging of mCherry+ cells and CellEvent caspase 3/7 green. The data is shown as the Caspase3/7 green count normalized to the mCherry+ red count over time and represented as the mean ± SD for technical replicates (N of 3). The graphs are representative of 3 experiments. Statistical analysis: two-way ANOVA and the significance at the last time point is shown. (D) Oxygen consumption rates and (E) spare respiratory capacity measured via a Seahorse mitochondrial stress test. Data are represented as the mean ± SD for technical replicates (N = 3) and are representative of 3 individual experiments (F-H) Incucyte live cell imaging of mCherry+ cells and CellEvent caspase 3/7 green treated with CCCP (20µM) where F shows the mCherry+ counts for viability curves and G shows the Caspase3/7 green count normalized to the mCherry+ red count over time and both F and G are represented as the mean ± SD for technical replicates (N of 3). The graphs are representative of 3 experiments. Statistical analysis: two-way ANOVA and the significance at the last time point is shown. (H) Representative images of mCherry-NLS and Caspase3/7 green 24hrs after treatment with CCCP. Scale bar is 200μM. *p≤0.05, **p≤0.01, *** p≤0.01, **** p≤0.001. See also Figure S6.

Comment in

References

    1. ALLEN GF, TOTH R, JAMES J & GANLEY IG 2013. Loss of iron triggers PINK1/Parkin-independent mitophagy. EMBO Rep, 14, 1127–35. - PMC - PubMed
    1. BHATTI JS, BHATTI GK & REDDY PH 2017. Mitochondrial dysfunction and oxidative stress in metabolic disorders - A step towards mitochondria based therapeutic strategies. Biochim Biophys Acta Mol Basis Dis, 1863, 1066–1077. - PMC - PubMed
    1. CHEN H, CHOMYN A & CHAN DC 2005. Disruption of fusion results in mitochondrial heterogeneity and dysfunction. J Biol Chem, 280, 26185–92. - PubMed
    1. CHEN H, DETMER SA, EWALD AJ, GRIFFIN EE, FRASER SE & CHAN DC 2003. Mitofusins Mfn1 and Mfn2 coordinately regulate mitochondrial fusion and are essential for embryonic development. J Cell Biol, 160, 189–200. - PMC - PubMed
    1. CHEN H, VERMULST M, WANG YE, CHOMYN A, PROLLA TA, MCCAFFERY JM & CHAN DC 2010. Mitochondrial fusion is required for mtDNA stability in skeletal muscle and tolerance of mtDNA mutations. Cell, 141, 280–9. - PMC - PubMed

Publication types

MeSH terms