. 2021 Aug 4;109(15):2485-2498.e5.
doi: 10.1016/j.neuron.2021.06.003. Epub 2021 Jun 24.

Controlling one's world: Identification of sub-regions of primate PFC underlying goal-directed behavior

Affiliations

Controlling one's world: Identification of sub-regions of primate PFC underlying goal-directed behavior

Lisa Y Duan et al. Neuron. .

Abstract

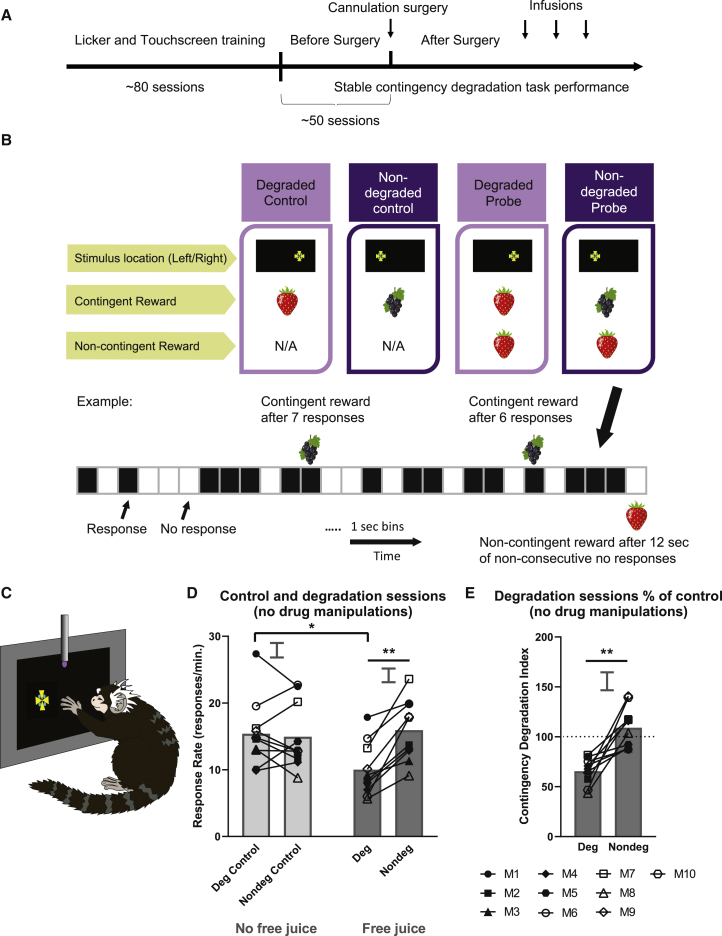
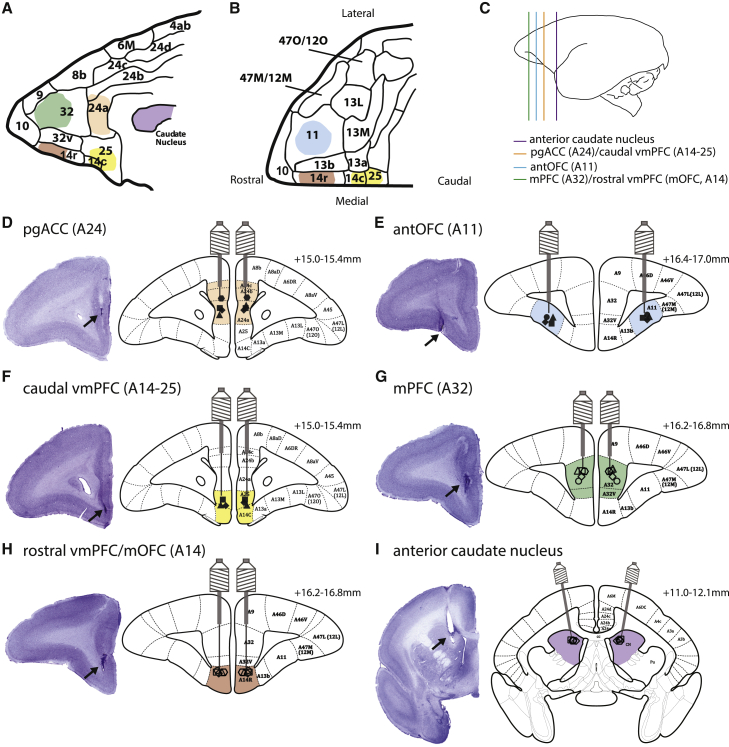
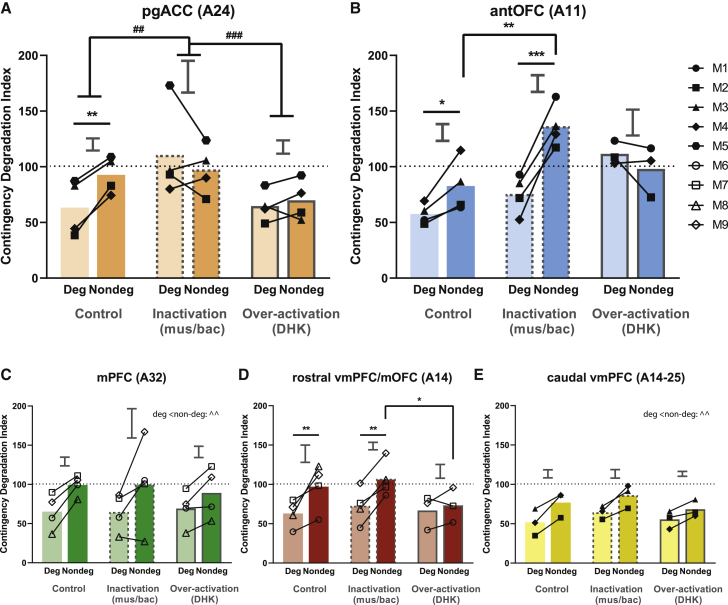
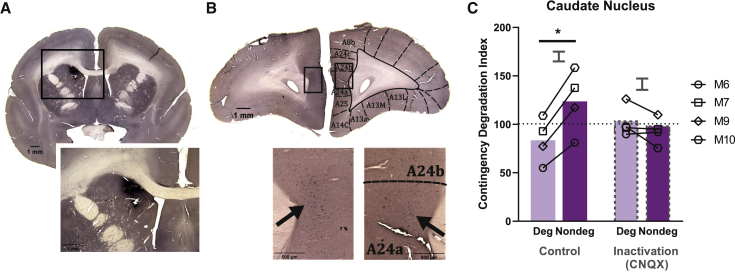
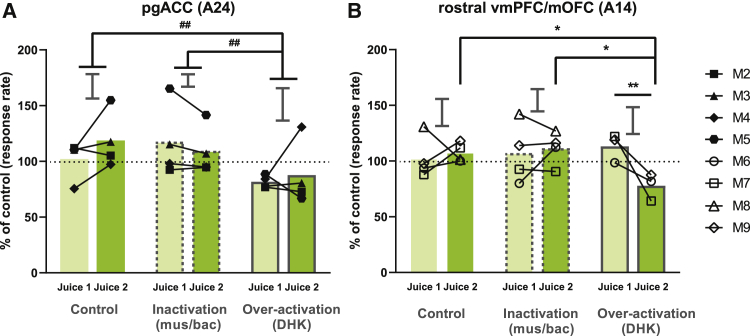
Impaired detection of causal relationships between actions and their outcomes can lead to maladaptive behavior. However, causal roles of specific prefrontal cortex (PFC) sub-regions and the caudate nucleus in mediating such relationships in primates are unclear. We inactivated and overactivated five PFC sub-regions, reversibly and pharmacologically: areas 24 (perigenual anterior cingulate cortex), 32 (medial PFC), 11 (anterior orbitofrontal cortex, OFC), 14 (rostral ventromedial PFC/medial OFC), and 14-25 (caudal ventromedial PFC) and the anteromedial caudate to examine their role in expressing learned action-outcome contingencies using a contingency degradation paradigm in marmoset monkeys. Area 24 or caudate inactivation impaired the response to contingency change, while area 11 inactivation enhanced it, and inactivation of areas 14, 32, or 14-25 had no effect. Overactivation of areas 11 and 24 impaired this response. These findings demonstrate the distinct roles of PFC sub-regions in goal-directed behavior and illuminate the candidate neurobehavioral substrates of psychiatric disorders, including obsessive-compulsive disorder.

Keywords: anterior cingulate cortex; caudate nucleus; common marmoset; contingency degradation; goal-directed behavior; habits; obsessive-compulsive disorder; orbitofrontal cortex; ventromedial prefrontal cortex.


Conflict of interest statement

Declaration of interests The authors declare no competing interests.

Figures

Figure 1
Figure 1
Experimental outline and a novel procedure to establish the sensitivity of marmosets to contingency degradation (A) Timeline of the experiment. Marmosets were pre-trained to engage with the testing apparatus and the reward being delivered from the licking spout before being given touchscreen training (see STAR Methods for more detail). Drug manipulations were conducted after sensitivity to contingency degradation had been established. (B) The novel contingency degradation task was divided into 4-day blocks. The first 2 days were control sessions and the subsequent 2 days were the contingency degradation probe sessions. In this figure, the example of degraded reward was strawberry juice and the non-degraded reward was blackcurrant juice. In the degraded probe session, the response-contingent reward (strawberry juice; example reward delivery probability = 0.1) was the same as the response non-contingent, “free” reward (strawberry juice; example probability = 0.067). In the non-degraded probe session, the response contingent reward (blackcurrant juice; example probability = 0.1) was not the same as the response non-contingent, free reward (strawberry juice; example probability = 0.067). Reward delivery probability was determined by dividing the 12-min session into 1-s bins. Black boxes indicate a response and white boxes a non-response within that 1-s bin. See STAR Methods for more details. (C) The marmoset touches the Maltese cross stimulus on the left and the associated juice reward can be retrieved from the licking spout situated in front of the touchscreen, according to a pre-programmed delivery schedule and session type. (D) The presence of free reward only affected marmoset responding when it was the same as the contingent reward (i.e., when the action-outcome [A-O] contingency was degraded) (free juice presence × degradation: F1,4 = 12.744, p = 0.0234). No difference in response rate was observed between the degraded control and non-degraded control (absence of free juice; p = 0.971). There was no significant difference when comparing non-degraded sessions with degraded controls (p = 0.954) and non-degraded controls (p = 0.677). (E) Marmosets were sensitive to changes in A-O contingencies. Marmosets were goal directed in that they showed a decrease in responding to the degraded session compared with the non-degraded session (p = 0.0009). Relevant graphs show the standard error of the differences between means (2 × SED) for degraded versus non-degraded comparisons, appropriate for post hoc pairwise comparisons. Deg, degraded. Nondeg, non-degraded. M, monkey. ∗∗p < 0.01, ∗∗∗p < 0.001.
Figure 2
Figure 2
Schematic diagrams of cannulae placements in the PFC sub-regions and the caudate nucleus (A) Sagittal view of the medial surface of the PFC. Each color corresponds to a targeted brain region. (B) Ventral view of the OFC. (C) Target locations of pgACC (area 24), caudal vmPFC (area 14-25), antOFC (area 11), mPFC (area 32), rostral vmPFC/mOFC (area 14), and anterior caudate in relation to the whole brain. (D–F) Cannulae placements in areas 24 (D), 11 (E), and 14-25 (F). Area 14-25 was reached by vertically extending the area 24 injector, thus targeting both areas 24 and 14-25 via the same guide cannula. (G–I) Cannulae placements in areas 32 (G), 14 (H), and anterior caudate (I). Area 14 was reached by vertically extending the area 32 injector, thus targeting both areas 32 and 14 via the same cannula guide. Parcellation maps have been labeled based on Paxinos et al. (2012). See Table S4 for cannulation coordinates.
Figure 3
Figure 3
Effects of inactivation or overactivation of specific PFC sub-regions during contingency degradation (A) In area 24, inactivation and over-activation blunted the sensitivity of marmosets to contingency degradation (treatment × degradation: F2,15 = 4.429, p = 0.0308). There was a significant difference between degraded and non-degraded sessions only following saline infusion (p = 0.0065) but not after inactivation (p = 0.331) or overactivation (p = 0.601). This lack of difference after inactivation occurred due to a selective increase in responding in degraded sessions (p = 0.001) but not in non-degraded sessions (p = 0.912) when compared to saline. Responding across degraded and non-degraded sessions following overactivation was less than that of inactivation (p = 0.0005; see Figure 5A). (B) Area 11 (antOFC) inactivation apparently enhanced the sensitivity of marmosets to contingency degradation, while overactivation impaired it (treatment × degradation: F2,13.287 = 7.213, p = 0.00757). Marmoset responding in degraded sessions was significantly reduced, compared to non-degraded sessions, under both saline (p = 0.0407) and inactivation infusions (p = 0.0004), but no significant difference was observed after overactivation (p = 0.363). Further analysis revealed a significant increase in the difference in responding between degraded and non-degraded conditions after inactivation when compared to saline infusion (p = 0.0158). This effect was driven by a significant increase in responding in the non-degraded condition after inactivation when compared to saline (p = 0.0032) but not in the degraded condition (p = 0.248). (C) In area 32 (mPFC), marmoset responding in non-degraded sessions was significantly greater than that of degraded sessions across all treatment conditions (p = 0.0016). There were significant effects of degradation when saline data were considered alone (F1,3 = 21.176, p = 0.0193). (D) A significant difference between degraded and non-degraded sessions was observed following saline infusion (p = 0.0011) and inactivation (p = 0.0012) of area 14 (rostral vmPFC/mOFC). There were also significant effects of degradation when saline data were considered alone (F1,3 = 12.137, p = 0.04). Although no significant differences occurred between degraded and non-degraded sessions after overactivation (p = 0.445), this effect was most likely a non-specific drug effect (see Figure 5B). Responding during the non-degraded session after overactivation was significantly lower than that after inactivation (p = 0.0107) and trended lower than after saline (p = 0.0834). Conversely, the responding of marmosets during the degraded session after overactivation was not significantly different from that of inactivation (p = 0.848) or saline (p = 0.815). A similar pattern was observed in the baseline sessions, which tested the effects of drugs on marmoset responding without the presence of free rewards (see Figure 5B). (E) In area 14-25 (caudal vmPFC), marmoset responding in non-degraded sessions was significantly greater than that of degraded sessions across all drug conditions (p = 0.0016). There were significant effects of degradation when saline data were considered alone (F1,2 = 24.409, p = 0.0386). Relevant graphs show 2 × SED for degraded versus non-degraded comparisons (area 24: n = 4; area 11: n = 4; area 32: n = 4; area 14: n = 4; area 14-25: n = 3). Deg, degraded session. Nondeg, non-degraded session. Asterisk () indicates a significant effect of the degradation × treatment interaction, # indicates a significant effect between treatments, ˆ indicates a significant effect between degradations. /#/ˆp < 0.05, ∗∗/##/ˆˆp < 0.01, ∗∗∗/###/ˆˆˆp < 0.001.
Figure 4
Figure 4
Inactivation of anterior caudate nucleus, which receives direct projection from area 24, impaired sensitivity to A-O contingencies (A) The retrograde tracer, cholera toxin B subunit, visualized in the left anterior caudate nucleus where it was injected. (B) Area 24, shown at the approximate placement used in this paper showing cell bodies of caudate projecting neurons within area 24. Ipsilateral projection from area 24 to the caudate is greater than that from the contralateral projection. (C) Inactivation of the caudate impaired sensitivity to contingency degradation. Significant treatment differences were observed on contingency degradation (treatment × degradation: F1,9 = 6.02, p = 0.0365). Inactivation (via CNQX) of the caudate nucleus that receives projection from the targeted area 24, resulted in a significant difference between degraded and non-degraded sessions following saline infusion (p = 0.0195), but not after inactivation (p = 0.543). Relevant graphs show 2 × SED for degraded versus non-degraded comparisons (n = 4). Deg, degraded session. Nondeg, non-degraded session. Asterisk indicates significant effect of degradation × treatment interaction. p < 0.05.
Figure 5
Figure 5
Effects of area 24 and 14 overactivation on baseline sessions (A) Overactivation of area 24 significantly affected responding compared to other manipulations (treatment: F2,10 = 14.846, p = 0.00102), where it significantly decreased responding across juice 1 and 2 when compared to inactivation (p = 0.00210) or saline (p = 0.00220). (B) Area 14 overactivation significantly affected responding in different juice conditions (juice condition × treatment: F2,12.812 = 6.358, p = 0.0121); overactivation specifically decreased responding to juice 2, which is the contingent reward in the non-degraded session in the contingency degradation task, compared to juice 1, which is the contingent reward in the degraded session in the contingency degradation task (p = 0.0038). Responding to juice 2 after overactivation was significantly lower than that following saline (p = 0.0202) or inactivation (p = 0.0232). Conversely, responding to juice 1 after overactivation was not significantly lower than that of saline (p = 0.330) or inactivation (p = 0.556). There was no significant difference in responding after overactivation between juice 2 in baseline sessions and the non-degraded session in the contingency degradation task (p = 0.651), whereas there was a significant difference between juice 1 and the degraded session in the contingency degradation task (p = 0.001). Relevant graphs show 2 × SED for juice 1 versus juice 2 comparisons (area 24, n = 4; area 14, n = 4). For baseline sessions of other brain regions, see Figure S5. Asterisk () indicates significant effect of juice condition × treatment interaction, # indicates significant effect between treatments. /#p < 0.05, ∗∗/##p < 0.01.

Comment in

Similar articles

Cited by

References

    1. Alexander L., Gaskin P.L.R., Sawiak S.J., Fryer T.D., Hong Y.T., Cockcroft G.J., Clarke H.F., Roberts A.C. Fractionating Blunted Reward Processing Characteristic of Anhedonia by Over-Activating Primate Subgenual Anterior Cingulate Cortex. Neuron. 2019;101:307–320.e6. - PMC - PubMed
    1. Amiez C., Joseph J.P., Procyk E. Reward encoding in the monkey anterior cingulate cortex. Cereb. Cortex. 2006;16:1040–1055. - PMC - PubMed
    1. Anderson C.M., Swanson R.A. Astrocyte glutamate transport: review of properties, regulation, and physiological functions. Glia. 2000;32:1–14. - PubMed
    1. Arriza J.L., Fairman W.A., Wadiche J.I., Murdoch G.H., Kavanaugh M.P., Amara S.G. Functional comparisons of three glutamate transporter subtypes cloned from human motor cortex. J. Neurosci. 1994;14:5559–5569. - PMC - PubMed
    1. Averbeck B.B., Lehman J., Jacobson M., Haber S.N. Estimates of projection overlap and zones of convergence within frontal-striatal circuits. J. Neurosci. 2014;34:9497–9505. - PMC - PubMed

Publication types

LinkOut - more resources