. 2021 Aug 4;109(15):2427-2442.e10.
doi: 10.1016/j.neuron.2021.05.025. Epub 2021 Jun 24.

HepaCAM controls astrocyte self-organization and coupling

Affiliations

HepaCAM controls astrocyte self-organization and coupling

Katherine T Baldwin et al. Neuron. .

Abstract

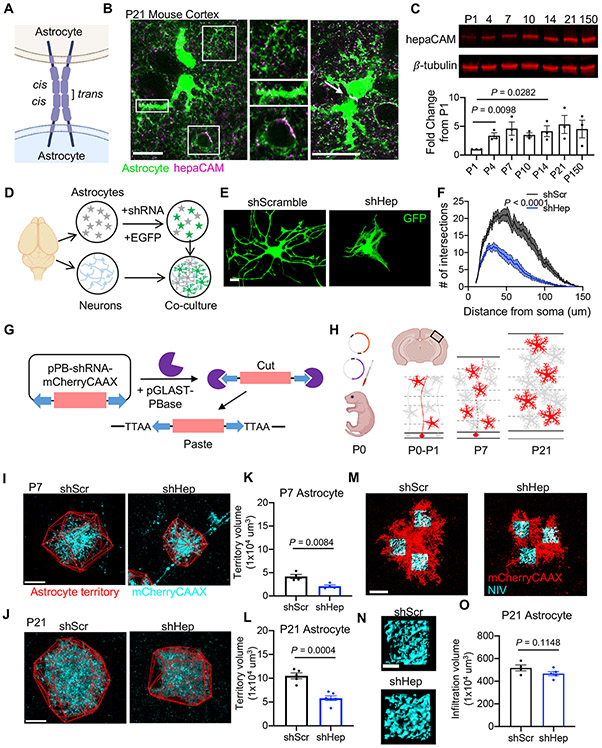
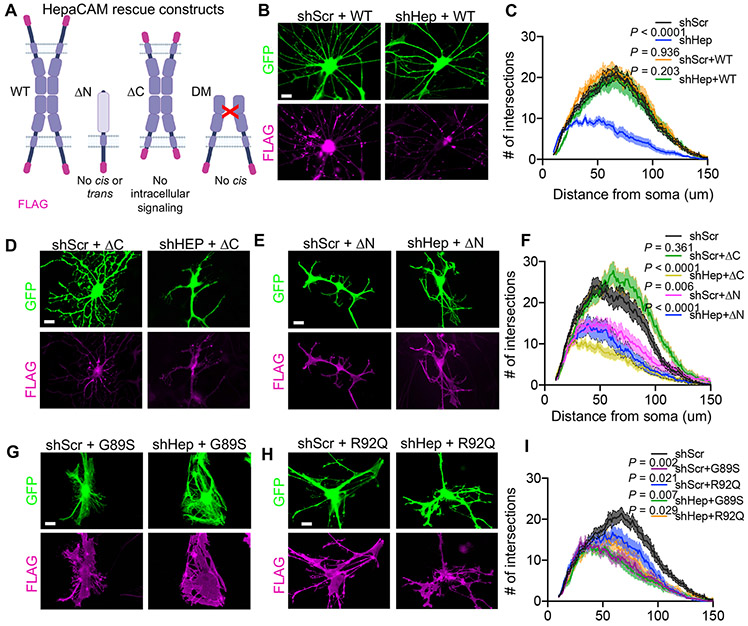
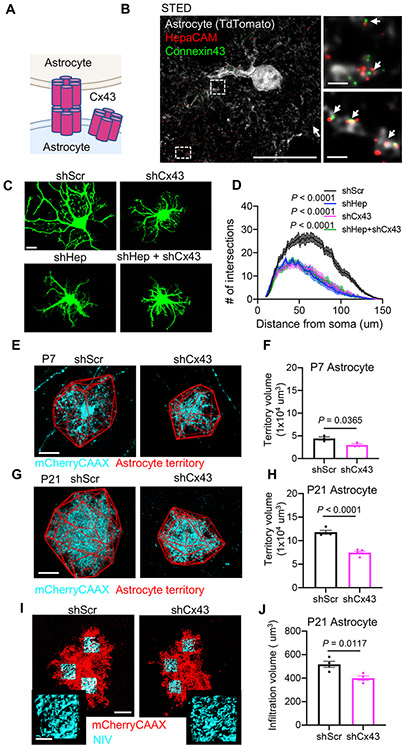
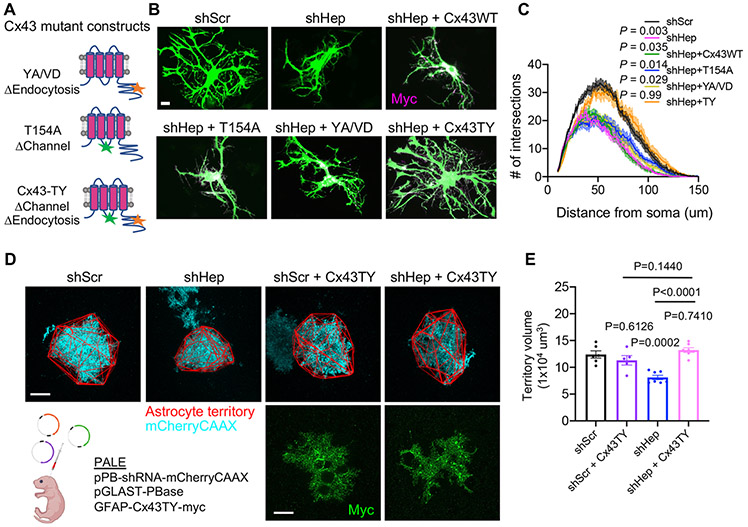
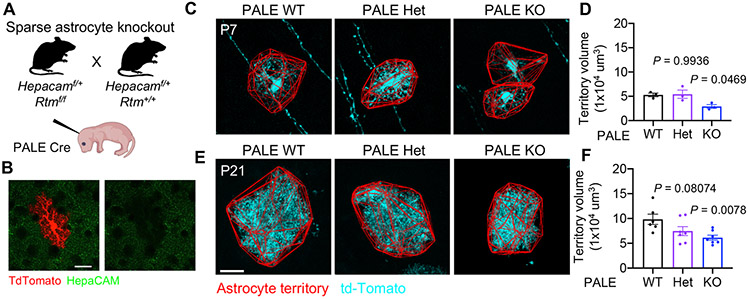
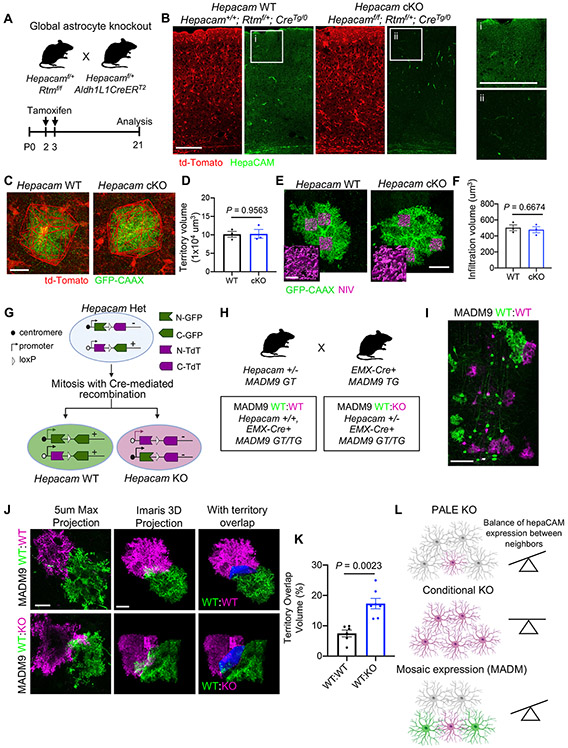
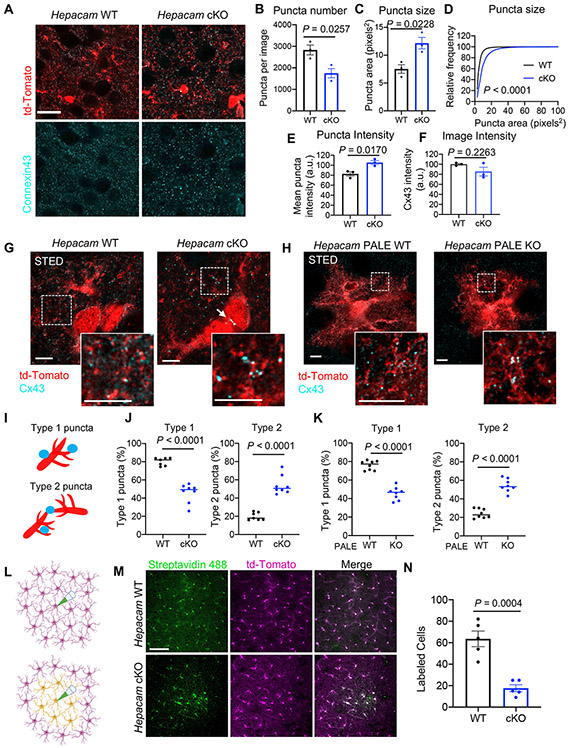
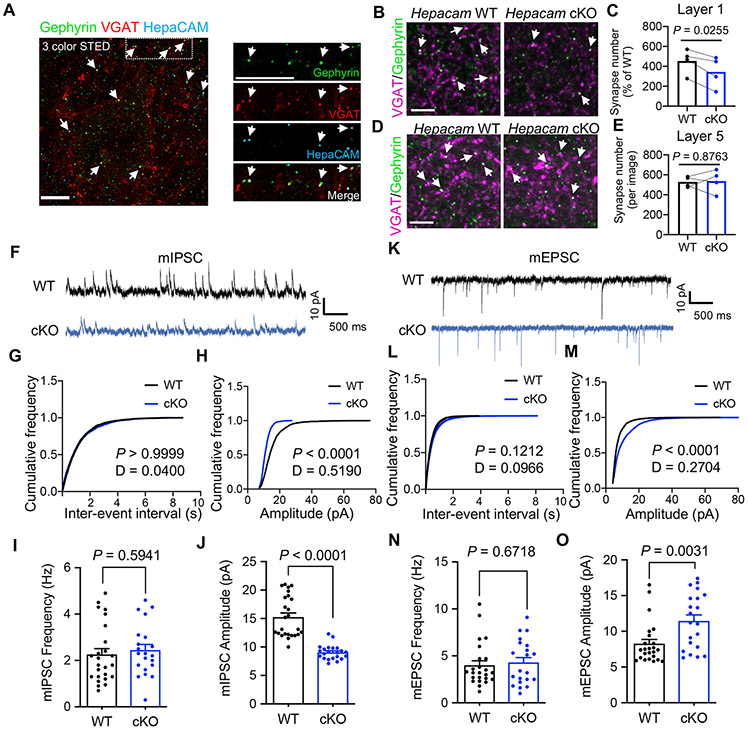
Astrocytes extensively infiltrate the neuropil to regulate critical aspects of synaptic development and function. This process is regulated by transcellular interactions between astrocytes and neurons via cell adhesion molecules. How astrocytes coordinate developmental processes among one another to parse out the synaptic neuropil and form non-overlapping territories is unknown. Here we identify a molecular mechanism regulating astrocyte-astrocyte interactions during development to coordinate astrocyte morphogenesis and gap junction coupling. We show that hepaCAM, a disease-linked, astrocyte-enriched cell adhesion molecule, regulates astrocyte competition for territory and morphological complexity in the developing mouse cortex. Furthermore, conditional deletion of Hepacam from developing astrocytes significantly impairs gap junction coupling between astrocytes and disrupts the balance between synaptic excitation and inhibition. Mutations in HEPACAM cause megalencephalic leukoencephalopathy with subcortical cysts in humans. Therefore, our findings suggest that disruption of astrocyte self-organization mechanisms could be an underlying cause of neural pathology.

Keywords: astrocyte; astrocyte development; astrocyte-synapse interaction; cell adhesion; connexin; gap junction; synapse; tiling.


Conflict of interest statement

Declaration of interests The authors declare no competing interests.

Figures

Figure 1:
Figure 1:. HepaCAM regulates astrocyte morphogenesis in vitro and in vivo.
(A) hepaCAM at cell-cell junctions in homophilic cis and trans interactions. (B) hepaCAM (magenta) in the visual cortex of Aldh1L1-eGFP mice at P21. Scale bar, 20 μm. (C) Western blot analysis of hepaCAM protein expression in mouse cortex. Quantification of hepaCAM protein expression normalized to β-tubulin as a fold change from P1. n = 3 mice/timepoint. Mean ± s.e.m. One-way ANOVA, Tukey’s post-test. (D) Schematic of astrocyte-neuron co-culture assay. (E) Rat astrocytes transfected with EGFP and scrambled shRNA (shScr), or shRNA targeting Hepacam (shHep) and co-cultured with cortical neurons. Scale bar, 20 μm. (F) Quantification of astrocyte branching complexity. Data are mean ± s.e.m. n = 4 independent experiments, 20 cells/condition/experiment. ANCOVA, Tukey’s post-test. (G) Adaptation of Piggybac transposon system. Co-expression of pPB-shRNA-mCherryCAAX and pGLAST-PBase yields genomic integration of shRNA and mCherry-CAAX in developing astrocytes. (H) Overview of Postnatal Astrocyte Labeling by Electroporation (PALE) with Piggybac plasmids. (I and J) Images of V1 L5 astrocytes at P7 (I) and P21 (J) expressing mCherry-CAAX (cyan) and shScr or shHep. Astrocyte territory in red. Scale bar, 20 μm. (K and L) Average territory volumes of P7 (K) and P21 (L) astrocytes. n = 4 mice/condition, 2-8 cells/mouse. Data points are mouse averages. Bars are mean ± s.e.m. Nested t test. (M) Images of V1 L5 astrocytes at P21 expressing mCherry-CAAX (red) and shRNA. Scale bar, 20 μm. (N) NIV reconstructions (cyan). Scale bar, 5 μm. (O) Average NIV. 3 ROIs/cell, 4-12 cells/mouse, 4 (shScr) or 5(shHep) mice. Data points, mouse averages. Bars are mean ± s.e.m. Nested t test. See also Figure S1.
Figure 2:
Figure 2:. HepaCAM regulates astrocyte morphogenesis via extracellular and intracellular domains.
(A) shRNA-resistant human hepaCAM rescue constructs with C-terminal FLAG tag (magenta). (B, D, E, G, H) Astrocytes (green) expressing shRNA and FLAG-tagged hepaCAM rescue constructs (magenta) and co-cultured with neurons. Scale bar, 20 μm. (C, F, I) Quantification of astrocyte branching complexity. n = 3 independent experiments, 20 cells/condition/experiment. Data are mean ± s.e.m. ANCOVA, Tukey’s post-test.
Figure 3:
Figure 3:. Connexin 43 knockdown phenocopies hepaCAM knockdown in vitro and in vivo.
(A) Cx43 organization in astrocytes. (B) Three-color stimulated emission depletion (STED) image of a V1 TdTomato+ astrocyte (grey) at P21. Scale bar, 20 μm (left) and 1 μm (right). (C) Astrocytes expressing shRNAs targeting hepaCAM (shHep), Cx43 (shCx43), or a scrambled control (shScr). Scale bar, 20 μm. (D) Quantification of astrocyte branching complexity. Data are mean ± s.e.m. n = 3 independent experiments, 20 cells/condition/experiment. ANCOVA, Tukey’s post-test. (E and G) V1 L5 astrocytes at P7 (E) and P21 (G) expressing mCherry-CAAX (cyan) and shScr or shCx43. Astrocyte territory in red. Scale bar, 20 μm. (F and H) Average territory volumes of P7 (F) and P21 (H) astrocytes. n = 3 mice/condition, 5-13 cells/mouse. Data points are mouse averages. Bars are mean ± s.e.m. Nested t test. (I) V1 L5 astrocytes at P21 expressing mCherry-CAAX (red) and shRNA with NIV reconstructions (cyan). Scale bars, 20 μm (inset 5 μm). (J) Average NIV of shScr and shHep astrocytes. 3 ROIs/cell, 3-12 cells/mouse, 4 mice/condition. Data points are mouse averages. Bars are mean ± s.e.m. Nested t test. See also Figures S2 and S3.
Figure 4:
Figure 4:. HepaCAM stabilizes Cx43 to regulate astrocyte morphogenesis through a channel-independent mechanism.
(A) Connexin 43 rescue constructs resistant to shRNA and mutated to disrupt channel function (T154A), endocytosis (YA/VD), or both channel function and endocytosis (TY). (B) Astrocytes (green) expressing shScr, shHep, or shHep and Myc-tagged Cx43 rescue constructs (magenta). Scale bar, 20 μm. (C) Quantification of astrocyte branching complexity. n = 3 independent experiments, 20 cells/condition/experiment. Mean ± s.e.m. ANCOVA, Tukey’s post-test. (D) Images of V1 L5 astrocytes at P21 expressing mCherry-CAAX (cyan), shScr or shHep, and Cx43-TY-myc (green). Astrocyte territory in red. Scale bar, 20 μm. (E) Territory volumes of shScr and shHep astrocytes without or with Cx43-TY expression. n= 5-7 mice/condition, between 1-6 cells per mouse. Data points are mouse averages. Bars are mean ± s.e.m. Nested one-way ANOVA, Tukey’s post-test. See also Figure S3.
Figure 5:
Figure 5:. Sparse deletion of one or both alleles of Hepacam reduces astrocyte territory volume.
(A) Strategy for sparse deletion of Hepacam from cortical astrocytes. (B) Successful deletion of hepaCAM (green) from td-Tomato+ (red) astrocytes in Hepacamf/f RTM mice at P21. Scale bar, 20 μm. (C and E) V1 L5 astrocytes from P7 (C) and P21 (E) Cre+ astrocytes (cyan) from Hepacam+/+ (PALE WT), Hepacamf/+ (PALE Het), and Hepacamf/f (PALE KO) mice. (D and F) Territory volume of td-Tomato+/Cre PALE astrocytes at P7 (D) and P21 (F). P7 n = 3 mice/genotype, 4-8 cells/mouse. P21 n = 6 WT, 7 Het, and 7 KO mice, 4-12 cells/mouse. Data points are mouse averages. Bars are mean ± s.e.m. Nested one-way ANOVA, Tukey’s post-test. See also Figure S4.
Figure 6:
Figure 6:. HepaCAM regulates astrocyte competition for territory.
(A) Strategy for conditional deletion of Hepacam from developing astrocytes. (B) Visual cortex of Hepacam WT (Hepacam+/+; Rtmf/+; Aldh1L1CreERT2/(Tg/0)) and Hepacam cKO (Hepacamf/f; Rtmf/+; Aldh1L1CreERT2/(Tg/0)) mice at P21. Minimal hepaCAM expression observed in Hepacam cKO mice (ii) compared to WT mice (i). Scale bar, 100 μm. (C) V1 L5 astrocytes from Hepacam WT and Hepacam cKO mice at P21 expressing GFP-CAAX. Cre+ astrocytes express td-Tomato (red). (D) Average territory volume. n = 4 mice per genotype, 5-8 cells per mouse. Data points are mouse averages. Bars are mean ± s.e.m. Nested t test. (E) GFP-CAAX-expressing astrocytes (green) and NIV (magenta) from P21 Hepacam WT and Hepacam cKO mice. Scale bar, 20 μm (inset, 5 μm). (F) Average NIV. n = 4 mice per genotype, 5-8 cells per mouse. Data points are mouse averages. Bars are mean ± s.e.m. Nested t test. (G) Strategy for combining Hepacam mutant mice with mosaic analysis with double markers (MADM) chromosome 9 mice. (H) Breeding scheme to generate MADM9 WT:WT and Hepacam MADM9 WT:KO mice. (I) Example image of mosaic labeling in the mouse cortex in MADM9 WT:WT mice with EMX-Cre. Scale bar, 100 μm. (J) Left: Max projection of 5 μm of a z-stack confocal image from MADM9 WT:WT (green and magenta cells both WT) and MADM9 WT:KO (green cells WT, magenta cells KO). Middle: Imaris 3D projection image of entire z-stack image. Right: region of territory overlap between magenta and green neighboring astrocytes (blue). Scale bar, 20 μm. (K) Quantification of the percentage of territory volume overlap between neighboring astrocytes. n = 6 WT:WT and 7 WT:KO mice, 1-2 astrocyte pairs per mouse. Data points are mouse averages. Bars are mean ± s.e.m. Nested t test. (L) Summary of deletion strategies and effect on astrocyte territory. See also Figure S5, S6, and S7.
Figure 7:
Figure 7:. Deletion of Hepacam from astrocytes disrupts Cx43 localization and gap junction coupling.
(A) Confocal images of Cx43 (cyan) expression in Cre+ td-Tomato-expressing astrocytes (red) in L5 of the V1 cortex of Hepacam WT and cKO mice at P21. Scale bar, 20 μm. (B) Average number of Cx43 puncta per image and (C) Cx43 puncta size. Paired two-tailed t-test. (D) Cumulative probability distribution of Cx43 puncta size. Kolmogorov-Smirnov test. (E) Average intensity of individual Cx43 puncta and (F) average intensity of Cx43 signal per image. Paired two-tailed t test. (B-F) 5 images/section, 3 sections/brain, from 3 sex-matched littermate pairs. Data points are mouse averages. Bars are mean ± s.e.m. (G) STED microscopy images of Cx43 expression from Hepacam WT and cKO mice at P21. Scale bar, 5 μm. (H) STED images of Cx43 expression in sparsely transfected Hepacam PALE WT or PALE KO astrocytes from L5 of V1 at P21. Scale bar, 5 μm. (I) Schematic of classification of Cx43 puncta as Type 1 (on branches) or Type 2 (between branches). (J) Quantification of Cx43 puncta localization in Hepacam WT vs cKO mice and (K) PALE WT vs PALE KO astrocytes. 4 neuropil-containing ROI/image, 8 images/genotype from 3 sex-matched littermate pairs. Data are mean ± s.e.m. Unpaired two-tailed t test. (L) Overview of gap junction coupling assay. Neurobiotin was loaded into a single td-Tomato+ astrocyte (magenta) in acute cortical slices for 30 min. (M) Images of cortical slices stained with Streptavidin 488 (green) to detect neurobiotin-labeled cells. Scale bar, 100 μm. (N) Average number of labeled cells per slice. n = 5 slices from at least 3 mice per condition. Data are mean ± s.e.m. Unpaired, two-tailed t test. See also Figure S7.
Figure 8:
Figure 8:. Astrocytic hepaCAM regulates inhibitory synapse formation and function.
(A) Three-color STED image of L5 V1 at P21 showing co-localization (arrows) of hepaCAM (cyan) with inhibitory pre- (VGAT, red) and post-synaptic (Gephryin, green) markers. Scale bar, 5 μm. (B and D) Images of inhibitory synapses (VGAT (magenta) and Gephyrin (green)) in L1 (B) and L5 (D) of V1 cortex. Scale bar, 5 μm. (C and E) Average number of inhibitory synapses per image. n = 5 images/section, 3 sections/mouse, 4 sex-matched littermate pairs. Data points represent mouse averages. Bars are mean ± s.e.m. Paired two-tailed t test. (F) mIPSC traces from L5 pyramidal neurons in acute V1 slices from Hepacam WT and cKO mice. (G and H) Representative cumulative distributions of mIPSC frequency (G) and amplitude (H) from Hepacam WT and cKO pyramidal neurons. Kolmogorov-Smirnov test (I and J) Average mIPSC frequency (I) and amplitude (J). n = 25 WT and 22 cKO neurons from 3 mice per genotype. Data are mean ± s.e.m. Unpaired, two-tailed t test. (K) mEPSC traces from L5 pyramidal neurons in acute V1 slices from hepaCAM WT and cKO mice. (L and M) Representative cumulative distributions of mEPSC frequency (L) and amplitude (M) from Hepacam WT and cKO pyramidal neurons. Kolmogorov-Smirnov test. (N and O) Average neuron mEPSC frequency (N) and amplitude (O). n = 24 WT and 21 cKO neurons from 3 mice per genotype. Data are mean ± s.e.m. Unpaired, two-tailed t test. See also Figure S8.

Comment in

References

    1. Allen NJ, and Lyons DA (2018). Glia as architects of central nervous system formation and function. Science 362, 181–185. - PMC - PubMed
    1. Arshadi C, Eddison M, Günther U, Harrington KIS, and Ferreira TA (2020). SNT: A Unifying Toolbox for Quantification of Neuronal Anatomy. bioRxiv, 2020.2007.2013.179325 - PubMed
    1. Baldwin KT, and Eroglu C (2017). Molecular mechanisms of astrocyte-induced synaptogenesis. Curr Opin Neurobiol 45, 113–120. - PMC - PubMed
    1. Beahm DL, Oshima A, Gaietta GM, Hand GM, Smock AE, Zucker SN, Toloue MM, Chandrasekhar A, Nicholson BJ, and Sosinsky GE (2006). Mutation of a conserved threonine in the third transmembrane helix of alpha- and beta-connexins creates a dominant-negative closed gap junction channel. J Biol Chem 281, 7994–8009. - PubMed
    1. Beardslee MA, Laing JG, Beyer EC, and Saffitz JE (1998). Rapid turnover of connexin43 in the adult rat heart. Circ Res 83, 629–635. - PubMed

Publication types

Substances