. 2021 Jul 15;81(14):2875-2886.e5.
doi: 10.1016/j.molcel.2021.05.017. Epub 2021 Jun 24.

Structural basis of transcriptional activation by the Mycobacterium tuberculosis intrinsic antibiotic-resistance transcription factor WhiB7

Affiliations

Structural basis of transcriptional activation by the Mycobacterium tuberculosis intrinsic antibiotic-resistance transcription factor WhiB7

Mirjana Lilic et al. Mol Cell. .

Abstract

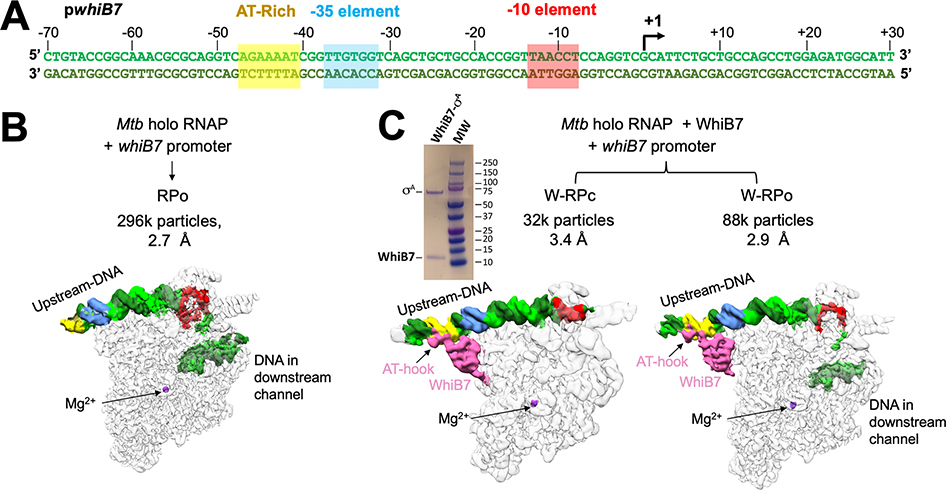
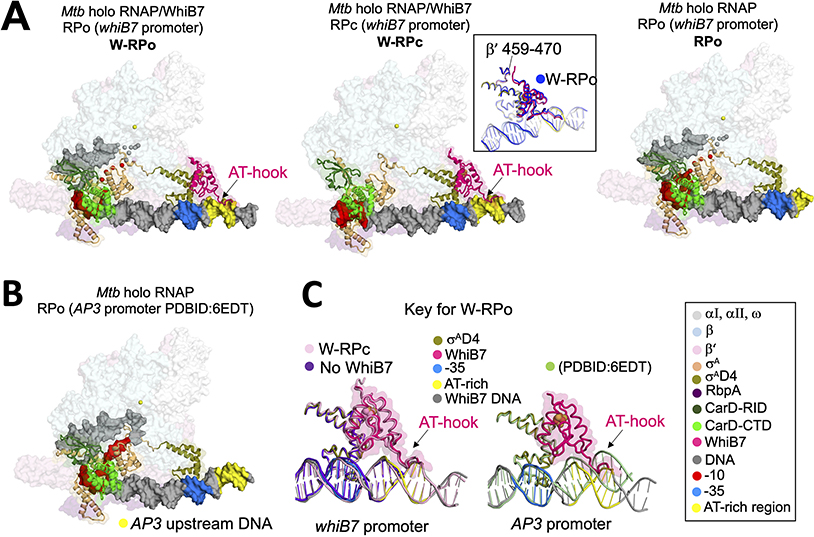
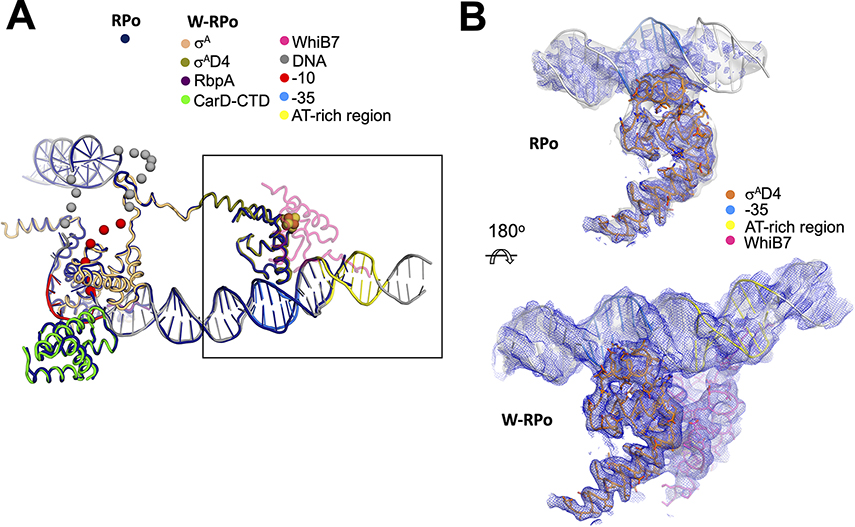
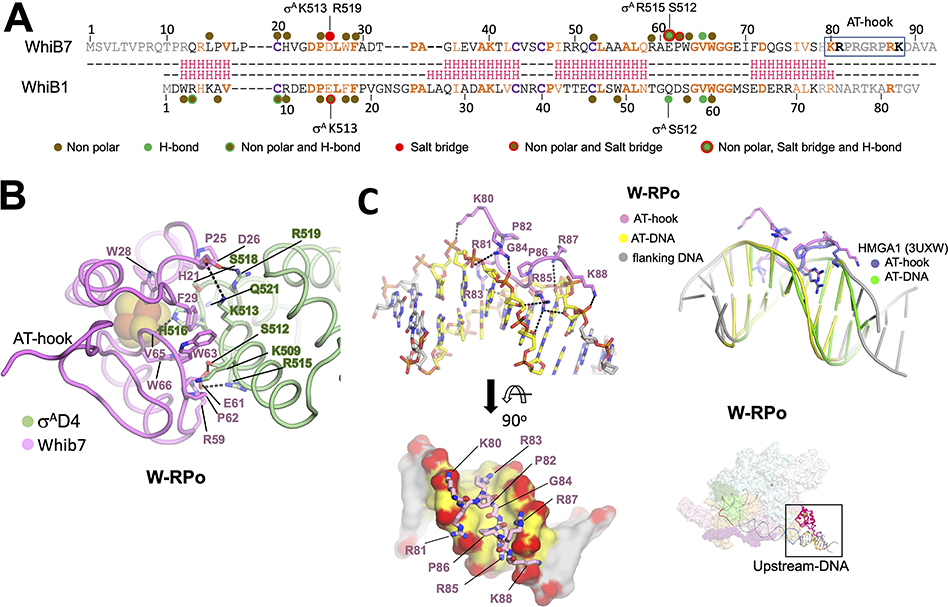
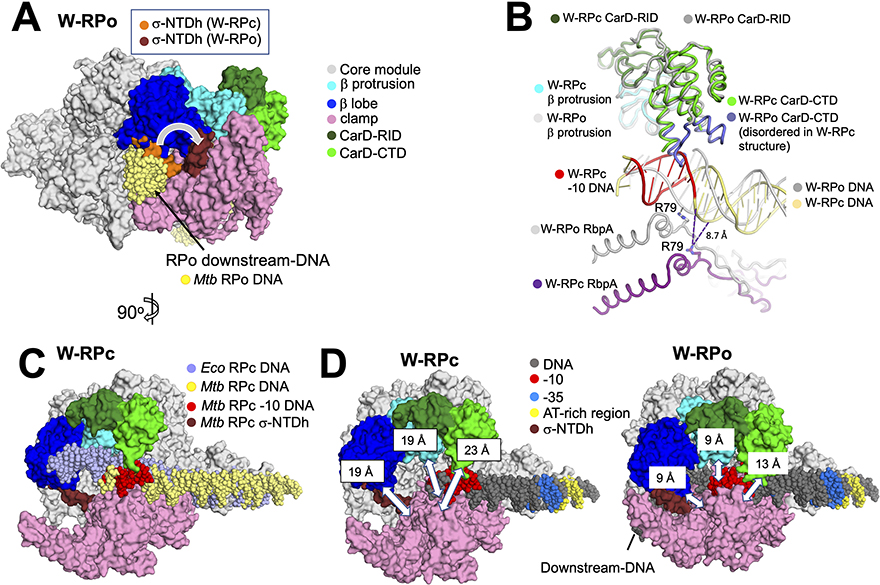
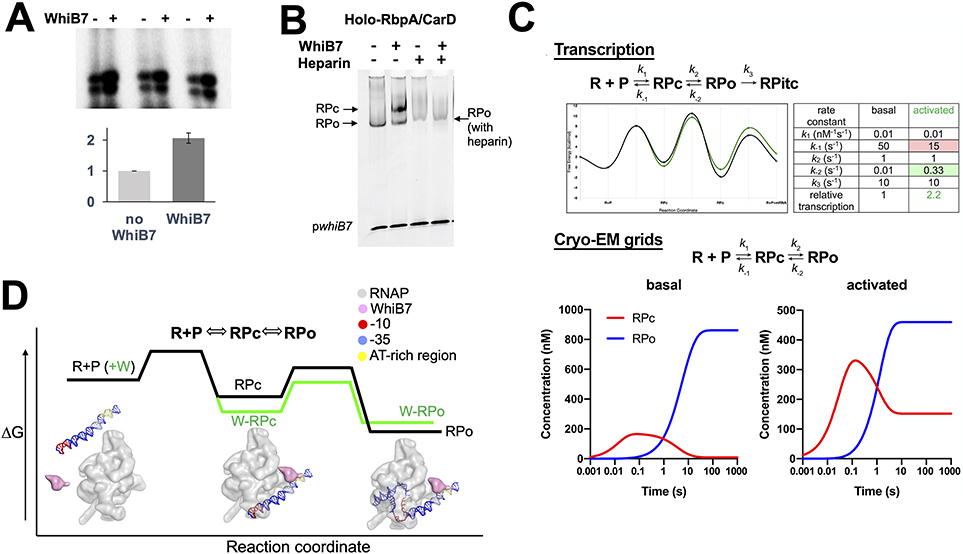
In pathogenic mycobacteria, transcriptional responses to antibiotics result in induced antibiotic resistance. WhiB7 belongs to the Actinobacteria-specific family of Fe-S-containing transcription factors and plays a crucial role in inducible antibiotic resistance in mycobacteria. Here, we present cryoelectron microscopy structures of Mycobacterium tuberculosis transcriptional regulatory complexes comprising RNA polymerase σA-holoenzyme, global regulators CarD and RbpA, and WhiB7, bound to a WhiB7-regulated promoter. The structures reveal how WhiB7 interacts with σA-holoenzyme while simultaneously interacting with an AT-rich sequence element via its AT-hook. Evidently, AT-hooks, rare elements in bacteria yet prevalent in eukaryotes, bind to target AT-rich DNA sequences similarly to the nuclear chromosome binding proteins. Unexpectedly, a subset of particles contained a WhiB7-stabilized closed promoter complex, revealing this intermediate's structure, and we apply kinetic modeling and biochemical assays to rationalize how WhiB7 activates transcription. Altogether, our work presents a comprehensive view of how WhiB7 serves to activate gene expression leading to antibiotic resistance.

Keywords: RNA polymerase; WhiB7; antibiotic resistance; cryo-EM; iron cluster; transcription; transcription factor; transcription initiation.


Conflict of interest statement

Declaration of interests The authors declare no competing interests.

Figures

Figure 1.
Figure 1.. Cryo-EM analysis of Mtb RNAP initiation complexes on the whiB7 promoter reveal distinct transcription intermediates.
A. Duplex Mtb whiB7 promoter fragment used for cryo-EM. The promoter elements (AT-rich WhiB7 regulatory motif; yellow, −35 element, blue; −10 element, red) and the transcription start site (+1; arrow) are denoted. The top (non-template) strand and bottom (template) strand are colored light and dark green, respectively. B. Structural class derived from the cryo-EM data without WhiB7 on the whiB7 promoter. Cryo-EM composite maps are low-pass filtered according to the local resolution (Figure S2I) (Cardone et al., 2013) and shown as white transparent molecular surfaces. The DNA is shown as a solid surface and colored as in (A). The active site Mg2+ is indicated for reference. The number of particles and nominal resolution of each structure are indicated above the structures. C. Structural classes derived from the cryo-EM data and with WhiB7 on the whiB7 promoter. Cryo-EM composite maps are low-pass filtered according to the local resolution (Figures S2C, F) (Cardone et al., 2013) and shown as white transparent molecular surfaces. The DNA is shown as a solid surface and colored as in (A). WhiB7 is colored in pink and the active site Mg2+ is indicated for reference. The number of particles and nominal resolution of each structure are indicated above the structures. Upper left, Coomassie stained SDS-PAGE analysis of purified σA/WhiB7 complex.
Figure 2.
Figure 2.. Structures of Mtb CarD-RbpA-EσA-DNA complexes with and without WhiB7.
A. Overall structures of W-RPo, W-RPc, and RPo on the whiB7 promoter. Core RNAP and RbpA are shown as transparent surfaces. CarD, WhiB7 and σA are rendered in cartoon and the DNAs are shown as molecular surfaces. Each feature is colored as labeled in the key on the bottom right. Middle inset, W-RPo (blue) aligned to W-RPc (colored by key) by WhiB7 to show that the disposition of WhiB7 to the β’ subunit is the same between structures. B. Structure of RPo on the AP3 promoter (Boyaci et al., 2019a). The upstream DNA corresponding the AT-rich motif of the whiB7 promoter is colored yellow to emphasize the upstream DNA trajectory. C. Alignment of σAD4 from structures in (A) and (B) shows the trajectories of the upstream DNA in the different structures. Left: The presence of WhiB7 stabilizes the DNA at least 14 bps upstream of the −35 element (pink and grey versus purple). Right: The upstream trajectory of the whiB7 promoter, in the presence of WhiB7, differs from that of RPo with the AP3 promoter (pale green); WhiB7 would clash with the upstream DNA of RPo with the AP3 promoter.
Figure 3.
Figure 3.. WhiB7 stabilizes σAD4 contacts with the −35 promoter element
A. The W-RPo and RPo structures were superimposed by aligning α-carbon positions of σA, the CarD-CTD, and the RbpA-linker (root-mean-square deviation of 0.535 Å over 417 α-carbon atoms). The resulting DNA structures closely superimposed. WhiB7 is shown in faded pink to increase the clarity of σAD4. The disordered and unmodeled regions of the transcription bubble are indicated by spheres. B. The sharpened (blue mesh) and local-resolution filtered (gray transparent surface) cryo-EM maps are show for RPo (top) and W-RPo (bottom), with the structures superimposed. The view shows a zoom-in of the boxed area in (A), reoriented as shown. Cryo-EM density for σAD4 contacts with the −35 promoter region in RPo is weak in the sharpened map, and density in the local-resolution filtered map disappears about six base-pairs upstream of the −35 motif. Cryo-EM density for the σAD4 contacts with the −35 promoter region in W-RPo is well-resolved and better connected in both the sharpened (blue mesh) and local-resolution filtered (light grey surface) maps, and density extends well upstream of the AT-rich DNA bound by the WhiB7 AT-hook. Maps were normalized in PyMOL and contoured at 4σ.
Figure 4.
Figure 4.. WhiB7 interactions with σAD4 and DNA.
A. Structure-based sequence alignment of Mtb WhiB7 and WhiB1. Residues of WhiB1 that interact with σAD4 (Wan et al., 2020) are highlighted by the nature of interactions and compared to those of WhiB7 (this study). Residues of σAD4 participating in ionic interactions are indicated above or below the sequences. The DNA binding AT-hook motif of WhiB7 is boxed. The interactions between WhiB7 and σAD4 were determined using a 4.5 Å distance cutoff (CCP4) (Winn et al., 2011) between carbon atoms for nonpolar interactions, a 4.5 Å cutoff between basic and acidic side chains for ionic interactions, and a 3.5 Å cutoff for hydrogen bonds between donors and acceptors. Identical residues are bolded orange, homologous residues colored orange, and the conserved cysteines that chelate the 4Fe-4S cluster are in bolded purple. The secondary structure of each protein is shown in red: H indicates helices. B. Residues of WhiB7 and σAD4 that interact with each other are shown in stick, and each protein’s backbone is shown in cartoon tube. Dotted lines connect residues of σAD4 and WhiB7 that participate in ionic or hydrogen bond interactions. The 4Fe-4S cluster is drawn as spheres. C. Top left: WhiB7 AT-hook interactions with the AT-rich DNA are indicated. Both the AT-hook and the DNA are drawn as cartoon sticks and colored, as indicated. Bottom left: A top view showing the WhiB7 AT-hook fits intimately into the minor groove of the AT-rich motif. The DNA is rendered in surface, and backbone oxygens are colored red to highlight the ionic and hydrogen bonds between WhiB7 and the DNA. Top Right: an alignment of the AT-rich DNA of W-RPo to that of the crystal structure of the human HMGA1 AT-hook with DNA (Fonfría-Subirós et al., 2012) shows that the AT-hooks superimpose well. Bottom Right: Image in the top inset shows the W-RPo structure for reference with the region of interest boxed.
Figure 5.
Figure 5.. Comparisons of structural differences between W-RPc, W-RPo and Eco RPc.
A. Structural alignment of the core module (Boyaci et al., 2018) of W-RPc to W-RPo shows that in WRPc, σA N-terminal domain helix (W-RPc σ-NTDh; orange) occupies the space in the channel where the downstream-DNA (colored yellow in this model) eventually rests in W-RPo. Upon W-RPo formation, the helix is moved (W-RPo σ-NTDh; brick red) to interact with the β- lobe so that the DNA can be placed in its RPo position. The structure shown is W-RPo with the superimposed W-RPc σ-NTD. Core, β lobe, β protrusion, clamp and CarD are colored as listed in key on the right. B. Structural alignment of the β-protrusion between W-RPo and W-RPc reveals that CarD from W-RPc would clash with the double-stranded −10 element DNA. In W-RPc, the loops on the CarD-CTD (colored purple) are disordered, presumably due to the clash with the double-stranded DNA. In W-RPo, RbpA-R79 is positioned to form an ionic bond (2.0 Å distance) with OP1 of the non-template strand DNA −14 position, an interaction shown previously to be critical for RbpA transcription activation function (Hubin et al., 2017). However, RpbA-R79 in W-RPc is 19 Å away from the non-template DNA −14 phosphate oxygens, and the closest nucleotide is the non-template strand −16 position, located 8.7 Å away. Thus, RbpA-DNA backbone contacts are not established in RPc. Dashed lines indicate distances, with the distance of 8.7 Å noted for reference. C. Structural alignment of the core module of Eco RPc (Boyaci et al., 2018) and W-RPc reveals that the downstream DNA trajectory changes due to CarD-CTD (green). The structure shown is W-RPc, except for the Eco RPc DNA (slate). Core, β lobe, β protrusion, clamp and CarD are colored as listed in key in (A). D. Distances between the clamp and the β-lobe (α-carbons of σA-F233 and β-G284), the clamp and β-protrusion (α-carbons of σA-R309 and b-E402), and the clamp and CarD-CTD (a-carbons of σA-T345 and CarD-R87) were measured for W-RPc (left) and W-RPo (right) using PyMOL (The PyMOL Molecular Graphics System, Version 2.3.5 Schrodinger, LLC). These distances are illustrated by white double-edged arrows and noted on the “top” pincer domains. Core, β lobe, β protrusion, clamp, CarD, σ-NTDh and DNA are colored as listed in key in (A).
Figure 6.
Figure 6.. Kinetic modeling of WhiB7’s effect on the RPo formation pathway.
A. Representative transcription assays showing abortive transcripts synthesized from Mtb RNAP and Mtb RNAP/WhiB7 holoenzymes. The assay was performed in triplicate and the results were quantified and shown in the histogram. The activity of Mtb RNAP was normalized to 1 and the values are the average of triplicate experiments. The error bars denote the mean standard errors. B. Native EMSA showing that WhiB7 increases Mtb holo-RbpA/CarD shifting of the pwhiB7 DNA. In the presence of WhiB7, two shifted bands are observed; one is resistant to heparin (RPo), the other is heparin-sensitive (RPc). C. The transcript flux calculator (Galburt, 2018) was used to illustrate that an activator like WhiB7 could alter the kinetic parameters in a simple four-state kinetic model (Walter et al., 1967): R + P ⇄ RPc ⇄ RPo → RPITC to increase the steady state flux into RPITC by a factor of approximately 2. (top) Kinetic model (Galburt, 2018) and the definition of the kinetic parameters (see text). The table on the right lists the values of the rate constants for basal and activated transcription, yielding the energy profiles shown on the left (black line, basal; green line, activated) (Galburt, 2018). The calculated transcript flux for the basal conditions was normalized to 1. The activated conditions increase the transcript flux by a factor of 2.2 (Galburt, 2018). (bottom) Under the equilibrium conditions of cryo-EM grid preparation (no nucleotide substrates, so no transition of RPo into RPitc): R + P ⇄ RPc ⇄ RPo. The basal kinetic parameters (no WhiB7) yield only RPo at equilibrium, while the same changes in the kinetic parameters that activate transcription ~2-fold (A) result in the appearance of RPc in equilibrium with RPo at a ratio of about 1:3, similar to the experimental observation (Figure 1C). The concentration profiles were calculated from the kinetic parameters using Kintek Explorer (Johnson et al., 2009). To achieve this result, the rate of dissociation of RPc back to R+P was decreased, while the rate of dissociation of RPo back to RPc was increased (top). Examination of the energy landscapes shows that these changes effectively stabilize RPc with respect to RPo (top). D. A schematic model for how WhiB7 could affect the free energy profile for a two-step mechanism of RPo formation on the whiB7 promoter (R+P O RPc O RPo) is shown. Superimposed are blob renditions of stable states (RPc and RPo), as observed in our structures (Figure 1B, C). The black line indicates the reaction in the absence of WhiB7 and the green indicates how WhiB7 could change the profile to both activate transcription and stabilize RPc with respect to RPo, as observed in (B).

Similar articles

Cited by

References

    1. Adams PD, Afonine PV, Bunkóczi G, Chen VB, Davis IW, Echols N, Headd JJ, Hung LW, Kapral GJ, Grosse-Kunstleve RW, et al. (2010). PHENIX: A comprehensive Python-based system for macromolecular structure solution. Acta Crystallographica Section D: Biological Crystallography 66, 213–221. - PMC - PubMed
    1. Afonine PV, Klaholz BP, Moriarty NW, Poon BK, Sobolev OV, Terwilliger TC, Adams PD, and Urzhumtsev A (2018). New tools for the analysis and validation of cryo-EM maps and atomic models. Acta Crystallographica Section D l 74, 814–840. - PMC - PubMed
    1. Aravind L (1998). AT-hook motifs identified in a wide variety of DNA-binding proteins. Nucleic Acids Research 26, 4413–4421. - PMC - PubMed
    1. Bae B, Feklistov A, Lass-Napiorkowska A, Landick R, and Darst SA (2015a). Structure of a bacterial RNA polymerase holoenzyme open promoter complex. ELife 4, e08504. - PMC - PubMed
    1. Bae B, Chen J, Davis E, Leon K, Darst SA, and Campbell EA (2015b). CarD uses a minor groove wedge mechanism to stabilize the RNA polymerase open promoter complex. ELife 4, e08505. - PMC - PubMed

Publication types

MeSH terms

LinkOut - more resources