. 2021 Aug 23;31(16):3504-3514.e9.
doi: 10.1016/j.cub.2021.05.067. Epub 2021 Jun 24.

An ancient viral epidemic involving host coronavirus interacting genes more than 20,000 years ago in East Asia

Affiliations

An ancient viral epidemic involving host coronavirus interacting genes more than 20,000 years ago in East Asia

Yassine Souilmi et al. Curr Biol. .

Erratum in

Abstract

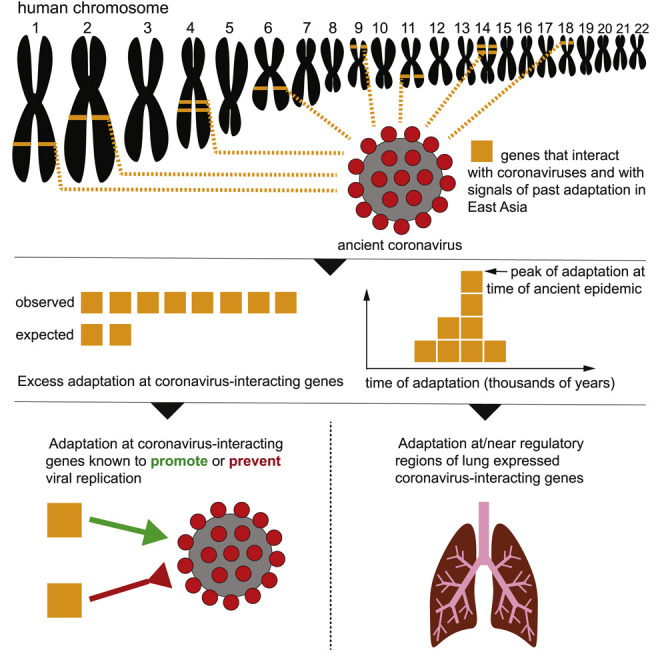
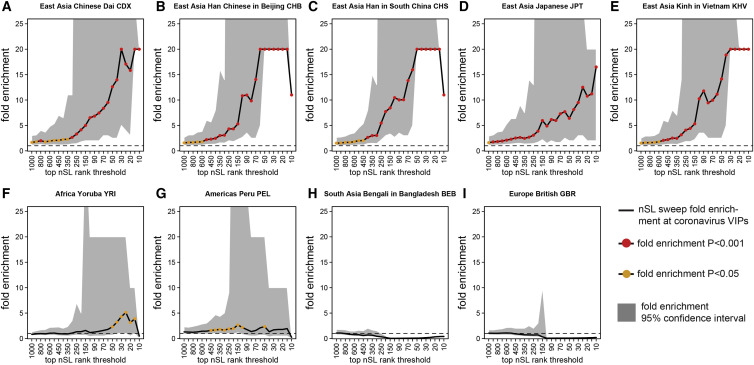
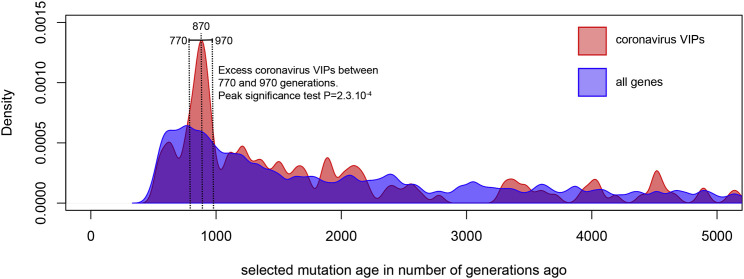
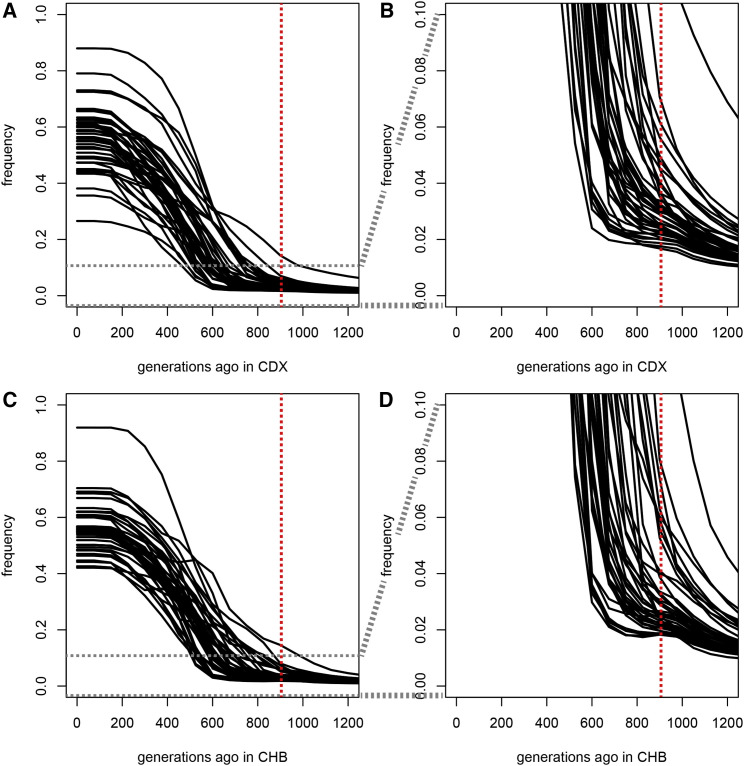
The current severe acute respiratory syndrome coronavirus 2 (SARS-CoV-2) pandemic has emphasized the vulnerability of human populations to novel viral pressures, despite the vast array of epidemiological and biomedical tools now available. Notably, modern human genomes contain evolutionary information tracing back tens of thousands of years, which may help identify the viruses that have impacted our ancestors-pointing to which viruses have future pandemic potential. Here, we apply evolutionary analyses to human genomic datasets to recover selection events involving tens of human genes that interact with coronaviruses, including SARS-CoV-2, that likely started more than 20,000 years ago. These adaptive events were limited to the population ancestral to East Asian populations. Multiple lines of functional evidence support an ancient viral selective pressure, and East Asia is the geographical origin of several modern coronavirus epidemics. An arms race with an ancient coronavirus, or with a different virus that happened to use similar interactions as coronaviruses with human hosts, may thus have taken place in ancestral East Asian populations. By learning more about our ancient viral foes, our study highlights the promise of evolutionary information to better predict the pandemics of the future. Importantly, adaptation to ancient viral epidemics in specific human populations does not necessarily imply any difference in genetic susceptibility between different human populations, and the current evidence points toward an overwhelming impact of socioeconomic factors in the case of coronavirus disease 2019 (COVID-19).

Keywords: ancient epidemics; coronaviruses; human genomes.


Conflict of interest statement

Declaration of interests The Krogan Laboratory has received research support from Vir Biotechnology and F. Hoffmann-La Roche. N.J.K. has consulting agreements with the Icahn School of Medicine at Mount Sinai, New York, Maze Therapeutics, and Interline Therapeutics; is a shareholder of Tenaya Therapeutics; and has received stocks from Maze Therapeutics and Interline Therapeutics. The other authors declare no competing interests.

Figures

None
Graphical abstract
Figure 1
Figure 1
Coronavirus VIPs nSL ranks enrichment (A)–(E) are East Asian populations, and (F)–(I) are populations from other continents. The y axis represents the bootstrap test (STAR Methods) relative fold enrichment of the number of genes in putative sweeps at CoV-VIPs, divided by the number of genes in putative sweeps at control genes matched for multiple confounding factors. The x axis represents the top rank threshold to designate putative sweeps. Black full line, average fold enrichment over 5,000 bootstrap test control sets. Fold enrichments greater than 20 are represented at 20. Gray area, 95% confidence interval of the fold enrichment over 5,000 bootstrap test control sets. The rank thresholds where the confidence interval lower or higher fold enrichment has a denominator of zero are not represented (for example, graph B, top 10 rank threshold). Lower confidence interval fold enrichments higher than 20 are represented at 20 (for example, graph B, top 30 rank threshold). Red dots, bootstrap test fold enrichment p < 0.001. Orange dots, bootstrap test fold enrichment p < 0.05. Note that the bootstrap test p values are not the same as the whole curve enrichment false positive risk (FPR) estimated using block-randomized genomes on top of the bootstrap test (STAR Methods). Related to STAR Methods and Figures S2–S4.
Figure 2
Figure 2
Timing of selection at CoV-VIPs The figure shows the distribution of selection start times at CoV-VIPs (pink distribution) compared to the distribution of selection start times at all loci in the genome (blue distribution). Details on how the two distributions are compared by the peak significance test, and how the selection start times are estimated with Relate, are provided in STAR Methods. Related to STAR Methods and Figure S1.
Figure 3
Figure 3
Selected CoV-VIPs allele frequency trajectories over time estimated by CLUES in East Asia Each frequency trajectory is for one of the 42 Relate selected mutations at CoV-VIPs within the peak around 900 generations ago (STAR Methods). (A) Frequency trajectories in the Chinese Dai CDX 1000 Genomes population. (B) Same but zoomed in from frequencies 0%–10%. (C) Frequency trajectories in the Han Chinese from Beijing CHB 1000 Genomes population. (D) Same but zoomed in from frequencies 0%–10%. Related to STAR Methods.
Figure 4
Figure 4
Selected CoV-VIPs allele frequency trajectories over time estimated by CLUES in Africa (Yoruba) and Europe (British) Same as Figure 3. (A) Yoruba population. The graph includes 17 frequency trajectories, the 25 other alleles selected in East Asia being absent in the Yoruba sample (but not Africa overall; see Data S1I). (B) British population. The graph includes 35 frequency trajectories, the other seven alleles selected in East Asia being absent in the British sample. Related to STAR Methods.
Figure 5
Figure 5
Coronavirus selected VIPs selection coefficients estimated by CLUES This figure shows classic R boxplots of selected coefficients at the 42 Relate selected mutations within the peak around 900 generations ago (STAR Methods). (A) Selection coefficients in the Chinese Dai CDX 1000 Genomes population. (B) Selection coefficients in the Han Chinese from Beijing CHB 1000 Genomes population. Left: average selection coefficients between 0 and 500 generations ago are shown. Right: average selection coefficients between 500 and 1,000 generations ago are shown. Related to STAR Methods.
Figure 6
Figure 6
Validation of selected CoV-VIPs/SARS-CoV-2 protein interactions using cell-free expressed proteins (A) A representative image of SDS-PAGE gel loaded with in vitro translation reactions co-expressing human VIPs/SARS-CoV-2 proteins in Leishmania tarentolae (LTE) system. Human proteins were tagged with EGFP at N terminus, and the viral proteins were tagged with mCherry at C terminus. The protein bands were visualized by fluorescence scanning; viral proteins: M,ORF9c, ORF10, and NSP5; human proteins: ACADM, C20orf4, PMPCA, NDFIP2, PPT1, and ARF6. (B) A plot of representative signals of AlphaLISA interaction assay for VIP/viral protein pairs shown in (A). Zika virus self-dimerizing C-protein tagged with Cherry and EGFP was used as positive interaction control. As the negative control, we used FKBP-rapamycin-binding (FRB) domain. (C) Graphic summary of the VIPs/SARS-CoV-2 interaction analysis: the confirmed interactions are shown with green circle, whereas interactions that could not be conformed using this assay are depicted as red diamond. Related to STAR Methods and Figure S6.
Figure 7
Figure 7
Proximity of selection signals to GTEx eQTLs at the 42 selected CoV-VIPs compared to random CoV-VIPs The histogram shows how close selection signals localized by iSAFE peaks are to the GTEx eQTLs from 25 different tissues, at peak-VIPs compared to randomly chosen CoV-VIPs (STAR Methods). How close iSAFE peaks are to GTEx eQTLs compared to random CoV-VIPs is estimated through a proximity ratio. The proximity ratio is described in the STAR Methods. It quantifies how much closer iSAFE peaks are to eQTLs of a specific GTEx tissue, compared to random expectations that take the number and structure of iSAFE peaks as well as the number and structure of GTEx eQTLs into account (STAR Methods). ∗∗∗∗Proximity ratio test p < 0.0001. ∗∗∗Proximity ratio test p < 0.001. ∗∗p < 0.01. p < 0.05. Note that lower proximity ratios can be associated with smaller p values for tissues with more eQTLs (due to decreased null variance; for example, skeletal muscle versus pancreas). Related to STAR Methods and Figure S5.

Comment in

  • Coronavirus footprints.
    Alam O. Alam O. Nat Genet. 2021 Aug;53(8):1119. doi: 10.1038/s41588-021-00916-w. Nat Genet. 2021. PMID: 34363044 No abstract available.

References

    1. Ou X., Liu Y., Lei X., Li P., Mi D., Ren L., Guo L., Guo R., Chen T., Hu J., et al. Characterization of spike glycoprotein of SARS-CoV-2 on virus entry and its immune cross-reactivity with SARS-CoV. Nat. Commun. 2020;11:1620. - PMC - PubMed
    1. Hoffman C., Kamps B.S. Flying Publisher; 2003. SARS Reference.
    1. Dong E., Du H., Gardner L. An interactive web-based dashboard to track COVID-19 in real time. Lancet Infect. Dis. 2020;20:533–534. - PMC - PubMed
    1. Balogun O.D., Bea V.J., Phillips E. Disparities in cancer outcomes due to COVID-19-a tale of 2 cities. JAMA Oncol. 2020;6:1531–1532. - PubMed
    1. Sattar N., McInnes I.B., McMurray J.J.V. Obesity is a risk factor for severe COVID-19 infection: multiple potential mechanisms. Circulation. 2020;142:4–6. - PubMed

Publication types

LinkOut - more resources