. 2021 Jul 22;184(15):3962-3980.e17.
doi: 10.1016/j.cell.2021.05.046. Epub 2021 Jun 3.

Profiling SARS-CoV-2 HLA-I peptidome reveals T cell epitopes from out-of-frame ORFs

Collaborators, Affiliations

Profiling SARS-CoV-2 HLA-I peptidome reveals T cell epitopes from out-of-frame ORFs

Shira Weingarten-Gabbay et al. Cell. .

Abstract

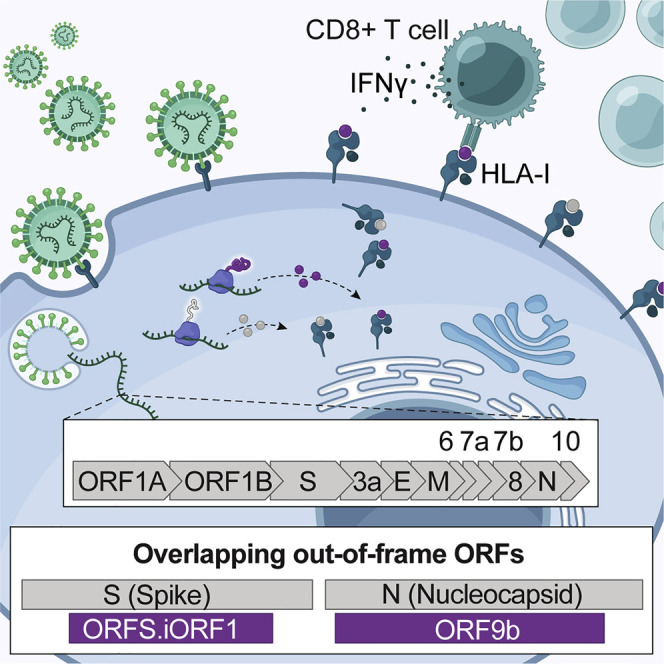
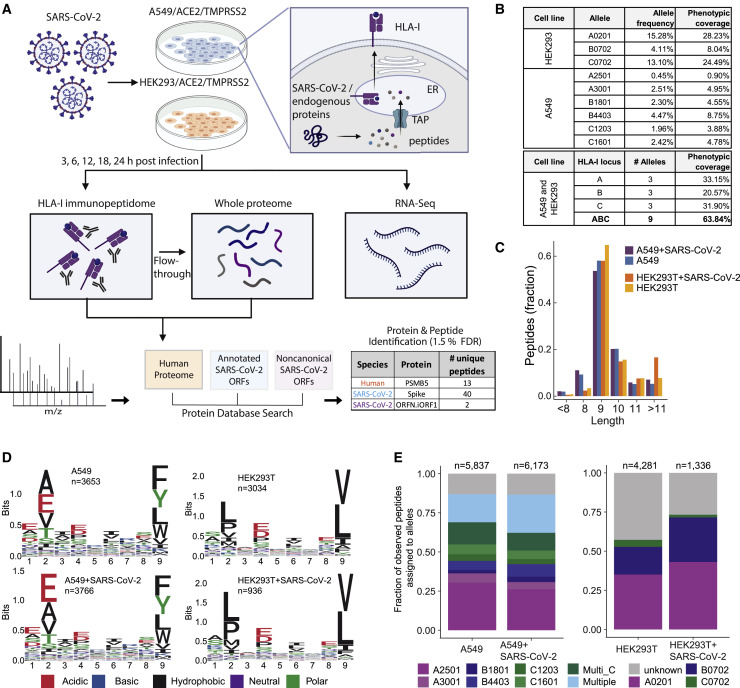
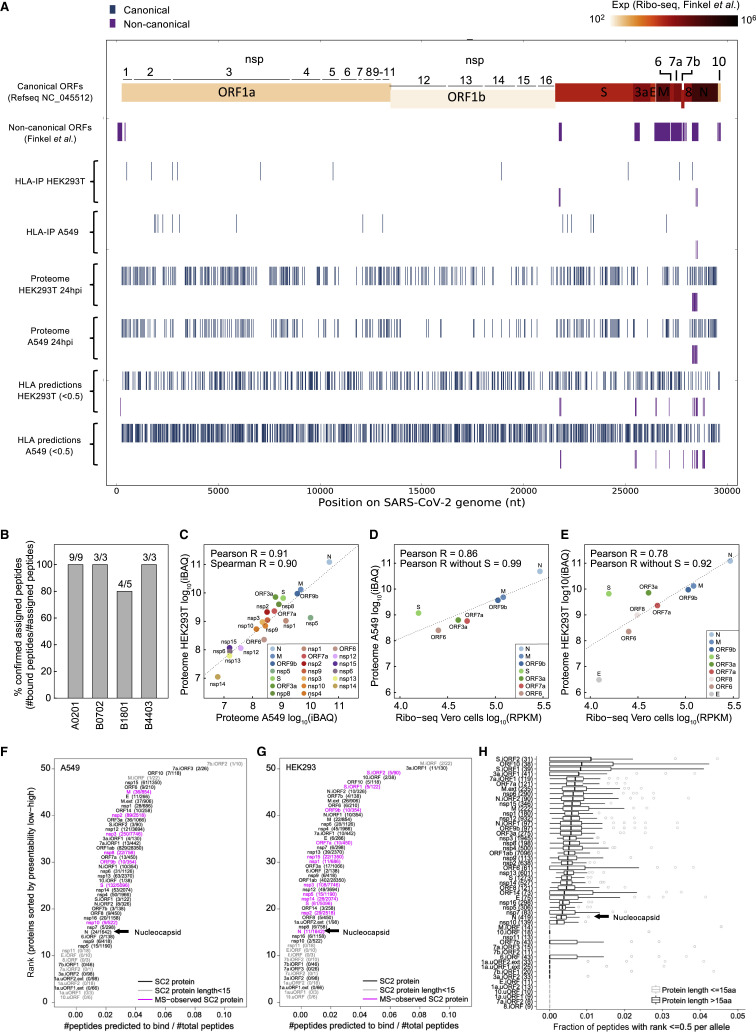
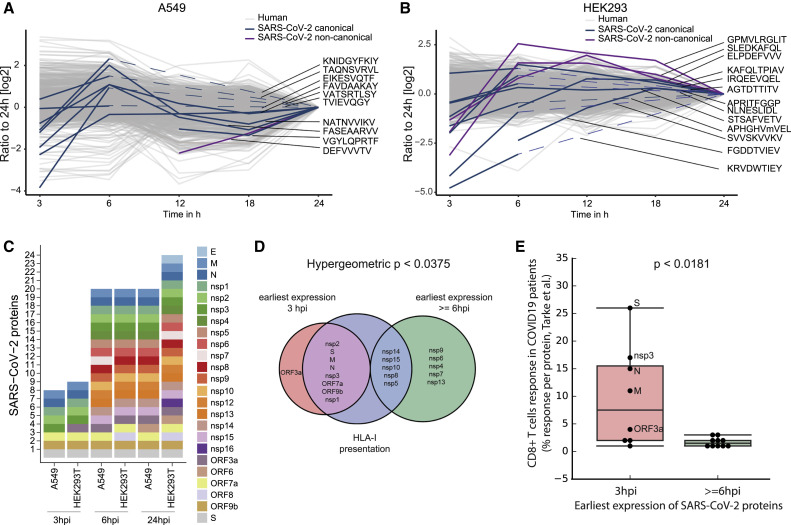
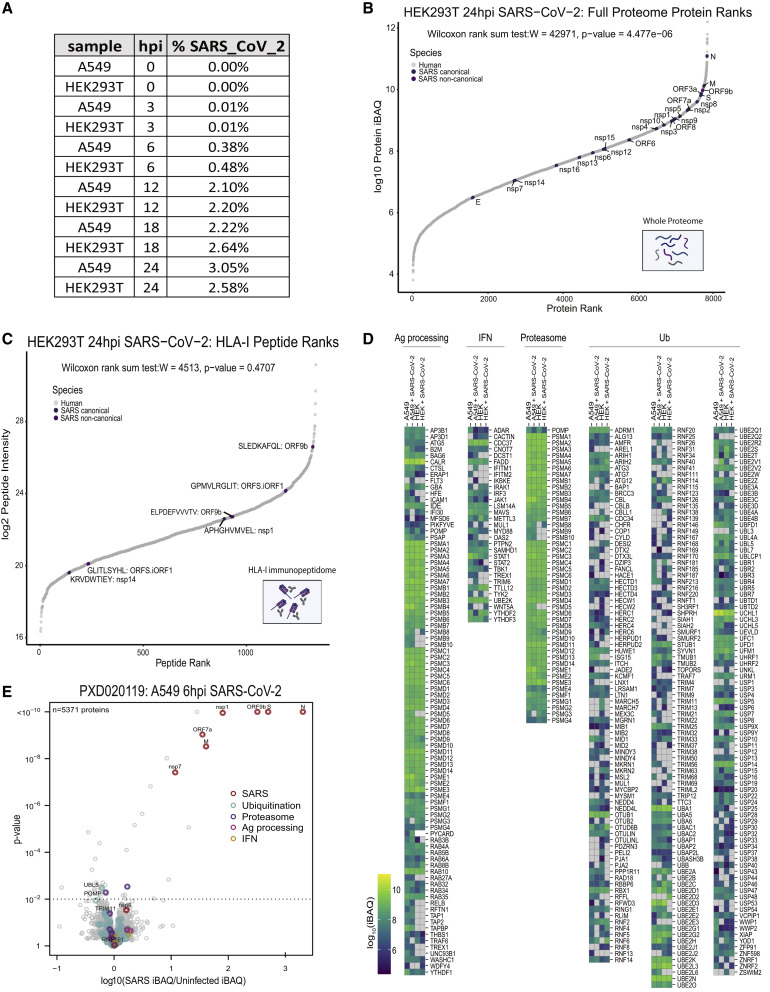
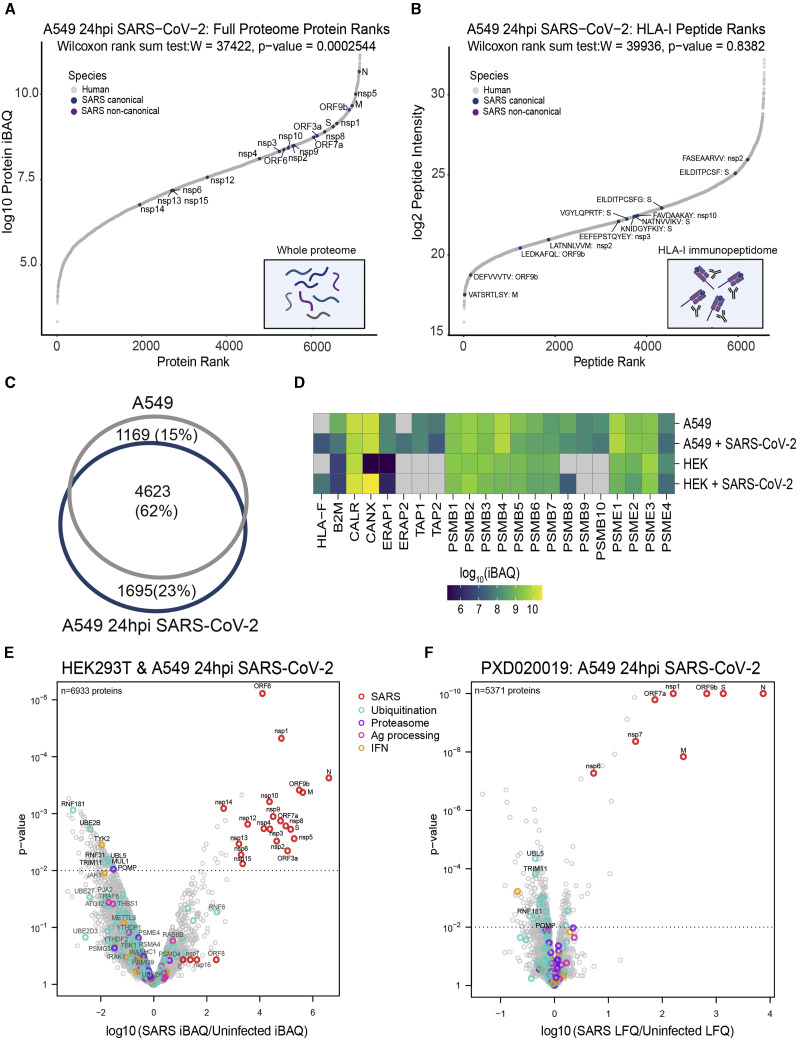
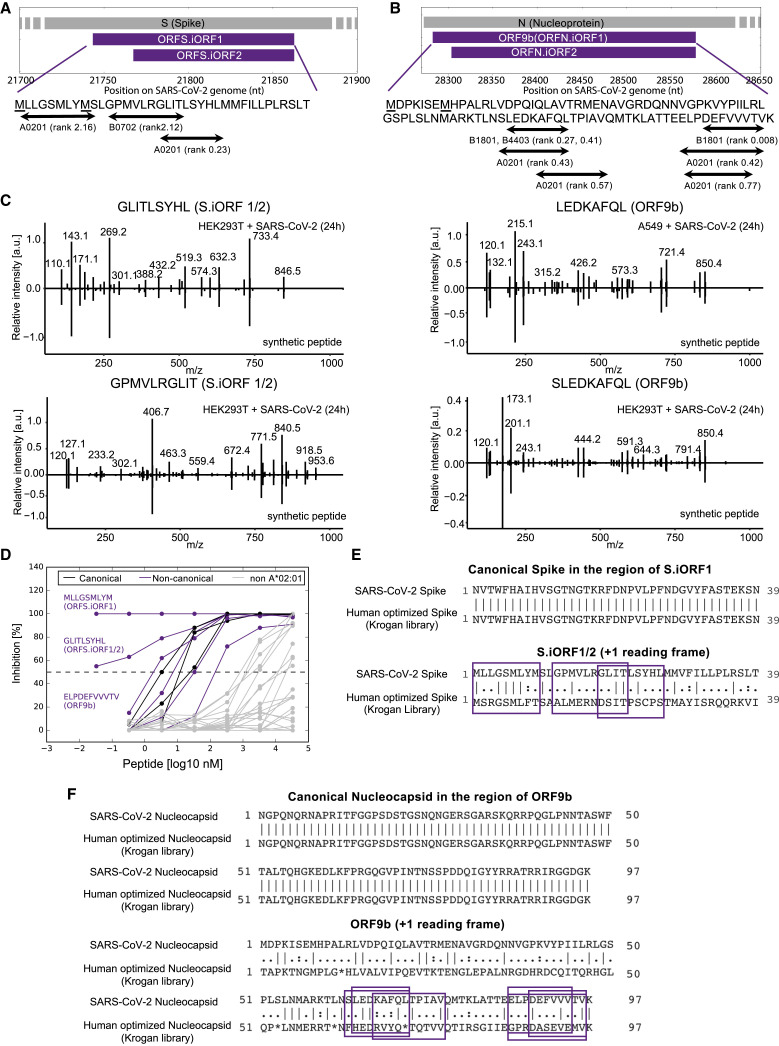
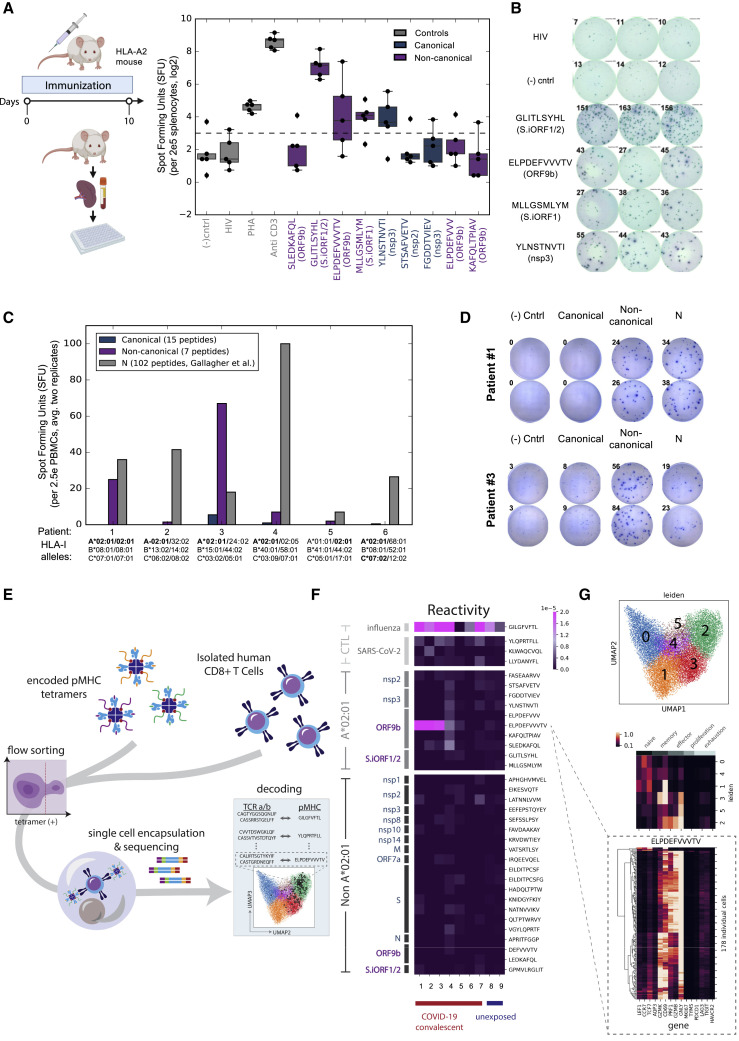
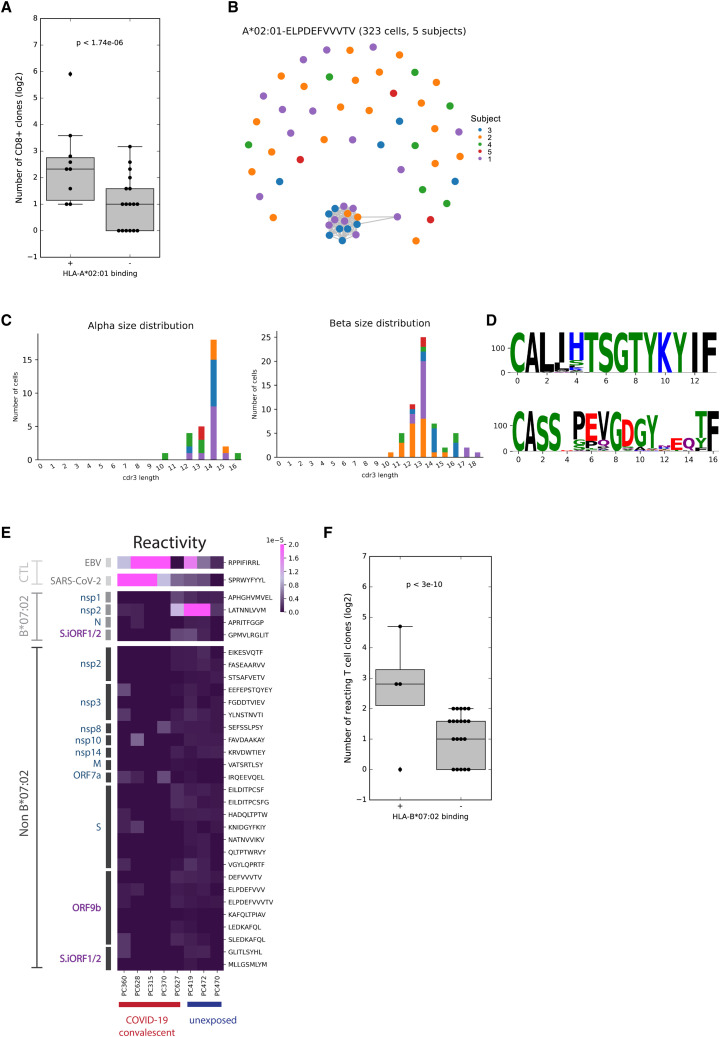
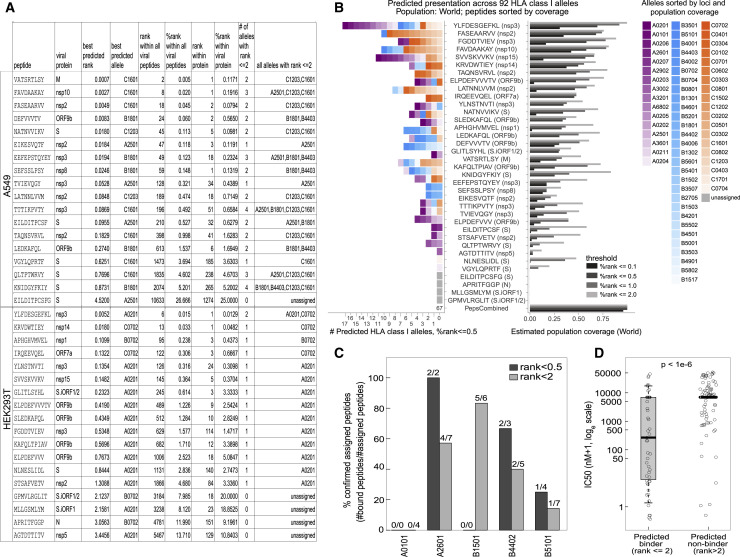
T cell-mediated immunity plays an important role in controlling SARS-CoV-2 infection, but the repertoire of naturally processed and presented viral epitopes on class I human leukocyte antigen (HLA-I) remains uncharacterized. Here, we report the first HLA-I immunopeptidome of SARS-CoV-2 in two cell lines at different times post infection using mass spectrometry. We found HLA-I peptides derived not only from canonical open reading frames (ORFs) but also from internal out-of-frame ORFs in spike and nucleocapsid not captured by current vaccines. Some peptides from out-of-frame ORFs elicited T cell responses in a humanized mouse model and individuals with COVID-19 that exceeded responses to canonical peptides, including some of the strongest epitopes reported to date. Whole-proteome analysis of infected cells revealed that early expressed viral proteins contribute more to HLA-I presentation and immunogenicity. These biological insights, as well as the discovery of out-of-frame ORF epitopes, will facilitate selection of peptides for immune monitoring and vaccine development.

Keywords: HLA Class I; SARS-CoV-2; T Cell response; coronavirus; immunogenicity; out-of-frame ORF immunopeptidomics; viral infection.


Conflict of interest statement

Declaration of interests S.W.-G., S.K., S.S., K.R.C, N.H., S.A.C., J.G.A., M.S., and P.C.S. are named co-inventors on a patent application related to immunogenic compositions of this manuscript filed by The Broad Institute that is being made available in accordance with the COVID-19 technology licensing framework to maximize access to university innovations. D.L.-E., C.T., Y.W., M.R.D., W.A.D., and D.C.P. are employees and stockholders of Repertoire Immune Medicines. N.B. is an extramural member of the Parker Institute for Cancer Immunotherapy; receives research funds from Regeneron, Harbor Biomedical, DC Prime, and Dragonfly Therapeutics; and is on the advisory boards of Neon Therapeutics, Novartis, Avidea, Boehringer Ingelheim, Rome Therapeutics, Roswell Park Comprehensive Cancer Center, BreakBio, Carisma Therapeutics, CureVac, Genotwin, BioNTech, Gilead Therapeutics, Tempest Therapeutics, and the Cancer Research Institute. A.S. is a consultant for Gritstone, Flow Pharma, CellCarta, OxfordImmunotech, Immunoscape, and Avalia. La Jolla Institute for Immunology has filed for patent protection for various aspects of T cell epitope and vaccine design work. D.B.K. has previously advised Neon Therapeutics and has received consulting fees from Neon Therapeutics. D.B.K. owns equity in AduroBiotech, Agenus Inc., Armata Pharmaceuticals, Breakbio Corp., Biomarin Pharmaceutical Inc., Bristol Myers Squibb Com., Celldex Therapeutics Inc., Editas Medicine Inc., Exelixis Inc., Gilead Sciences Inc., IMV Inc., Lexicon Pharmaceuticals Inc., Moderna Inc., and Regeneron Pharmaceuticals. D.B.K. receives SARS-CoV-2 research support from BeiGene for a project unrelated to this publication. N.H. is a founder of Neon Therapeutics, Inc. (now BioNTech US), was a member of its scientific advisory board, and holds shares. N.H. is also an advisor for IFM Therapeutics. S.A.C. is a member of the scientific advisory boards of Kymera, PTM BioLabs, and Seer and a scientific advisor to Pfizer and Biogen. J.G.A. is a past employee and shareholder of Neon Therapeutics, Inc. (now BioNTech US). P.C.S. is a co-founder and shareholder of Sherlock Biosciences and a non-executive board member and shareholder of Danaher Corporation.

Figures

None
Graphical abstract
Figure 1
Figure 1
HLA-I peptidome and whole-proteome measurements in SARS-CoV-2-infected cells (A) Schematic of the experiment and the antigen presentation pathway. (B) Population frequency of the 9 endogenous HLA-I alleles expressed in A549 and HEK293T cells. (C) Length distribution of HLA peptides in infected and naive cells. (D) Motif of 9-mer sequences identified in infected and naive cells. (E) Fraction of observed peptides assigned to alleles using HLAthena prediction (%rank cutoff < 0.5) for the immunopeptidome of infected and uninfected cells. See also Figures S1 and S2 and Table S1.
Figure S1
Figure S1
SARS-CoV-2 infection of HEK293T/ACE2/TMPRSS2 and A549/ACE2/TMPRSS2, related to Figure 1 (A) A549 cells expressing ACE2 and TMPRSS2 were infected with SARS-CoV-2 at MOI of 3 for 3, 6, 12, 18, and 24 hours. Fixed cells were incubated with a fluorescence antibody to the nucleocapsid and DAPI stain was used to label the nuclei. Immunofluorescent images were taken using an EVOS microscope with a 10x lens. Bars show mean ± SD (B) Similar to (A) for HEK293T cells. (C) Plaque assay confirming SARS-CoV-2 inactivation for HLA-IP experiments. A549 cells were infected with SARS-CoV-2 at MOI of 3 for 24 hours. 10-fold serial dilutions were prepared in Opti-MEM and used to infect Vero cells in a 24-wells plate. Comparing plaques in (left) cultured media of infected A549 cells; (middle) SARS-CoV-2 infected A549 cells treated with a lysis buffer containing 1.5% Triton-X and Benzonase for 3 hours; and (right) non-infected A549 cells. When adding the 1:10 dilution of the lysis buffer, infected and non-infected cells died immediately due to the relatively high Triton-X concentration.
Figure S2
Figure S2
Peptide logos and allele assignment for all experiments, related to Figure 1 (A) Logo plots for individual alleles of peptides identified and assigned to cell line specific alleles with HLAthena percentile rank < 0.5 for naive and 24h post Sars-CoV-2 infected A549 (left) and HEK293 (right) cells. (B) Peptide logo plots aggregated over all alleles for label free time course experiments in A549 and HEK293 samples. (C) Allele assignment for peptides identified in time course experiments using HLAthena with a percentile rank < 0.5 cutoff. (D) Expression level of HLA-A, -B, and -C alleles as measured by RNA-seq in A549 and HEK293T cell lines pre- and 24hr post-infection. (E) All 9-mer peptides tiled along human protein sequences were predicted for binding to the HLA alleles present in HEK293T (top) and A549 (bottom) cell lines. Per allele, the fraction of those 9-mers with predicted binding scores that are better than 50% of previously identified known binders in mono-allelic experiments for the allele is shown.
Figure 2
Figure 2
SARS-CoV-2 HLA-I immunopeptidome and whole proteome (A) Summary of peptide location across the SARS-CoV-2 genome from the HLA-I immunopeptidome, whole proteome, and predictions. (B) Biochemical binding of HLA-I peptides to purified major histocompatibility complexes (MHCs). Shown are the fractions of peptides that were confirmed to bind the assigned alleles (half maximal inhibitory concentration [IC50] < 500 nM; Table S2). (C) SARS-CoV-2 protein abundance in A549 and HEK293T cells 24 hpi. iBAQ, intensity-based absolute quantification. (D and E) Comparison of our protein abundance measurements 24 hpi and Ribo-seq (Finkel et al., 2020b) in A549 (D) and HEK293T (E) cells. (F) HLA-I presentation potential of SARS-CoV-2 ORFs in A549 cells. ORFs were ranked according to the ratio between the number of peptides predicted to bind any of the six HLA-I alleles in A549 and the total number of 8- to 11-mers. (G) Similar to (F) for HEK293T cells. (H) Presentation potential across 92 HLA-I alleles, shown as boxplots (median ratio, whiskers reach to lowest and highest values no further than 1.5× interquartile range [IQR] of the ratio between the number of peptides predicted to bind each allele and total number of peptides). SARS-CoV-2 ORFs are ranked by the median across HLA-I alleles. See also Tables S2 and S3.
Figure 3
Figure 3
HLA-I peptides dynamics in SARS-CoV-2-infected cells (A and B) Dynamics of TMT-labeled HLA-I peptides 3, 6, 12, 18, and 24 hpi in A549 (A) and HEK293T cells (B). TMT intensity values of peptides detected in two independent experiments (3, 6, and 24 hpi and 12, 18, and 24 hpi) were normalized to the respective abundance at 24 h present in both experiments. Dashed lines indicate detection in the 3|6|24-h plex only. (C) Dynamics of SARS-CoV-2 protein expression according to whole-proteome analysis. (D) Venn diagram showing SARS-CoV-2 proteins according to their earliest expression time and the source proteins for HLA-I-presented peptides in A549 and HEK293T cells. The hypergeometric p value represents the enrichment of early-expressed proteins (3 hpi) in the group of proteins presented on HLA-I. (E) CD8+ responses to early/late-expressed SARS-CoV-2 proteins in convalescent COVID-19 individuals according to a recent study. The box shows the quartiles, the bar indicates median, and the whiskers show the distribution (see Table S3 in Tarke et al., 2020).
Figure S3
Figure S3
SARS-CoV-2 peptide abundance and antigen presentation pathway proteins in infected cells, related to Figure 4 (A) Table showing the percentage of the total whole proteome abundance represented by SARS-CoV-2 derived proteins at 0, 3, 6, 12, 18, 24hpi identified in singleshot whole proteome LC-MS/MS analyses. (B) Rank plot of the protein abundances represented by log10 protein iBAQ values for each human (gray), canonical SARS-CoV-2 (blue), and noncanonical SARS-CoV-2 proteins detected in the whole proteome analysis of HEK293T cells 24hpi. SARS-CoV2 proteins are annotated with their respective gene names. (C) Similar rank plot to (A) but for observed HLA-I peptides and their abundances represented by log2 peptide intensities in HEK293T cells 24hpi. Peptides mapping to SARS-CoV-2 are annotated with their respective amino acid sequence and source protein name. (D) Heatmap of log10 iBAQ values for antigen presentation pathway proteins observed across uninfected and 24hpi in A549 and HEK293T cells. (E) Volcano plot comparing protein levels across uninfected and infected A549/ACE2 cells 6hpi reported in publically available whole proteome data (PXD020019). Proteins from SARS-CoV-2 (red), ubiquitination pathways (teal), proteasomal function (purple), antigen processing (pink), and IFN pathways (orange) are colored accordingly. Significantly changing proteins are shown above the dashed line (p value < 0.01) along with annotations of specific proteins involved in the above pathways.
Figure 4
Figure 4
The effect of SARS-CoV-2 infection on antigen presentation in host cells (A) Rank plot of protein abundances (log10 protein iBAQ) from human and SARS-CoV-2 detected in the whole-proteome analysis. (B) Similar rank plot as in (A) but for observed HLA-I peptide abundance (log2 intensity). (C) Venn diagram showing the overlap between total HLA-I peptides in uninfected and infected A549 cells. (D) Expression heatmap of central antigen presentation pathway proteins in uninfected and infected cells (24 hpi). (E) Volcano plot comparing protein levels in uninfected and infected A549 and HEK293T cells 24 hpi (dashed line, p < 0.01, moderated t test). (F) Similar to (E); a volcano plot representing whole-proteome data from A549/ACE2 cells 24 hpi (Stukalov et al., 2020). See also Figure S3 and Table S4.
Figure 5
Figure 5
SARS-CoV-2 HLA-I peptides from S.iORF1/2 and ORF9b (A) HLA-I peptides derived from S.iORF1/2. Underscored methionines (M) represent the start codons of S.iORF1 and S.iORF2. (B) HLA-I peptides derived from ORF9b (N.iORF1) and N.iORF2. (C) Mirror plots with fragment ion mass spectra confirming the sequences of four HLA-I peptides that were identified in S.iORF1/2 and ORF9b (positive y axis, HLA IP samples; negative y axis, synthetic peptide). (D) Biochemical HLA-A02:01/peptide binding measurements. The concentration of peptide yielding 50% inhibition of the binding of the radiolabeled A02:01 ligand (IC50) was used to calculate peptide affinity. (E) The effect of human codon optimization on HLA-I peptides derived from S.iORF1/2. Shown is Needleman-Wunsch pairwise global alignment between the SASR-CoV-2 sequence (NC_045512.2) and the human optimized S from the Krogan library (Gordon et al., 2020) in the S.iORF1/2 coding region. Purple boxes indicate the position of the HLA-I peptides in the out-of-frame ORFs. (F) similar to (E) but for N in the ORF9b coding region.
Figure 6
Figure 6
T cell responses to SARS-CoV-2 HLA-I peptides (A) Five HLA-A2 transgenic mice were immunized with a pool of nine HLA-I peptides detected on A02:01 in HEK293T cells for 10 days. Splenocytes were incubated with individual peptides and monitored for IFNγ secretion. HLA-A02:01 restricted HIV-Gag peptide and non-stimulated wells were used as negative controls. Anti-CD3 and phytohemagglutinin (PHA) were used as positive controls. The dashed line represents the threshold for positive responses (3× the median of the HIV-Gag). The box shows the quartiles, the bar indicates median, and the whiskers show the distribution. (B) ELISpot images from one of the five vaccinated mice. Numbers indicate the spot count. (C) PBMCs from convalescent COVID-19 individuals expressing A02:01 alleles were incubated with a pool of HLA-I peptides from canonical or out-of-frame ORFs. A pool of 102 peptides tiling the entire nucleocapsid (N) protein that was evaluated in the same samples (Gallagher et al., 2021) served as positive control. Bars show the mean of duplicates. (D) ELISpot images of individuals #1 and #3. Numbers indicate the spot count. (E) Illustration of the multiplexed tetramer assay and T cell single-cell profiling. (F) CD8+ T cell reactivity detected in convalescent COVID-19 individuals and unexposed subjects expressing A02:01 to individual HLA-I peptides. The score in the heatmap indicates the fraction of peptide-specific reacting T cells from total CD8+ cells in the sample. (G) Single-cell transcriptomics of reactive T cells. Top panel: uniform manifold approximation and projection (UMAP) embedding of all tetramer-positive cells colored by unsupervised clustering. Center panel: expression levels of 15 genes associated with different states of T cells, as characterized previously (Su et al., 2020). Bottom panel: expression level of these 15 genes in individual T cells reactive to ELPDEFVVVTV peptide from ORF9b. See also Figure S4 and Table S5.
Figure S4
Figure S4
CD8+ responses to HLA-I peptides in individuals with COVID-19 and TCR homology in ELPDEFVVVTV-reactive T cells, related to Figure 6 (A) The number of unique CD8+ T cell clones reacting to HLA-I peptides that were found to bind HLA-A02:01 in biochemical binding measurement and HLA-I peptides that did not bind HLA-A02:01. Wilcoxon rank-sum p value is indicated. The box shows the quartiles, bar indicates median and the whiskers show the distribution. (B) Network plot showing the relationship of unique clonotypes within and across subjects. Clonotypes, shown as nodes, are connected to other clonotypes with similar alpha or beta CDR3 with edges (scirpy v0.6.0). (C) CDR3 size distributions for alpha and beta TCR chains. (D) TCR α/β-paired sequence logo for related clonotypes represented in the interconnected cluster at the bottom of the network shown in (B). (E) CD8+ T cell reactivity detected in convalescent COVID-19 patients and unexposed subjects expressing B07:02 to individual peptides that bind HLA-B07:02 or other alleles. The score in the heatmap indicates the fraction of peptide-specific reacting T cells from total CD8+ T cells in the sample. (F) Similar to (A) for HLA-B07:02.
Figure 7
Figure 7
Presentation prediction and population coverage estimates of MS-identified SARS-CoV-2 HLA-I peptides (A) Summary of LC-MS/MS-identified SARS-CoV-2 epitopes with corresponding HLAthena predictions for the 6 HLA-I alleles expressed by A549 cells and the 3 HLA-I alleles in HEK293T cells. (B) HLAthena predictions for 92 HLA-I alleles. Left: the number of unique HLA-I alleles predicted as strong binders. Right: estimated population coverage. Alleles are colored and ordered according to loci and world population frequency (high to low color intensity). (C) Biochemical binding measurements of HLA-I peptides and five HLA alleles that were not profiled in our cell lines. Shown are the fractions of peptides that were confirmed to bind the predicted alleles (IC50 < 500 nM; Table S2). (D) IC50 nM affinity measurements of HLA-I peptides for nine alleles separated by predicted binders (%rank < 2) and predicted non-binders (%rank ≥ 2) (Welch Two Sample t test, data are presented as median, whiskers reach to lowest and highest values no further than 1.5× IQR). See also Figure S5 and Table S6.
Figure S5
Figure S5
Population coverage estimates of LC-MS/MS-identified SARS-CoV-2 HLA-I peptides, related to Figure 7 HLAthena predictions for 92 HLA-I alleles using percentile rank cutoff values of 0.1, 0.5, 1, and 2% were used to show the number of alleles and estimated coverage for each LC-MS/MS-observed SARS-CoV-2 peptides across (A) AFA, (B) API, (C) EUR, (D) HIS, and (E) USA populations. Alleles are colored and ordered according to loci and the corresponding population frequency (high to low color intensity). Peptides are ordered according to their estimated coverage at %rank cutoff of 0.5.
Figure S6
Figure S6
HLA-I peptide sequences in B.1.1.7, P.1, and B.1.351 SARS-CoV-2 variants, related to Figure 6 (A) The sequence of the HLA-I peptides detected in our study were used as tblastn queries against a database containing early representative genomes of SARS-CoV-2 lineages with the pango designations B.1.1.7 (29 genomes), P.1 (14 genomes), and B.1.351 (23 genomes); see GISAID acknowledgment table for accessions (Table S8). Identity scores for each peptide in each variant are shown in the heatmap. (B,C) Mutations in the S.iORF1/2 region of B.1.351 (B) and B.1.1.7 (C) variants in comparison to the SARS-CoV-2 RefSeq sequence NC_045512.2 isolated from Wuhan. The position of the three HLA-I peptides is indicated.

References

    1. Abelin J.G., Keskin D.B., Sarkizova S., Hartigan C.R., Zhang W., Sidney J., Stevens J., Lane W., Zhang G.L., Eisenhaure T.M., et al. Mass Spectrometry Profiling of HLA-Associated Peptidomes in Mono-allelic Cells Enables More Accurate Epitope Prediction. Immunity. 2017;46:315–326. - PMC - PubMed
    1. Altman J.D., Davis M.M. MHC-Peptide Tetramers to Visualize Antigen-Specific T Cells. Curr. Protoc. Immunol. 2016;115:17.3.1–17.3.44. - PubMed
    1. Altmann D.M., Boyton R.J. SARS-CoV-2 T cell immunity: Specificity, function, durability, and role in protection. Sci. Immunol. 2020;5:eabd6160. - PubMed
    1. Aran D., Looney A.P., Liu L., Wu E., Fong V., Hsu A., Chak S., Naikawadi R.P., Wolters P.J., Abate A.R., et al. Reference-based analysis of lung single-cell sequencing reveals a transitional profibrotic macrophage. Nat. Immunol. 2019;20:163–172. - PMC - PubMed
    1. Bassani-Sternberg M., Gfeller D. Unsupervised HLA Peptidome Deconvolution Improves Ligand Prediction Accuracy and Predicts Cooperative Effects in Peptide-HLA Interactions. J. Immunol. 2016;197:2492–2499. - PubMed

Publication types

MeSH terms