. 2021 Jul 22;184(15):4032-4047.e31.
doi: 10.1016/j.cell.2021.05.038. Epub 2021 Jun 24.

Pharmacologic modulation of RNA splicing enhances anti-tumor immunity

Affiliations

Pharmacologic modulation of RNA splicing enhances anti-tumor immunity

Sydney X Lu et al. Cell. .

Abstract

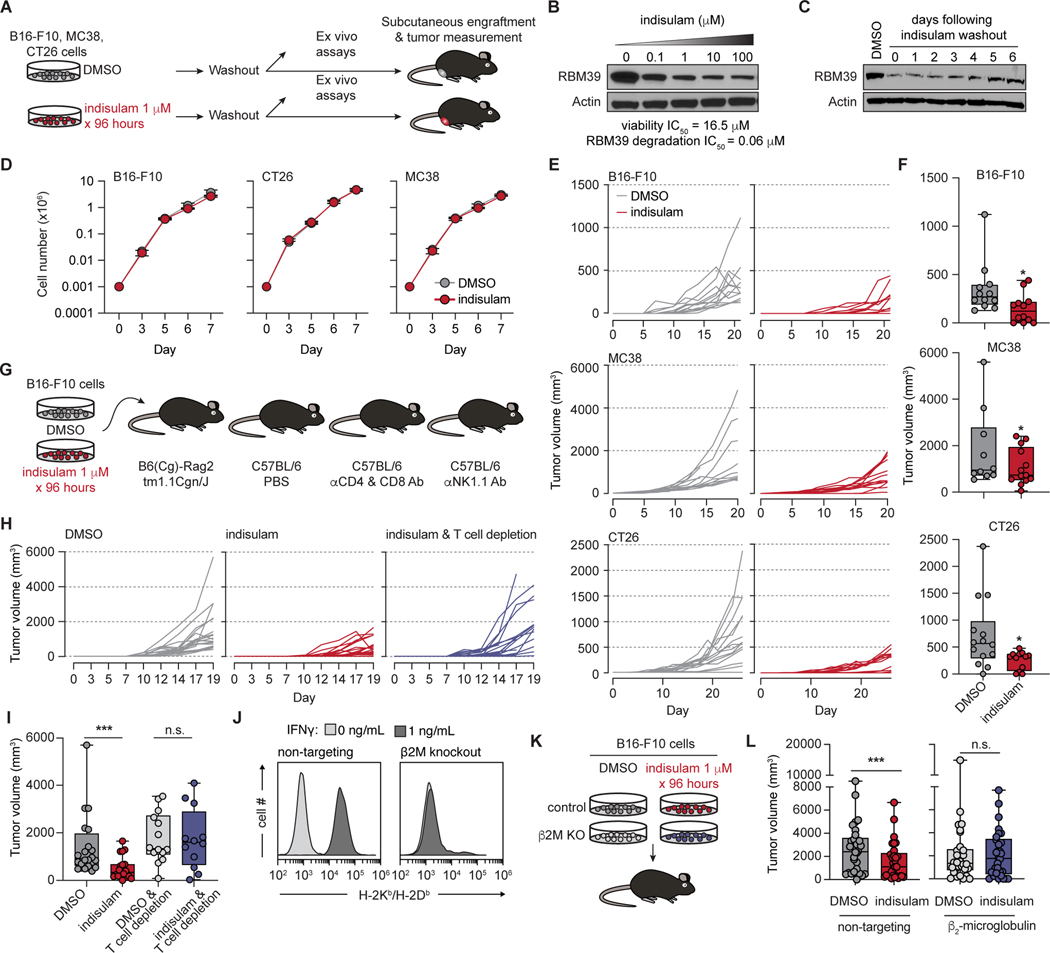
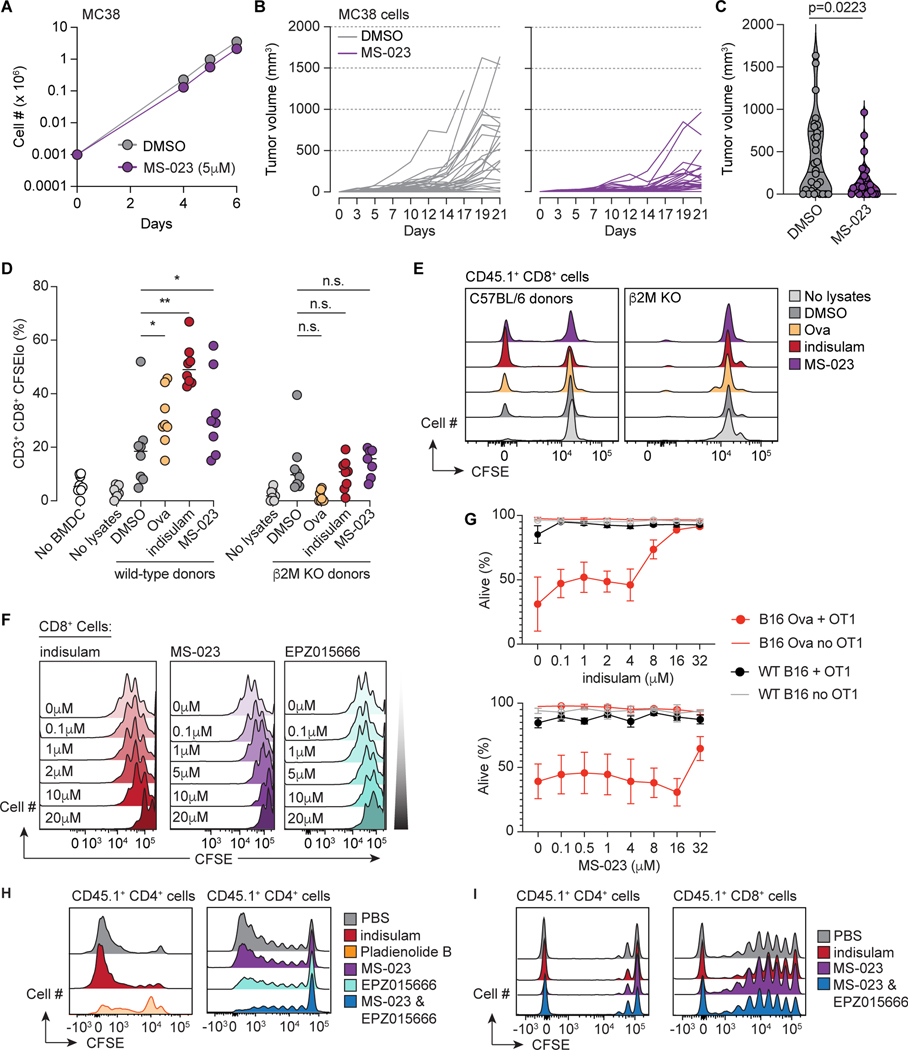
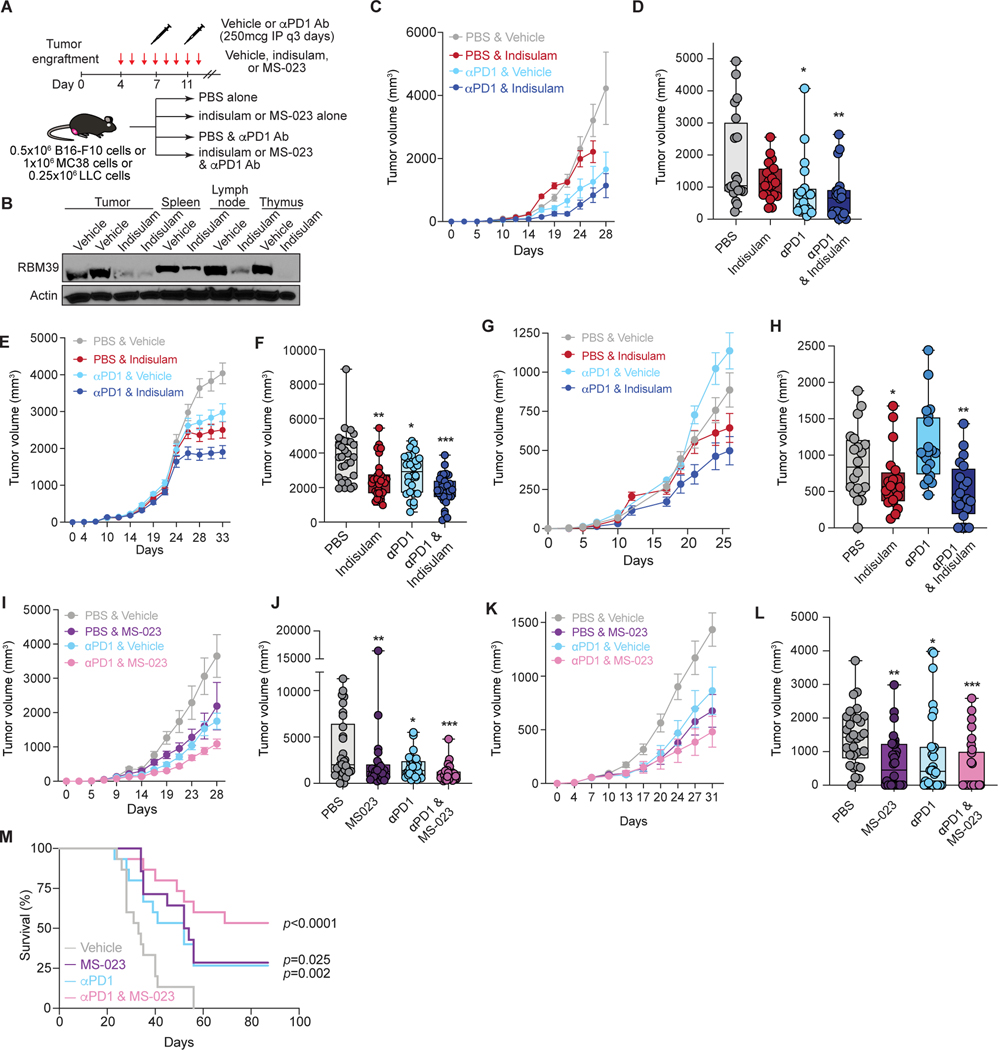
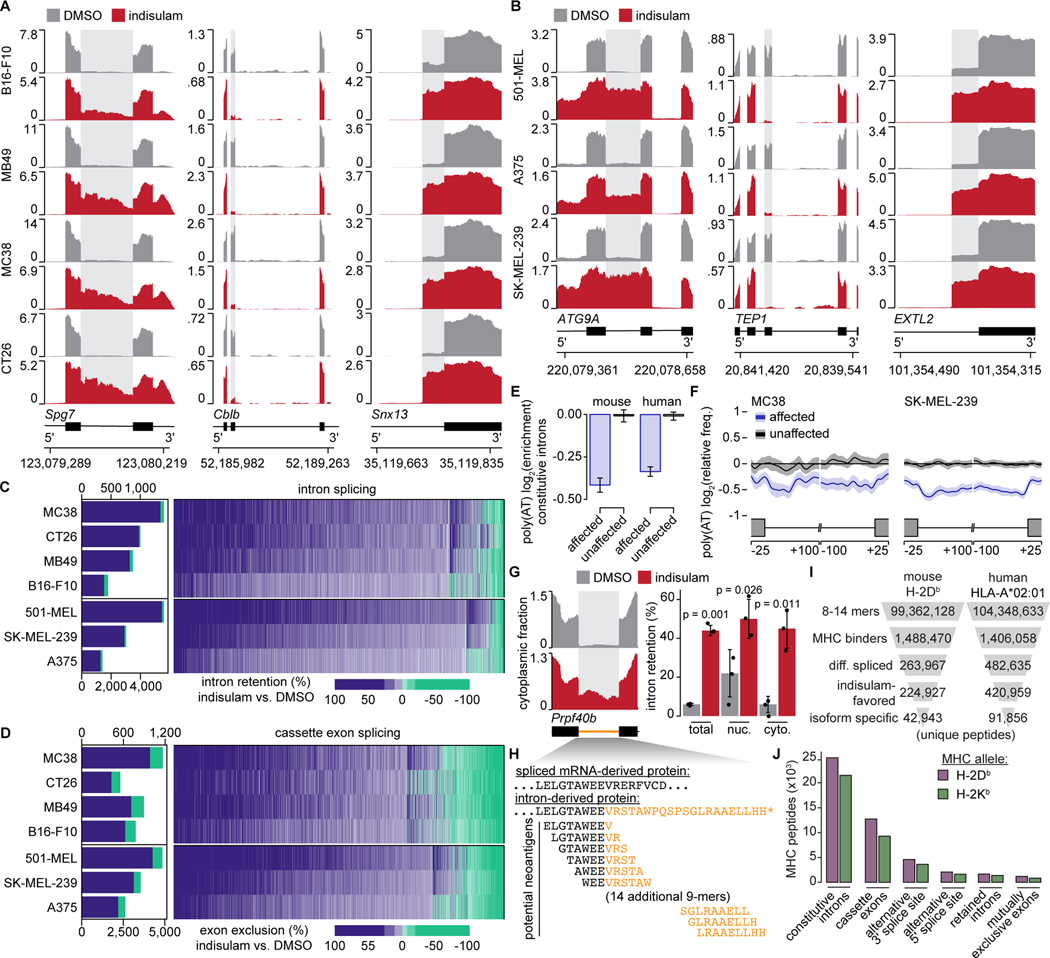
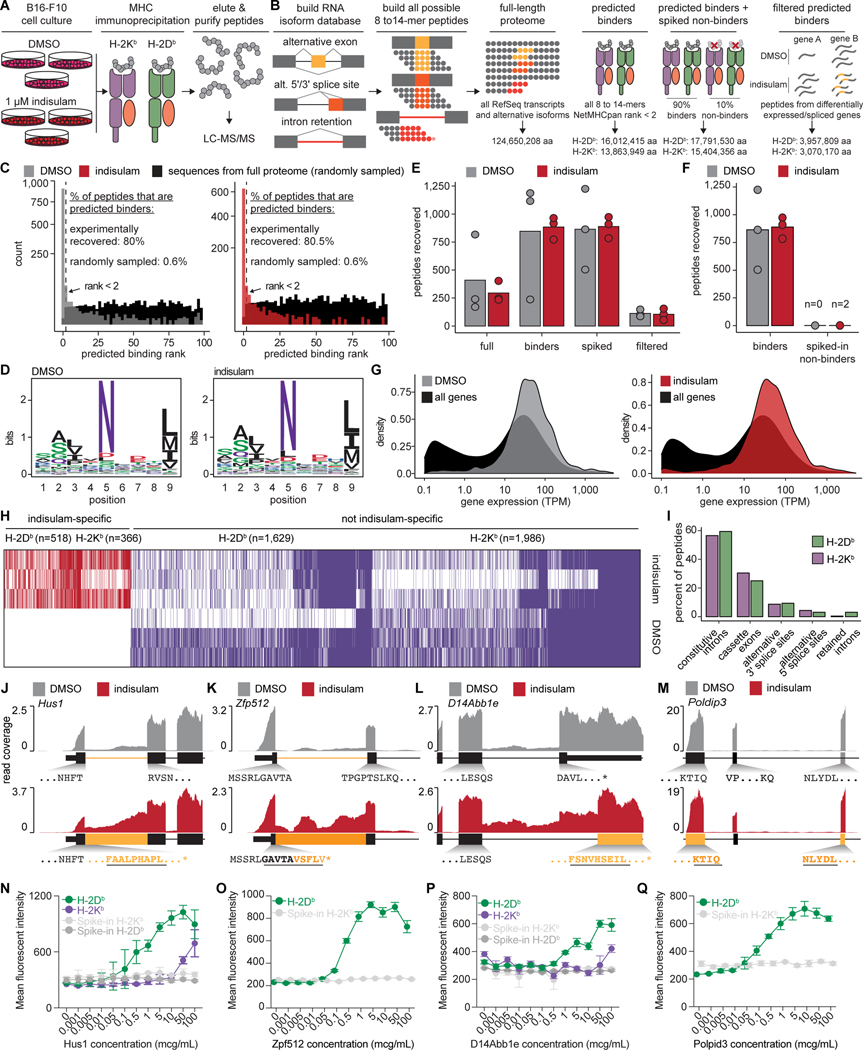
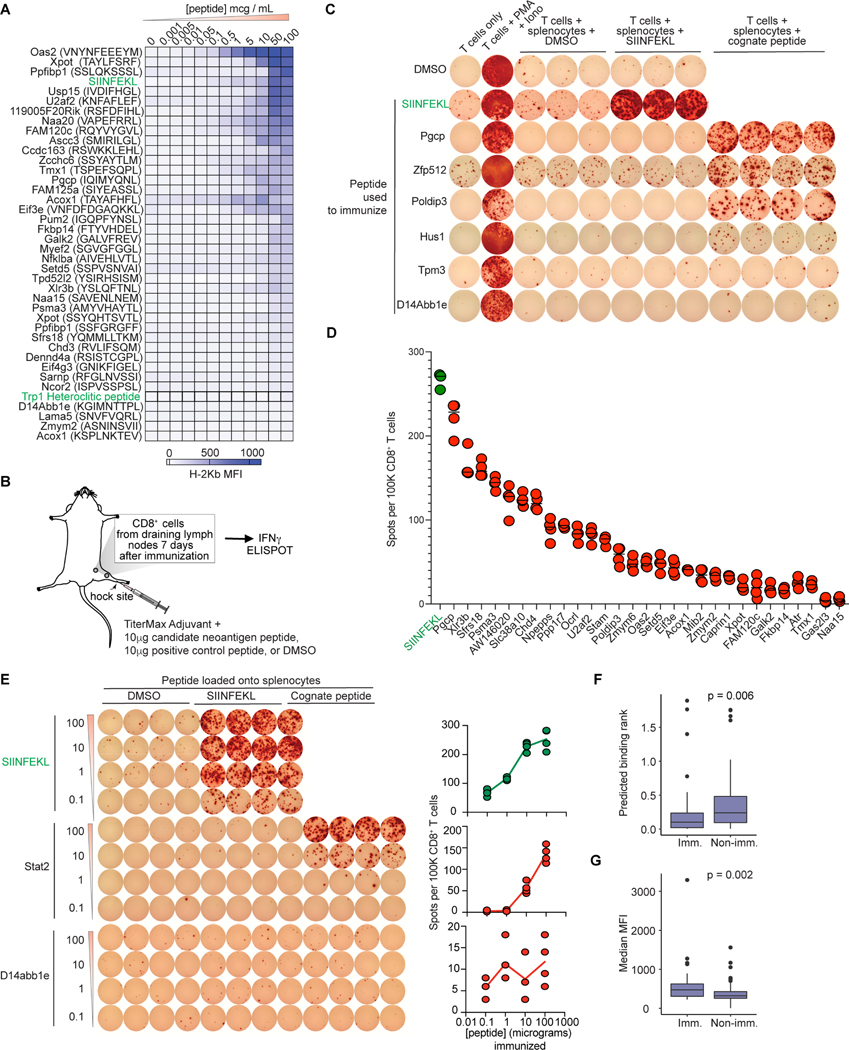
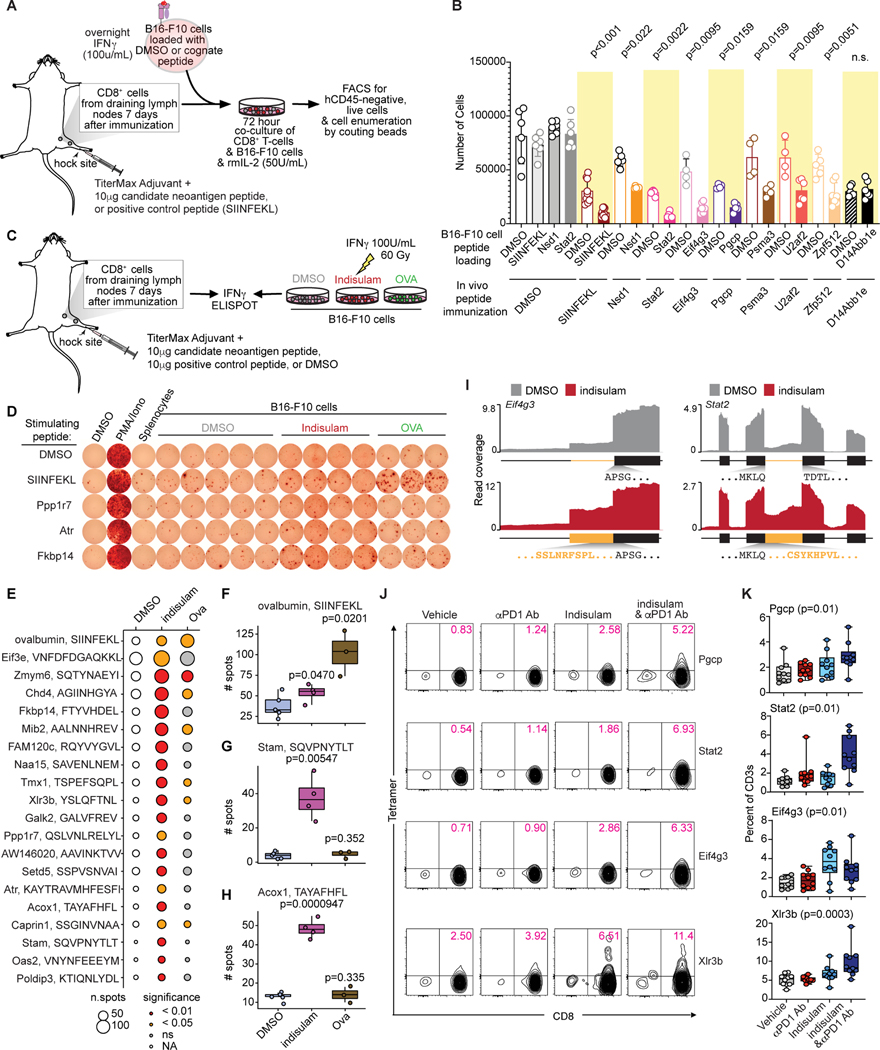
Although mutations in DNA are the best-studied source of neoantigens that determine response to immune checkpoint blockade, alterations in RNA splicing within cancer cells could similarly result in neoepitope production. However, the endogenous antigenicity and clinical potential of such splicing-derived epitopes have not been tested. Here, we demonstrate that pharmacologic modulation of splicing via specific drug classes generates bona fide neoantigens and elicits anti-tumor immunity, augmenting checkpoint immunotherapy. Splicing modulation inhibited tumor growth and enhanced checkpoint blockade in a manner dependent on host T cells and peptides presented on tumor MHC class I. Splicing modulation induced stereotyped splicing changes across tumor types, altering the MHC I-bound immunopeptidome to yield splicing-derived neoepitopes that trigger an anti-tumor T cell response in vivo. These data definitively identify splicing modulation as an untapped source of immunogenic peptides and provide a means to enhance response to checkpoint blockade that is readily translatable to the clinic.

Keywords: PD1; PRMTs; RBM39; RNA splicing; immune checkpoint blockade; immunopeptidome; immunotherapy; neoantigens; neoepitopes; splicing.


Conflict of interest statement

Declaration of interests O.A.-W. has served as a consultant for H3B Biomedicine, Foundation Medicine, Merck, Prelude Therapeutics, and Janssen, and is on the scientific advisory board of Envisagenics, Pfizer Boulder, and AIChemy. O.A.-W. has received prior research funding from Loxo Oncology and H3 Biomedicine unrelated to this work. S.X.L. has served as a consultant (uncompensated) for PTC Therapeutics. B.R. has served as a consultant for Bayer and Roche. D.Z. reports clinical research support to his institution from Astra Zeneca, Plexxikon, and Genentech and personal/consultancy fees from Merck, Synlogic Therapeutics, Tesaro, Bristol Myers Squibb (BMS), Genentech, Xencor, Memgen, Calidi Biotherapeutics, and Agenus. L.A.D. is a member of the board of directors of Personal Genome Diagnostics (PGDx) and Jounce Therapeutics. L.A.D. is a compensated consultant to PGDx, 4Paws (PetDx), Innovatus CP, Se’er, Delfi, Kinnate, and Neophore. L.A.D. is an uncompensated consultant for, but has received clinical trial support from, Merck. L.A.D. holds equity in PGDx, Jounce, Se’er, Delfi, Kinnate, and Neophore and divested equity in Thrive Earlier Detection in 2021. His spouse holds equity in Amgen. J.D.W. is a consultant for Amgen, Apricity, Arsenal IO, Ascentage Pharma, AstraZeneca, Astellas, Boehringer Ingelheim, BMS, Chugai, Dragonfly, F Star, Eli Lilly, Georgiamune, IMVAQ, Merck, Polynoma, Psioxus, Recepta, Trieza, Truvax, Sellas, and Werewolf Therapeutics. J.D.W. has grant/research support from BMS and Sephora. J.D.W. reports equity in Tizona Pharmaceuticals, Imvaq, Beigene, Linneaus, Apricity, Arsenal IO, and Georgiamune. T.M. is an inventor on patents involving the use of anti-PD-1 antibodies. T.M. is a consultant for Immunos Therapeutics and Pfizer. T.M. is a cofounder of and equity holder in IMVAQ. T.M. receives research funding from BMS, Surface Oncology, Kyn Therapeutics, Infinity Pharmaceuticals, Peregrine Pharmaceuticals, Adaptive Biotechnologies, Leap Therapeutics, and Aprea Therapeutics. S.X.L., O.A.-W., and R.K.B. are inventors on a patent application submitted by FHCRC related to this work.

Figures

Figure 1.
Figure 1.. Pharmacologic RNA splicing modulation impairs tumor growth in a manner dependent on immune recognition.
(A) Schema of drug treatment and washout. (B) Western blot of RBM39 in B16-F10 cells after 24h of indisulam treatment. IC50, half-maximal inhibitory concentration. (C) As (B), but with 4 days of 1μM indisulam, then drug washout and continued culture in vitro. (D) Cell growth following 4 days of DMSO or indisulam 1μM, and drug washout (day 0) in vitro. Mean ± sd. (E) In vivo tumor volumes of cells from (D). Each line is an individual tumor (n=10/group, tumors on both flanks). (F) Box-and-whisker plots of tumor volumes from final day of measurement in (E). For box and whiskers plots throughout, bar indicates median, box edges first and third quartiles, and whiskers minimum & maximum. p from Wilcoxon rank-sum test. (G) Schema of drug treatment and engraftment in mice with immune perturbations. (H) Individual B16-F10 tumor volumes following DMSO or indisulam treatment and engraftment in mice with control vs. T cell depletion. Each line is one tumor (n=10/group). (I) Tumor volumes from (H) at day 19; p from Wilcoxon rank-sum test: ***, p = 0.000379; n.s., p > 0.05. (J) H-2Kb/Db expression of control vs. B2m KO B16-F10 cells ± IFNγ. (K) Schema to evaluate requirement of β2M for tumor control in vivo. (L) Individual tumor volumes at day 30 from (K); p from Wilcoxon rank-sum test: ***, p = 0.009; n.s., p > 0.05. See also Figure S1.
Figure 2.
Figure 2.. Pharmacologic splicing modulation promotes T cell reactivity without T cell toxicity in vivo.
(A) In vitro growth of MC38 cells following treatment with DMSO or MS-023 for 96 hours and drug washout. Mean ± sd shown. (B) In vivo growth of cells from (A) in C57BL/6 mice; individual tumor volumes shown (n=10/group). (C) Tumor volumes at day 21 from (B). p from Wilcoxon rank-sum test. (D) Percentage of live donor CD8+CFSElo T cells on day 5 of a mixed leukocyte reaction with BMDC from wild-type or B2m KO C57BL/6 mice. Each dot is a technical replicate. Bar represents median. ‘No lysates’: T cells cultured with BMDC and without lysate. p from Wilcoxon rank-sum test. For wild-type BMDCs, DMSO-vs-Ova p = 0.019, vs. indisulam p = 0.001, vs. MS-032 p = 0.032. (E) Representative histograms of CFSE dilution from (D). (F) CFSE-labeled naïve splenic T cells from C57BL/6 mice stimulated with anti-CD3 & CD28 for three days. (G) Wild-type or ovalbumin-expressing B16-F10 cells were cultured alone or with primed OT-1 T cells for 18h and viable tumor cells enumerated. (H) CFSE dilution of donor CD45.1+ T cells adoptively transferred into irradiated Balb/c recipients treated with the indicated compounds. Donor splenic CD4+ T cells on day 3. (I) As (H), but in LP/J recipients; donor splenic T cells on day 5. See also Figure S2.
Figure 3.
Figure 3.. Splicing modulation enhances checkpoint immunotherapy.
(A) Treatment schema. (B) Western blot of RBM39 in B16-F10 and immune organs of mice treated with vehicle vs. indisulam for 10 days. (C) B16-F10 tumor volumes in mice treated with vehicle, indisulam, anti-PD1, or both (n=10/group). Mean ± sem. Termination of line before day 28 indicates all animals had reached endpoints. (D) Data from (C) at day 26; p from Wilcoxon rank-sum test vs. PBS; *, p = 0.002; **, p = 0.000581. p indisulam vs. ± PD1 = 0.004. (E) As (C), but for MC38 tumor-bearing mice (n=10/group). (F) Data from (E) at day 31; p as above. *, p = 0.004; **, p = 0.0000682; ***, p = 0.000000101. p indisulam vs. ± PD1 = 0.04. (G) As (C), but for LLC tumor-bearing mice (n=10/group). (H) Data from (G) at day 26. p as above. *, p = 0.048; **, p = 0.004. p indisulam vs. ± PD1 = 0.125. (I) Tumor volumes of B16-F10 tumor-bearing mice treated with vehicle, MS-023, anti-PD1, or both (n=10/group). Mean ± sem. (J) Data from (I) at day 28; p as above. *, p = 0.023; **, p = 0.013; ***, p = 0.0000153. p MS-023 vs. ± PD1 = 0.056 (K) As (I), but for MC38 tumor-bearing mice. (L) Data from (I) at day 31; p as above. *, p = 0.001; **, p = 0.000342; ***, p = 0.00000821. p MS-023 vs. ± PD1 = 0.101. (M) Kaplan-Meier survival from (I). All survivors past day 60 were tumor-free. p from logrank test vs. vehicle. See also Figures S3–4.
Figure 4.
Figure 4.. Splicing modulation induces widespread potential neoepitope production.
(A) RNA-seq read coverage illustrating shared intron retention (left), cassette exon exclusion (middle), and competing 3’ splice site selection (right) induced by indisulam in mouse and (B) human cancer cell lines. Conditions as in Fig. 1A. (C) Left, stacked bar graph illustrating numbers of differentially retained introns following indisulam treatment. Blue/green, increased/decreased intron retention in indisulam vs. DMSO; percentages shown for blue. Right, heat map illustrating quantitative extent of intron retention for introns significantly mis-spliced in at least one sample. (D) As (C), but for cassette exons. (E) Bar graph of poly(AT) motif enrichment in introns preferentially retained vs. unaffected upon indisulam treatment. Motif enrichment computed relative to a randomly selected group of unaffected introns. Error bars, 95% confidence intervals estimated by bootstrapping. (F) Metagene plot of poly(AT) enrichment across introns that were preferentially retained or unaffected following indisulam treatment. Shading, 95% confidence intervals estimated by bootstrapping. (G) Left, RNA-seq read coverage illustrating Prpf40b intron retention in the cytoplasmic fraction following indisulam treatment of B16-F10. Right, quantification of Prpf40b intron retention in total, nuclear (nuc.), and cytoplasmic (cyto.) fractions. p from unpaired t-test. (H) Predicted 9-mer peptides arising from indisulam-induced Prp40b intron retention. Black/blue, exon/intron-derived amino acids. (I) Filtering strategy to predict potential indisulam-induced, MHC I-bound epitopes. Numbers of unique peptides present at each step are shown for representative MHC I alleles following DMSO or indisulam treatment of B16-F10 and 501-MEL cells. (J) Bar graph illustrating numbers of predicted indisulam-induced 8–14-mer peptides arising from different splicing events following DMSO or indisulam treatment of B16-F10 cells. All analyses performed for n=3 biological replicates for each cell line and treatment unless specified otherwise. See also Figure S5 and Tables S1–5.
Figure 5.
Figure 5.. Indisulam-induced neopeptides are presented by MHC I.
(A) Workflow overview. (B) Schematic for RNA isoform and proteome database creation. (C) Histogram of predicted NetMHCpan binding rank of all peptides identified from the H-2Db immunoprecipitation (IP) and full-length proteome. Peptides with rank < 2 are predicted binders. Peptides identified in DMSO-treated (gray, left) and indisulam-treated (red, right) samples are overlaid on a random sample of 1,000 sequences from the full-length proteome (black) for comparison. (D) Sequence logo for 9-mers identified from the H-2Db IP and full-length proteome. (E) Bar plot of numbers of peptides identified from the H-2Db IP using each proteome in (B). (F) Bar plot of numbers of predicted binders and non-binders identified from H-2Db IP using the spiked non-binders proteome, which consists of predicted binders (rank < 2) composing 90% of this proteome, and non-binders (rank > 90), added to constitute 10% of the proteome. (G) Density plots of parent gene expression for peptides identified from the H-2Db IP from DMSO-treated (gray, left) and indisulam-treated (red, right) samples, each compared to the expression of all genes (black) following treatment with DMSO or indisulam, respectively, using the predicted binders proteome. TPM, transcripts per million. (H) Heat map illustrating each peptide identified in at least one replicate (rows) using the predicted binders proteome. Columns are peptides. (I) Bar plot illustrating percentages of indisulam-specific, isoform-specific identified peptides arising from different types of alternative splicing. (J) RNA-seq coverage plots of representative indisulam-induced, candidate splicing-derived neoepitopes generated by intron retention in Hus1 and (K) Zfp512, (L) competing 3’ splice sites in D14Abb1e, and (M) cassette exon skipping in Poldip3. Indisulam-promoted peptide shown in bold, underlined text. (N) Median fluorescence intensities (MFIs) of H-2Db and/or H-2Kb on RMA-S cells following incubation with increasing doses of Hus1, (O) Zfp512, (P) D14Abb1e, and (Q) Poldip3 candidate neoantigenic peptides from (J-M). Mean ± sd shown. For (N-Q), grey lines indicate negative control peptides randomly selected from the predicted non-binder, “spike-in” peptides used in (B). All analyses performed for n=3 biological replicates for each treatment for (A-M) and n=4 biological replicates for (N-Q). For (C-D) and (G), data collated across n=3 replicates per treatment. See also Figure S6 and Table S6.
Figure 6.
Figure 6.. Splicing-derived neoepitopes are immunogenic in vivo.
(A) Heatmap representing mean MFI of H-2Kb from RMA-S assay. Green, immunogenic controls. (B) Immunization schema. (C) Representative IFNγ ELISpot from CD8+ T cells upon stimulation with syngeneic peptide-loaded splenocytes. Each row is a peptide used for in vivo immunization. Columns, T cells reacted with the indicated stimuli. PMA: Phorbol 12-myristate 13-acetate; Iono: ionomycin. (D) Spots per 105 CD8+ T cells from IFNγ ELISpot for peptides identified as immunogenic. Bar indicates median. SIINFEKL, positive control. Each dot is one technical replicate. (E) Representative IFNγ ELISpot of CD8+ T cells from immunized mice, following stimulation with syngeneic peptide-loaded splenocytes. Each row is one dose. Columns, T cells reacted with the indicated stimuli. Plots on right quantify numbers of dots per well; each dot is one technical replicate. (F) Comparisons of predicted MHC I binding for immunogenic (IFNγ ELISpot-positive) versus nonimmunogenic peptides. (G) As (F), but with RMA-S MFIs. For (F-G), p from two-sided Wilcoxon rank-sum test. See also Figure S7 and Table S7.
Figure 7.
Figure 7.. Splicing-derived neoantigens trigger an endogenous T cell response.
(A) Schema of co-culture of CD8+ T cells from peptide-immunized C57BL/6 mice with peptide-loaded B16-F10 cells for cytotoxicity. (B) Bar plot of live B16-F10 cells from (A). Each dot is a technical replicate. p from Wilcoxon rank-sum test. (C) Schema of CD8+ T cells from peptide-immunized C57BL/6 mice, stimulated with B16-F10 cells treated with DMSO or indisulam for IFNγ ELISpot. (D) Representative IFNγ ELISpot from CD8+ T cells following stimulation with DMSO or indisulam-treated B16-F10 cells, or B16-F10 cells overexpressing ovalbumin. Rows, peptides used for immunization. (E) Bubble plot of data from (C-D); size of bubble indicates number of spots. p from Wilcoxon rank-sum test. (F-H) Box-and-whisker plots for representative peptides from (E). Each dot is one technical replicate. p from Wilcoxon rank-sum test. (I) RNA-seq coverage plots demonstrating mis-splicing of Eif4g3 (left) and Stat2 (right) upon indisulam exposure and the resulting neoantigenic peptides. (J) Representative plots of peptide:MHC I tetramer staining of CD8+ T cells from tumor-draining lymph nodes of B16-F10 tumor-bearing mice treated with vehicle, anti-PD1, indisulam, or the combination and analyzed at day 14, gated on CD3+ T cells. Each row is one neoantigenic peptide, and columns indicate treatment condition. (K) Quantification of (J); each dot is one mouse. p from Kruskal-Wallis ANOVA. See also Figure S7 and Table S7.

Comment in

Similar articles

Cited by

References

    1. Abelin JG, Keskin DB, Sarkizova S, Hartigan CR, Zhang W, Sidney J, Stevens J, Lane W, Zhang GL, Eisenhaure TM, et al. (2017). Mass Spectrometry Profiling of HLA-Associated Peptidomes in Mono-allelic Cells Enables More Accurate Epitope Prediction. Immunity 46, 315–326. - PMC - PubMed
    1. Bertrand F, Montfort A, Marcheteau E, Imbert C, Gilhodes J, Filleron T, Rochaix P, Andrieu-Abadie N, Levade T, Meyer N, et al. (2017). TNFalpha blockade overcomes resistance to anti-PD-1 in experimental melanoma. Nat Commun 8, 2256. - PMC - PubMed
    1. Chan-Penebre E, Kuplast KG, Majer CR, Boriack-Sjodin PA, Wigle TJ, Johnston LD, Rioux N, Munchhof MJ, Jin L, Jacques SL, et al. (2015). A selective inhibitor of PRMT5 with in vivo and in vitro potency in MCL models. Nat Chem Biol 11, 432–437. - PubMed
    1. De Bruijn ML, Schumacher TN, Nieland JD, Ploegh HL, Kast WM, and Melief CJ (1991). Peptide loading of empty major histocompatibility complex molecules on RMA-S cells allows the induction of primary cytotoxic T lymphocyte responses. Eur J Immunol 21, 2963–2970. - PubMed
    1. De Silva AD, Boesteanu A, Song R, Nagy N, Harhaj E, Harding CV, and Joyce S. (1999). Thermolabile H-2Kb molecules expressed by transporter associated with antigen processing-deficient RMA-S cells are occupied by low-affinity peptides. J Immunol 163, 4413–4420. - PubMed

Publication types

MeSH terms