

Development of a protocol to assess within-subject, regional white matter hyperintensity changes in aging and dementia
- PMID: 34171312
- PMCID: PMC8513808
- DOI: 10.1016/j.jneumeth.2021.109270
Development of a protocol to assess within-subject, regional white matter hyperintensity changes in aging and dementia
Abstract
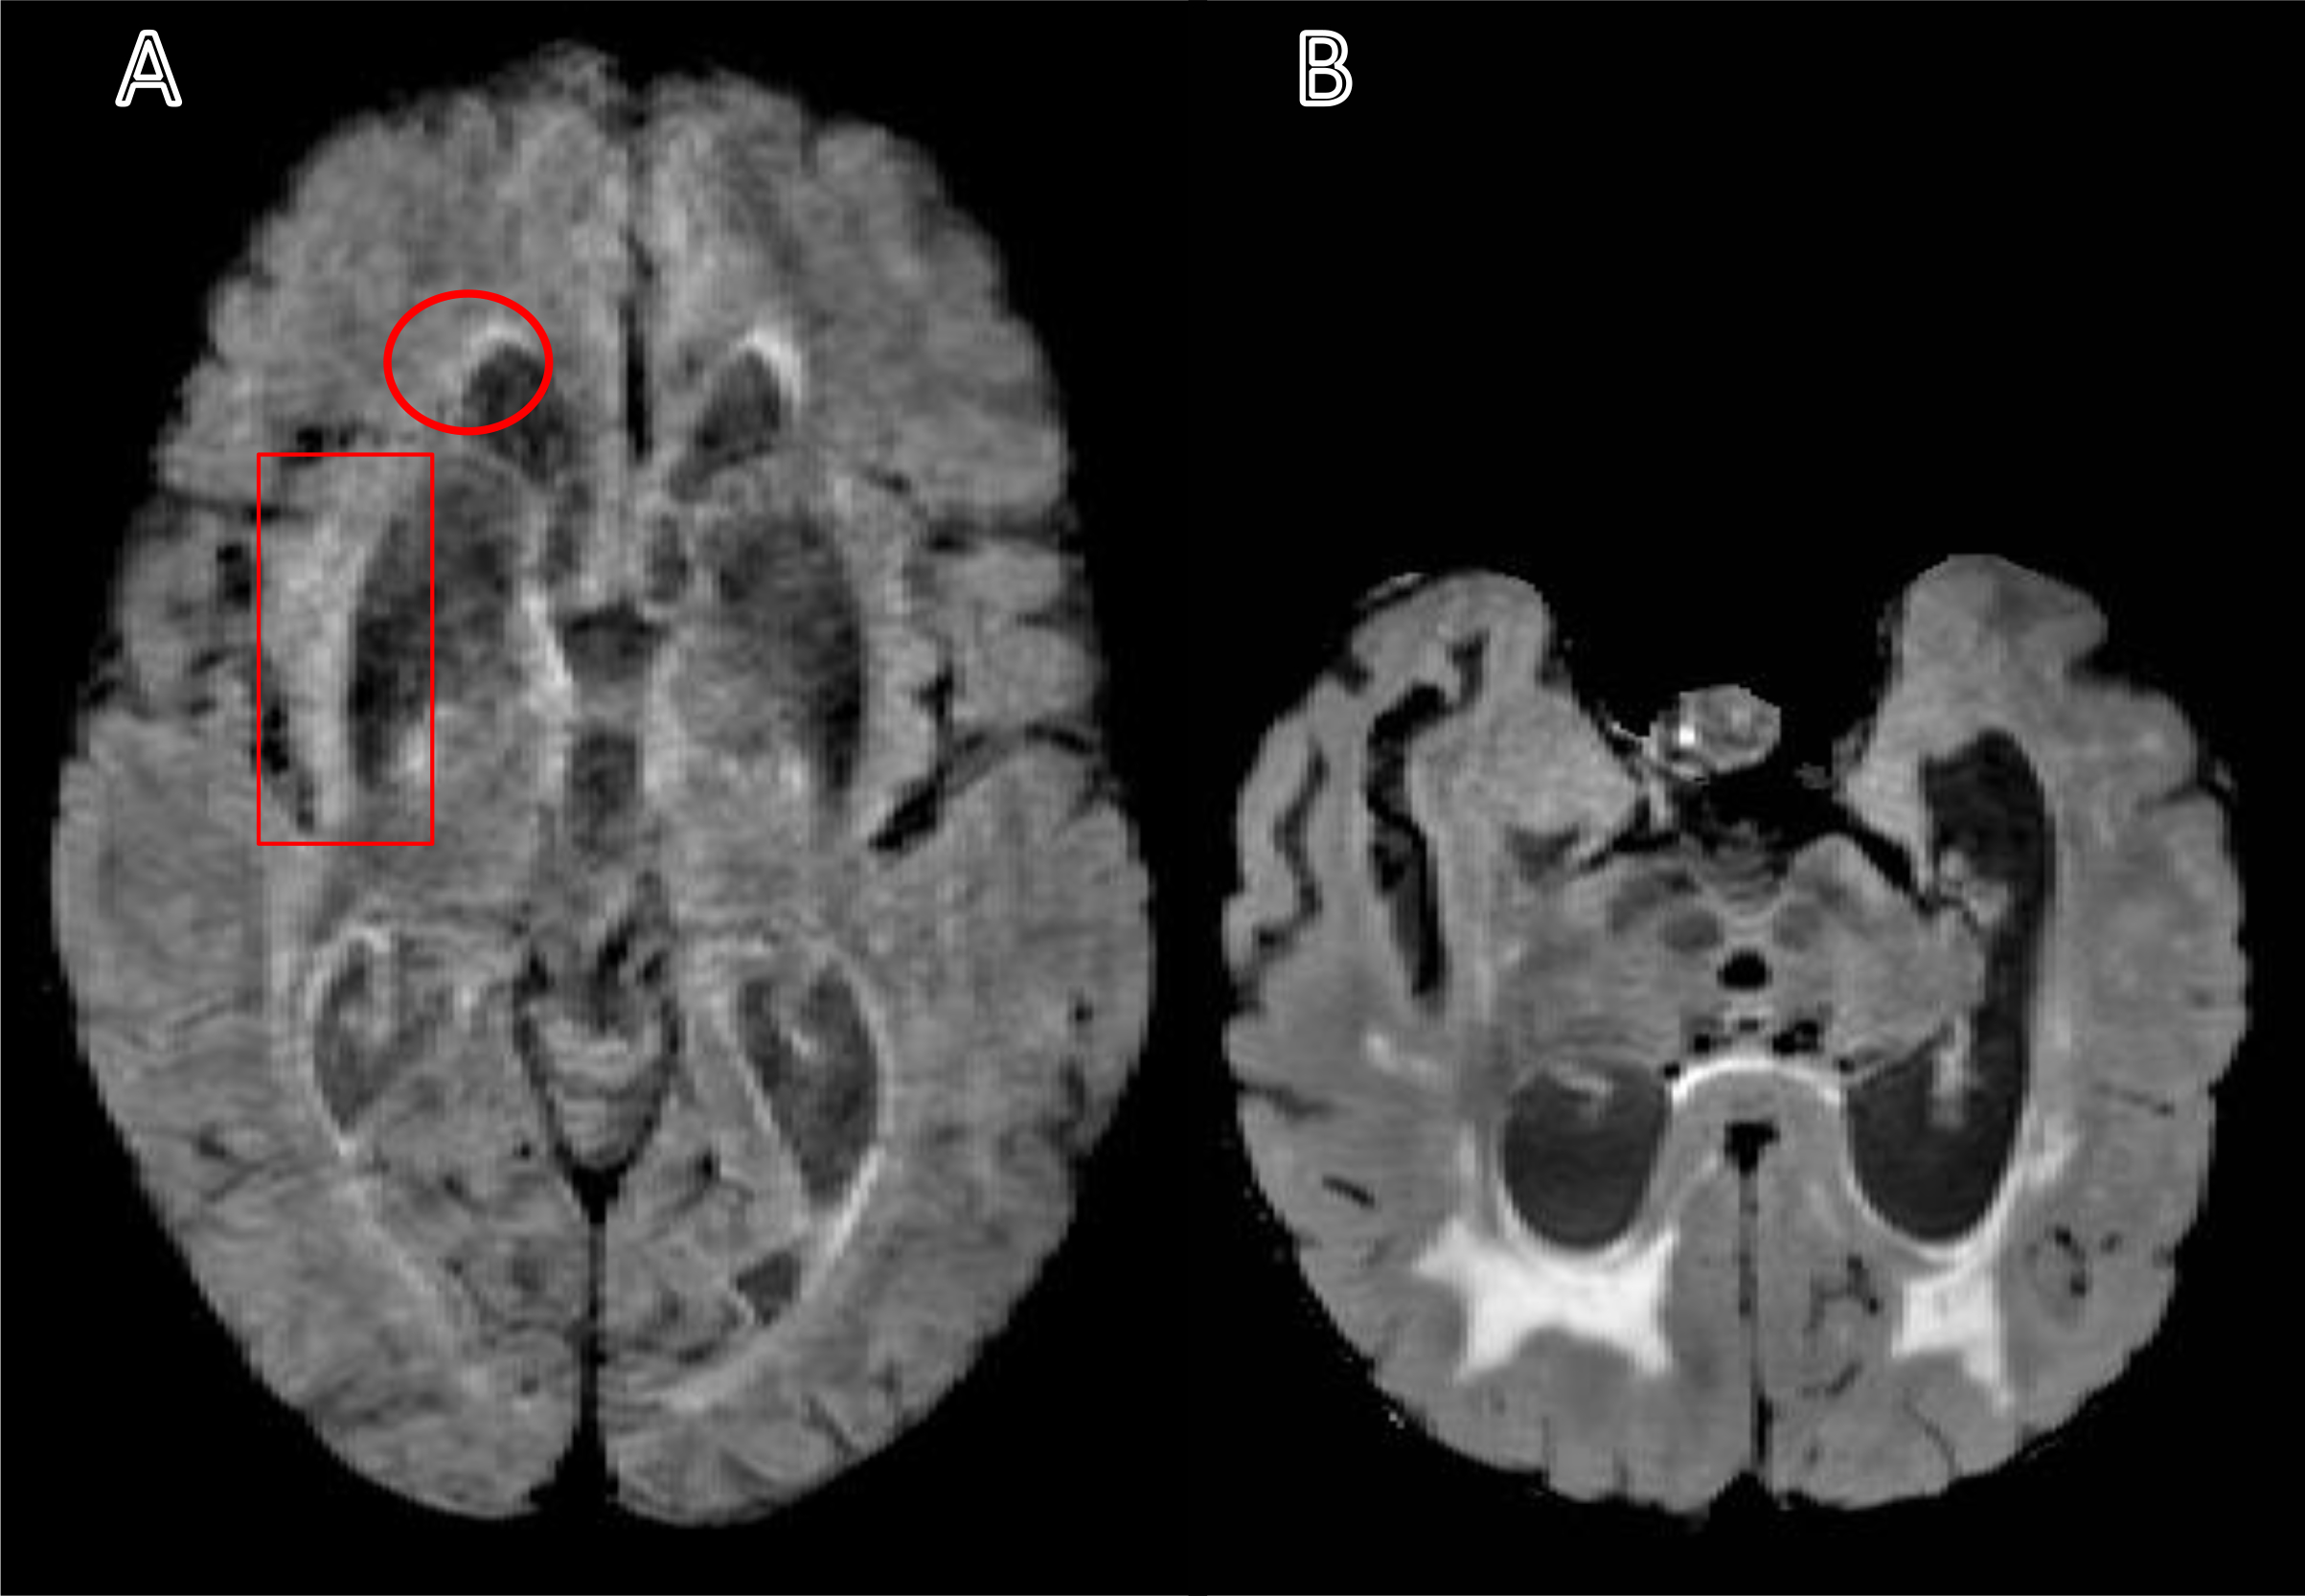
Background: White matter hyperintensities (WMH), associated with both dementia risk and progression, can individually progress, remain stable, or even regress influencing cognitive decline related to specific cerebrovascular-risks. This study details the development and validation of a registration protocol to assess regional, within-subject, longitudinal WMH changes (ΔWMH) that is currently lacking in the field.
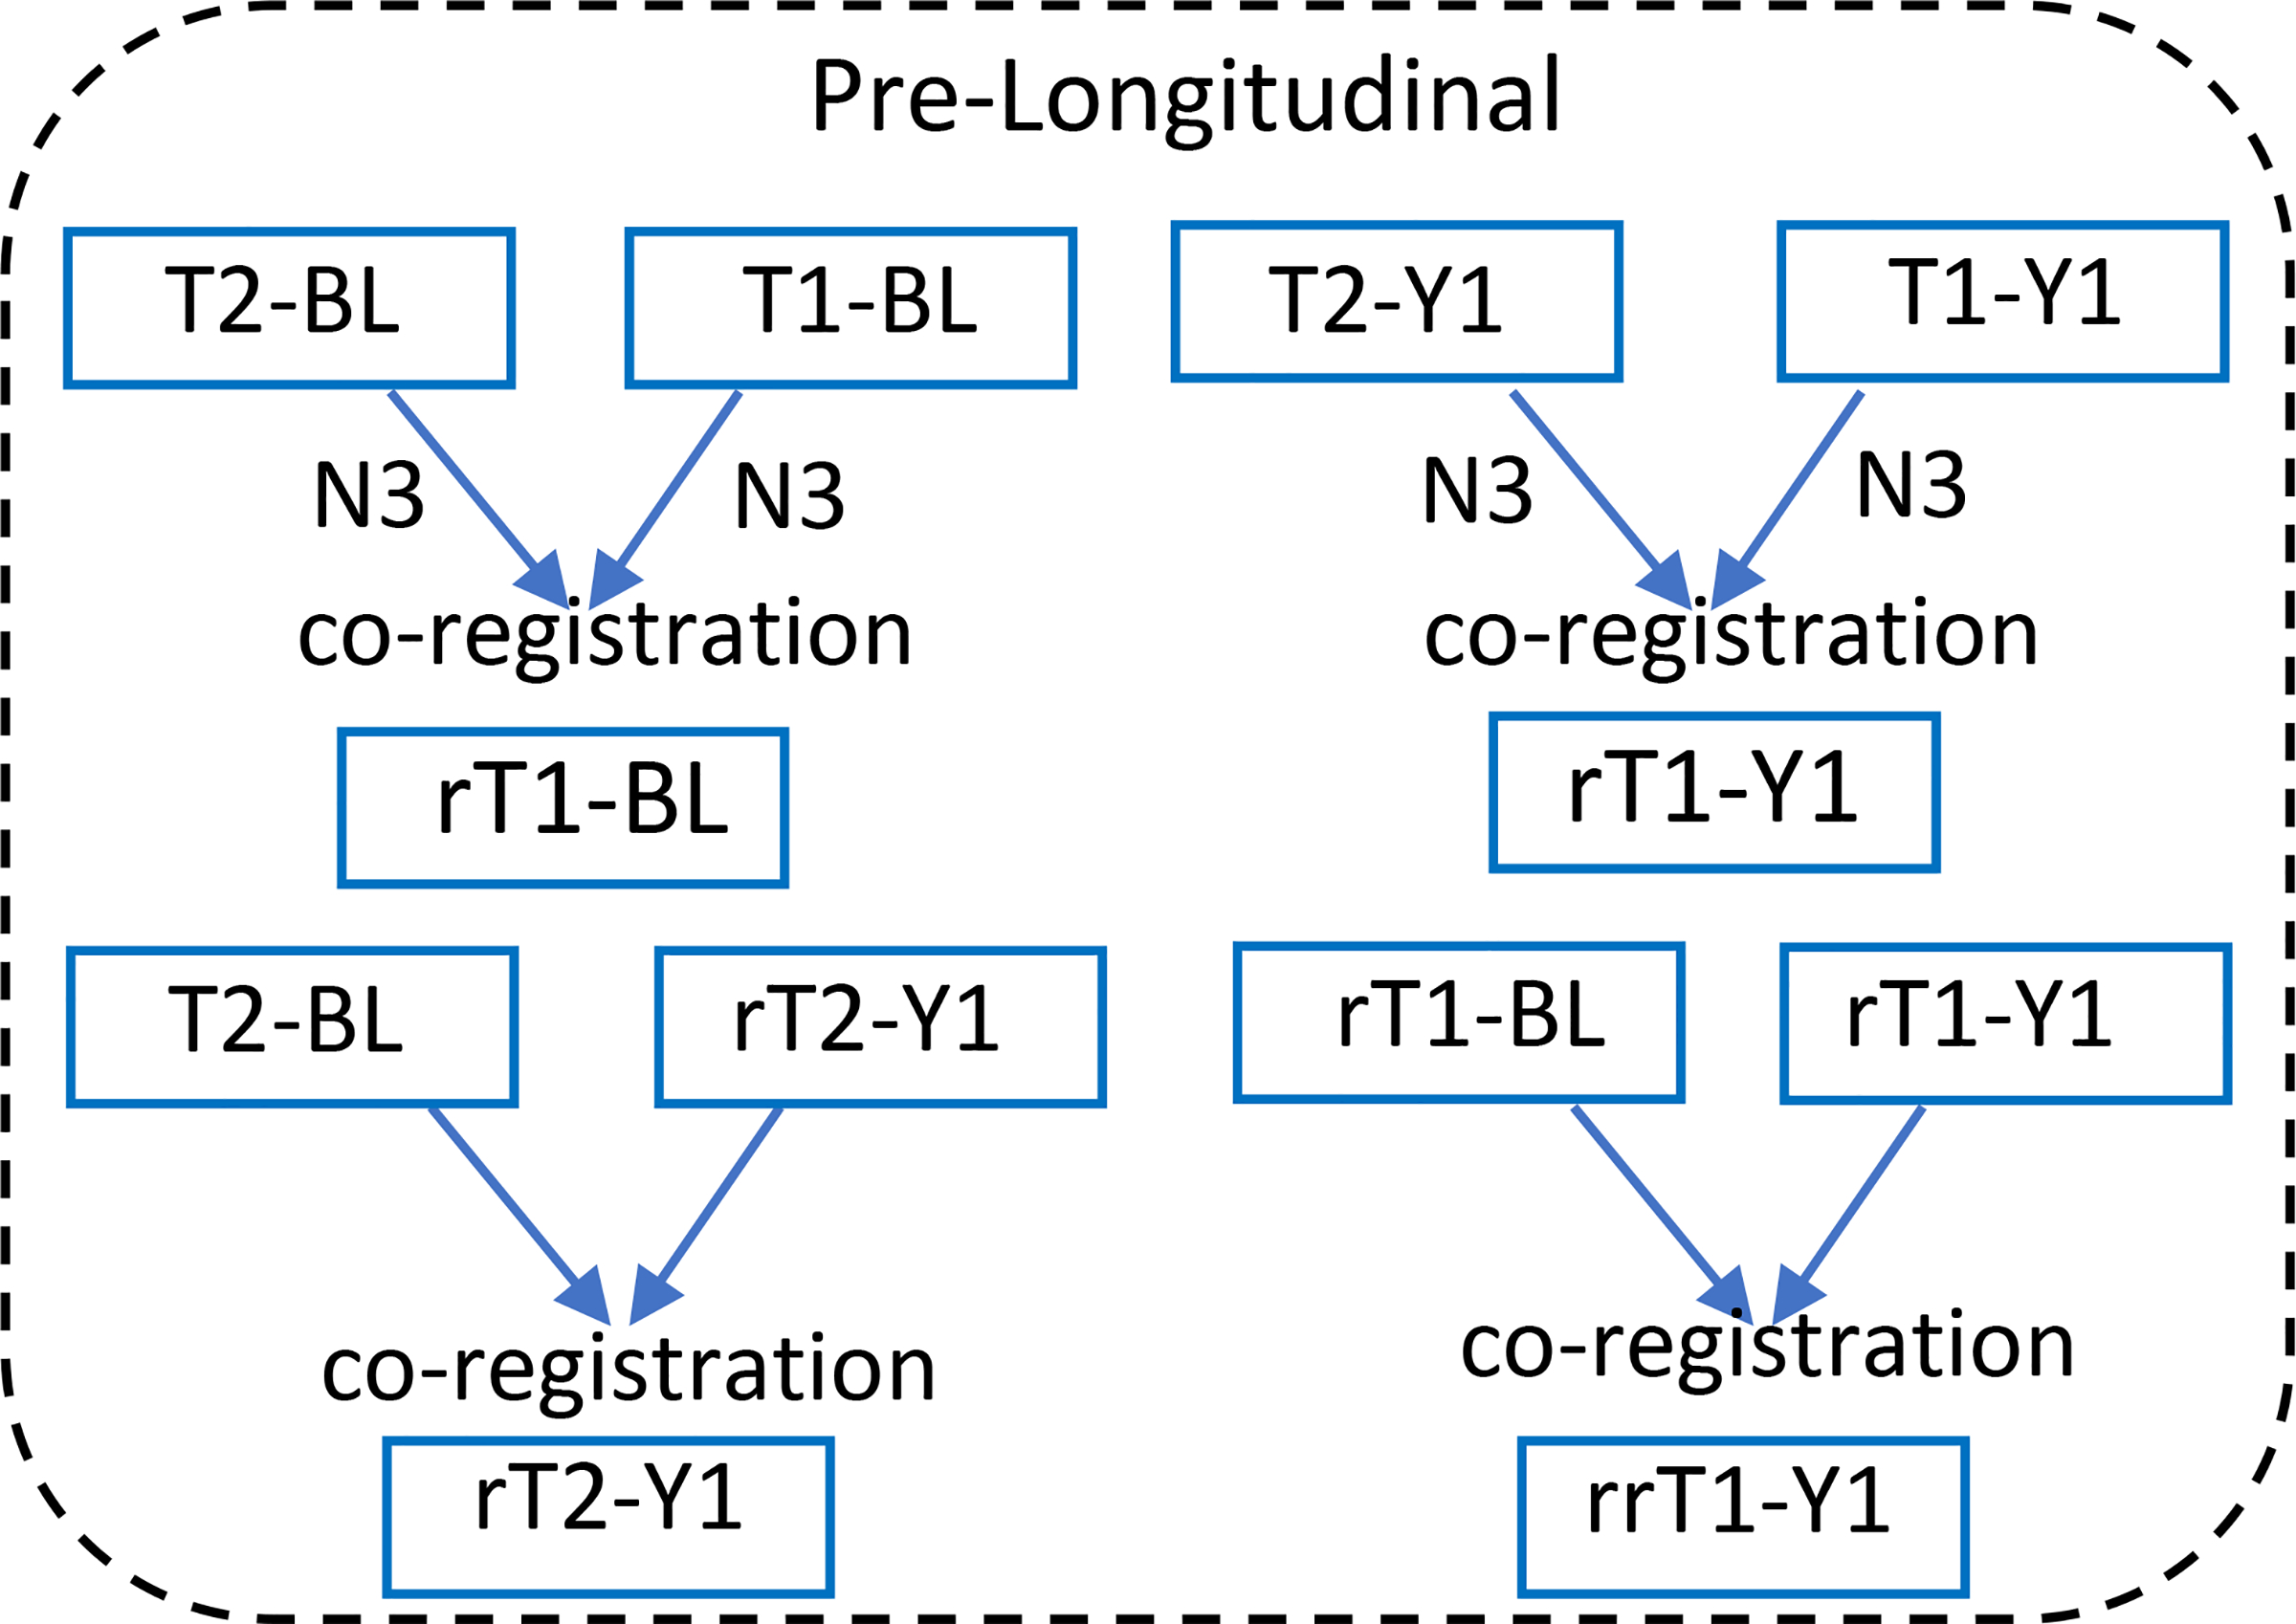
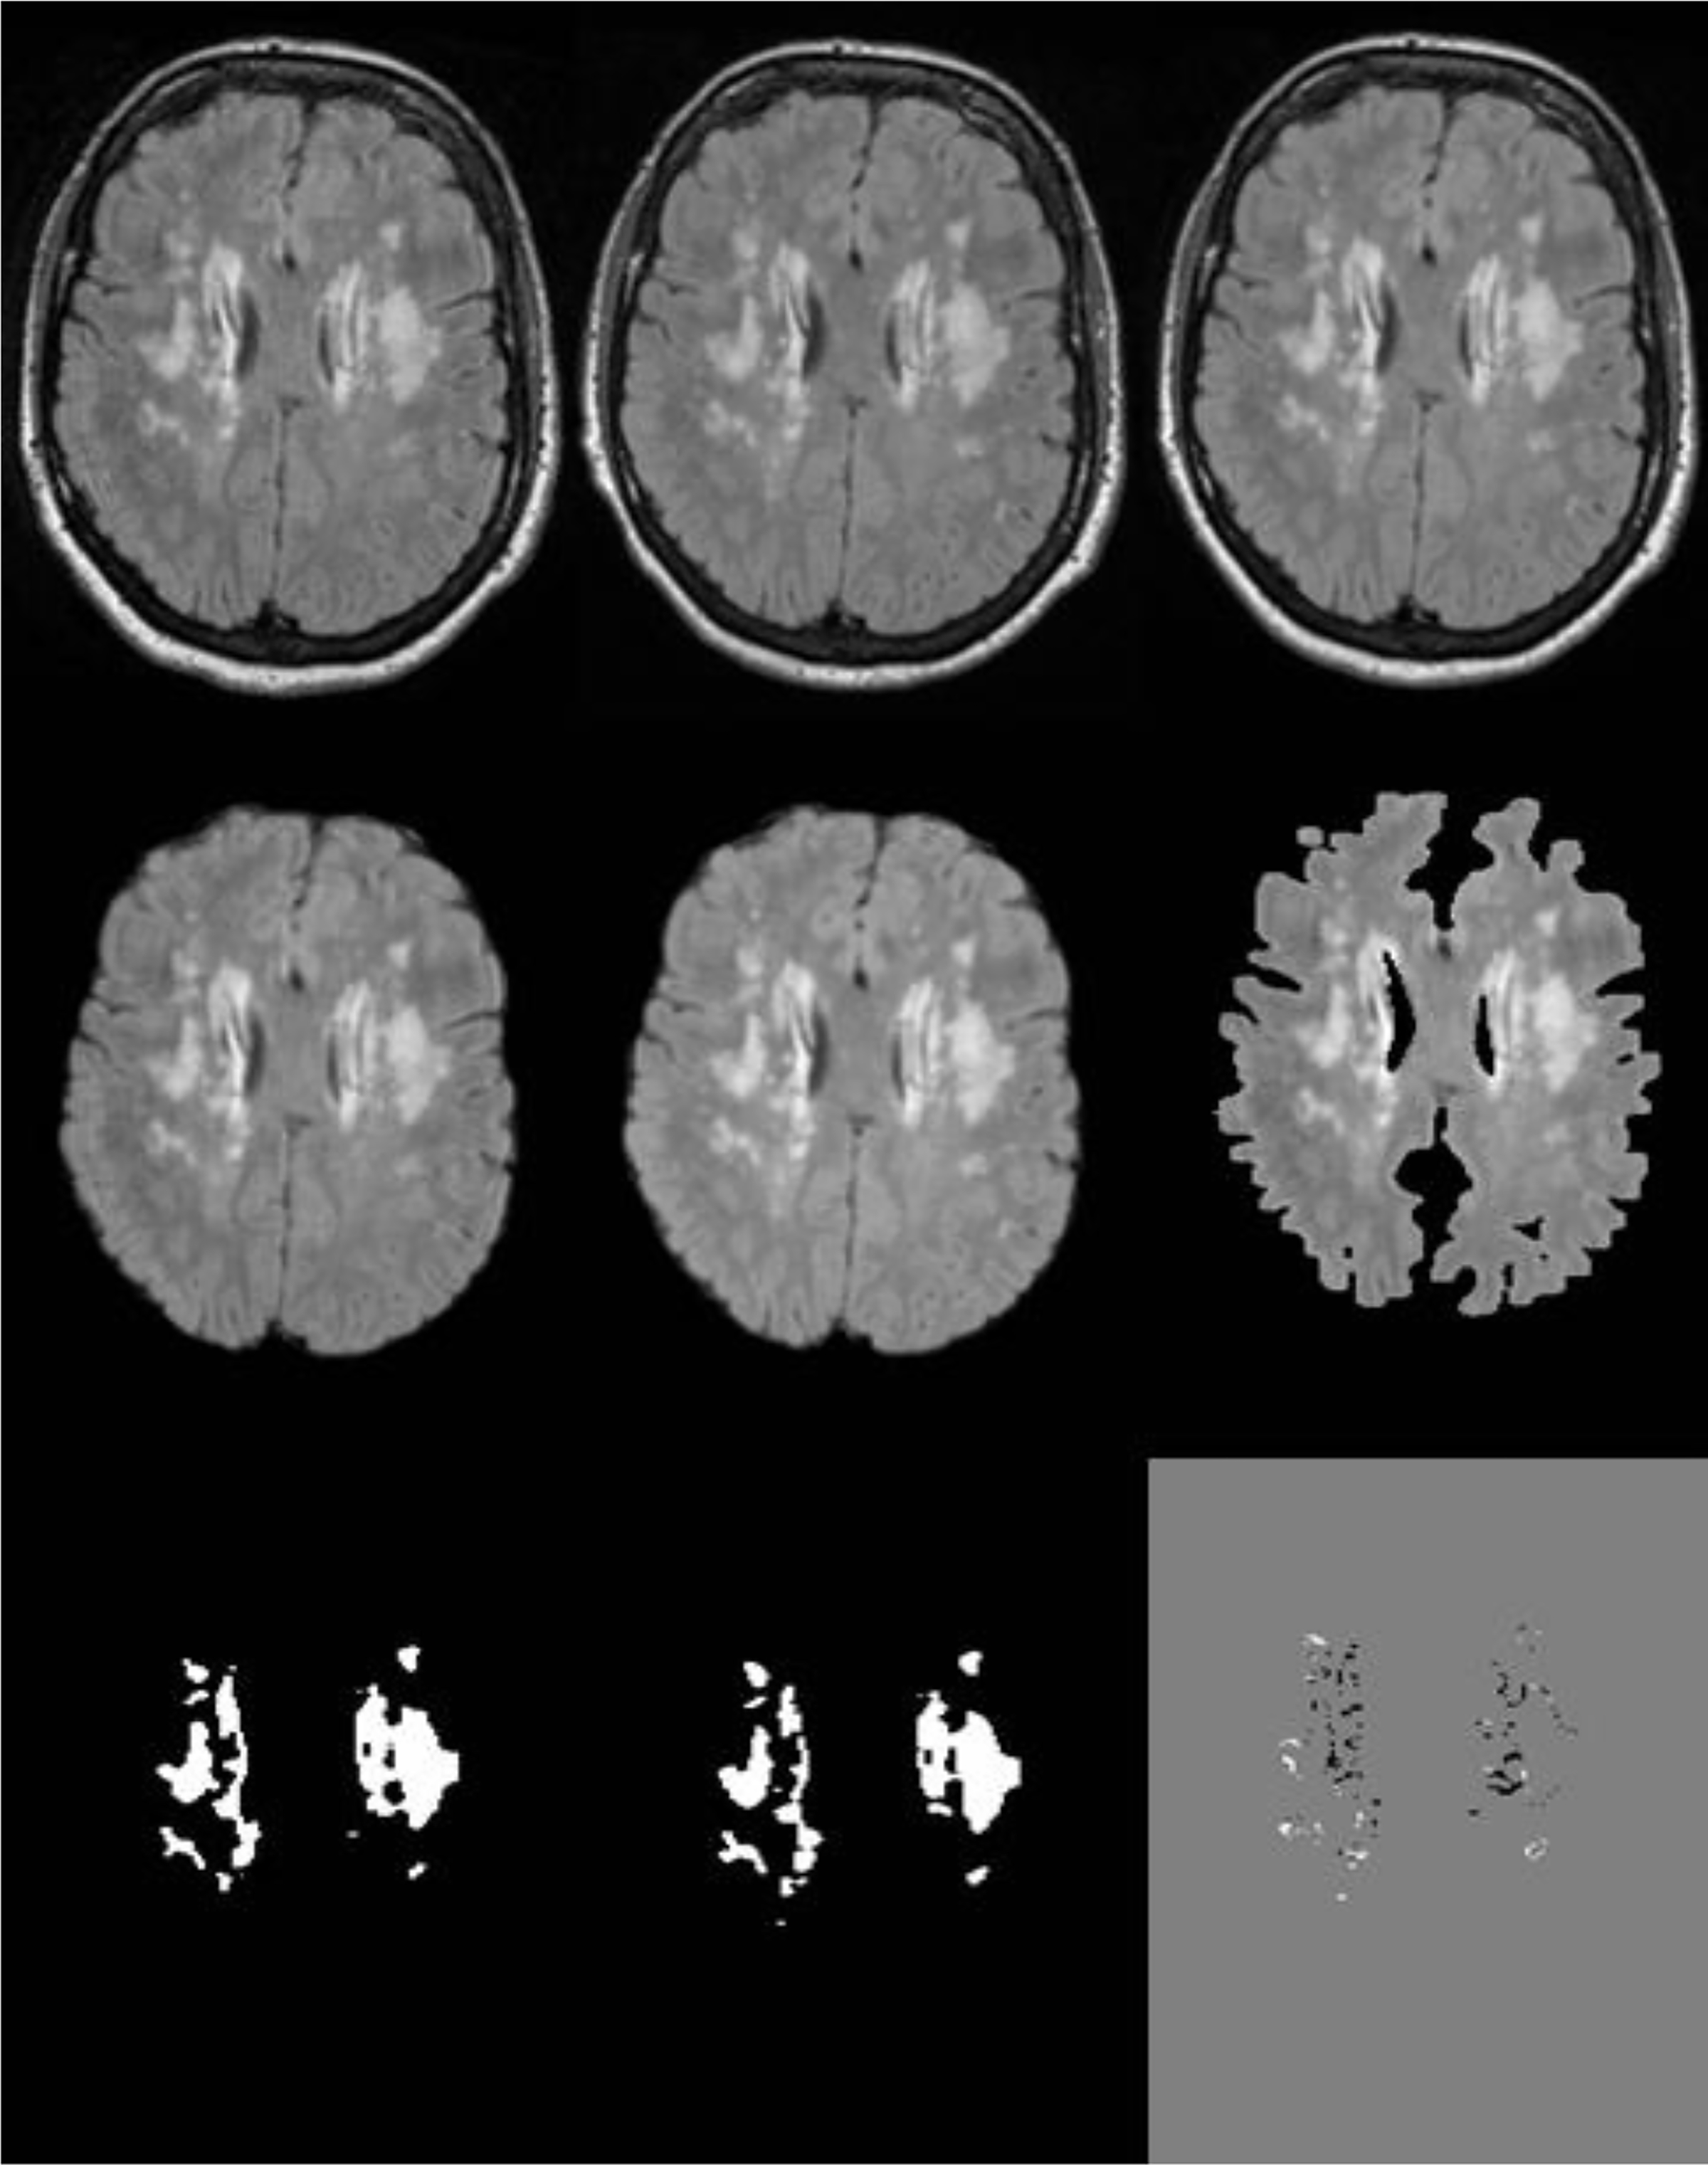
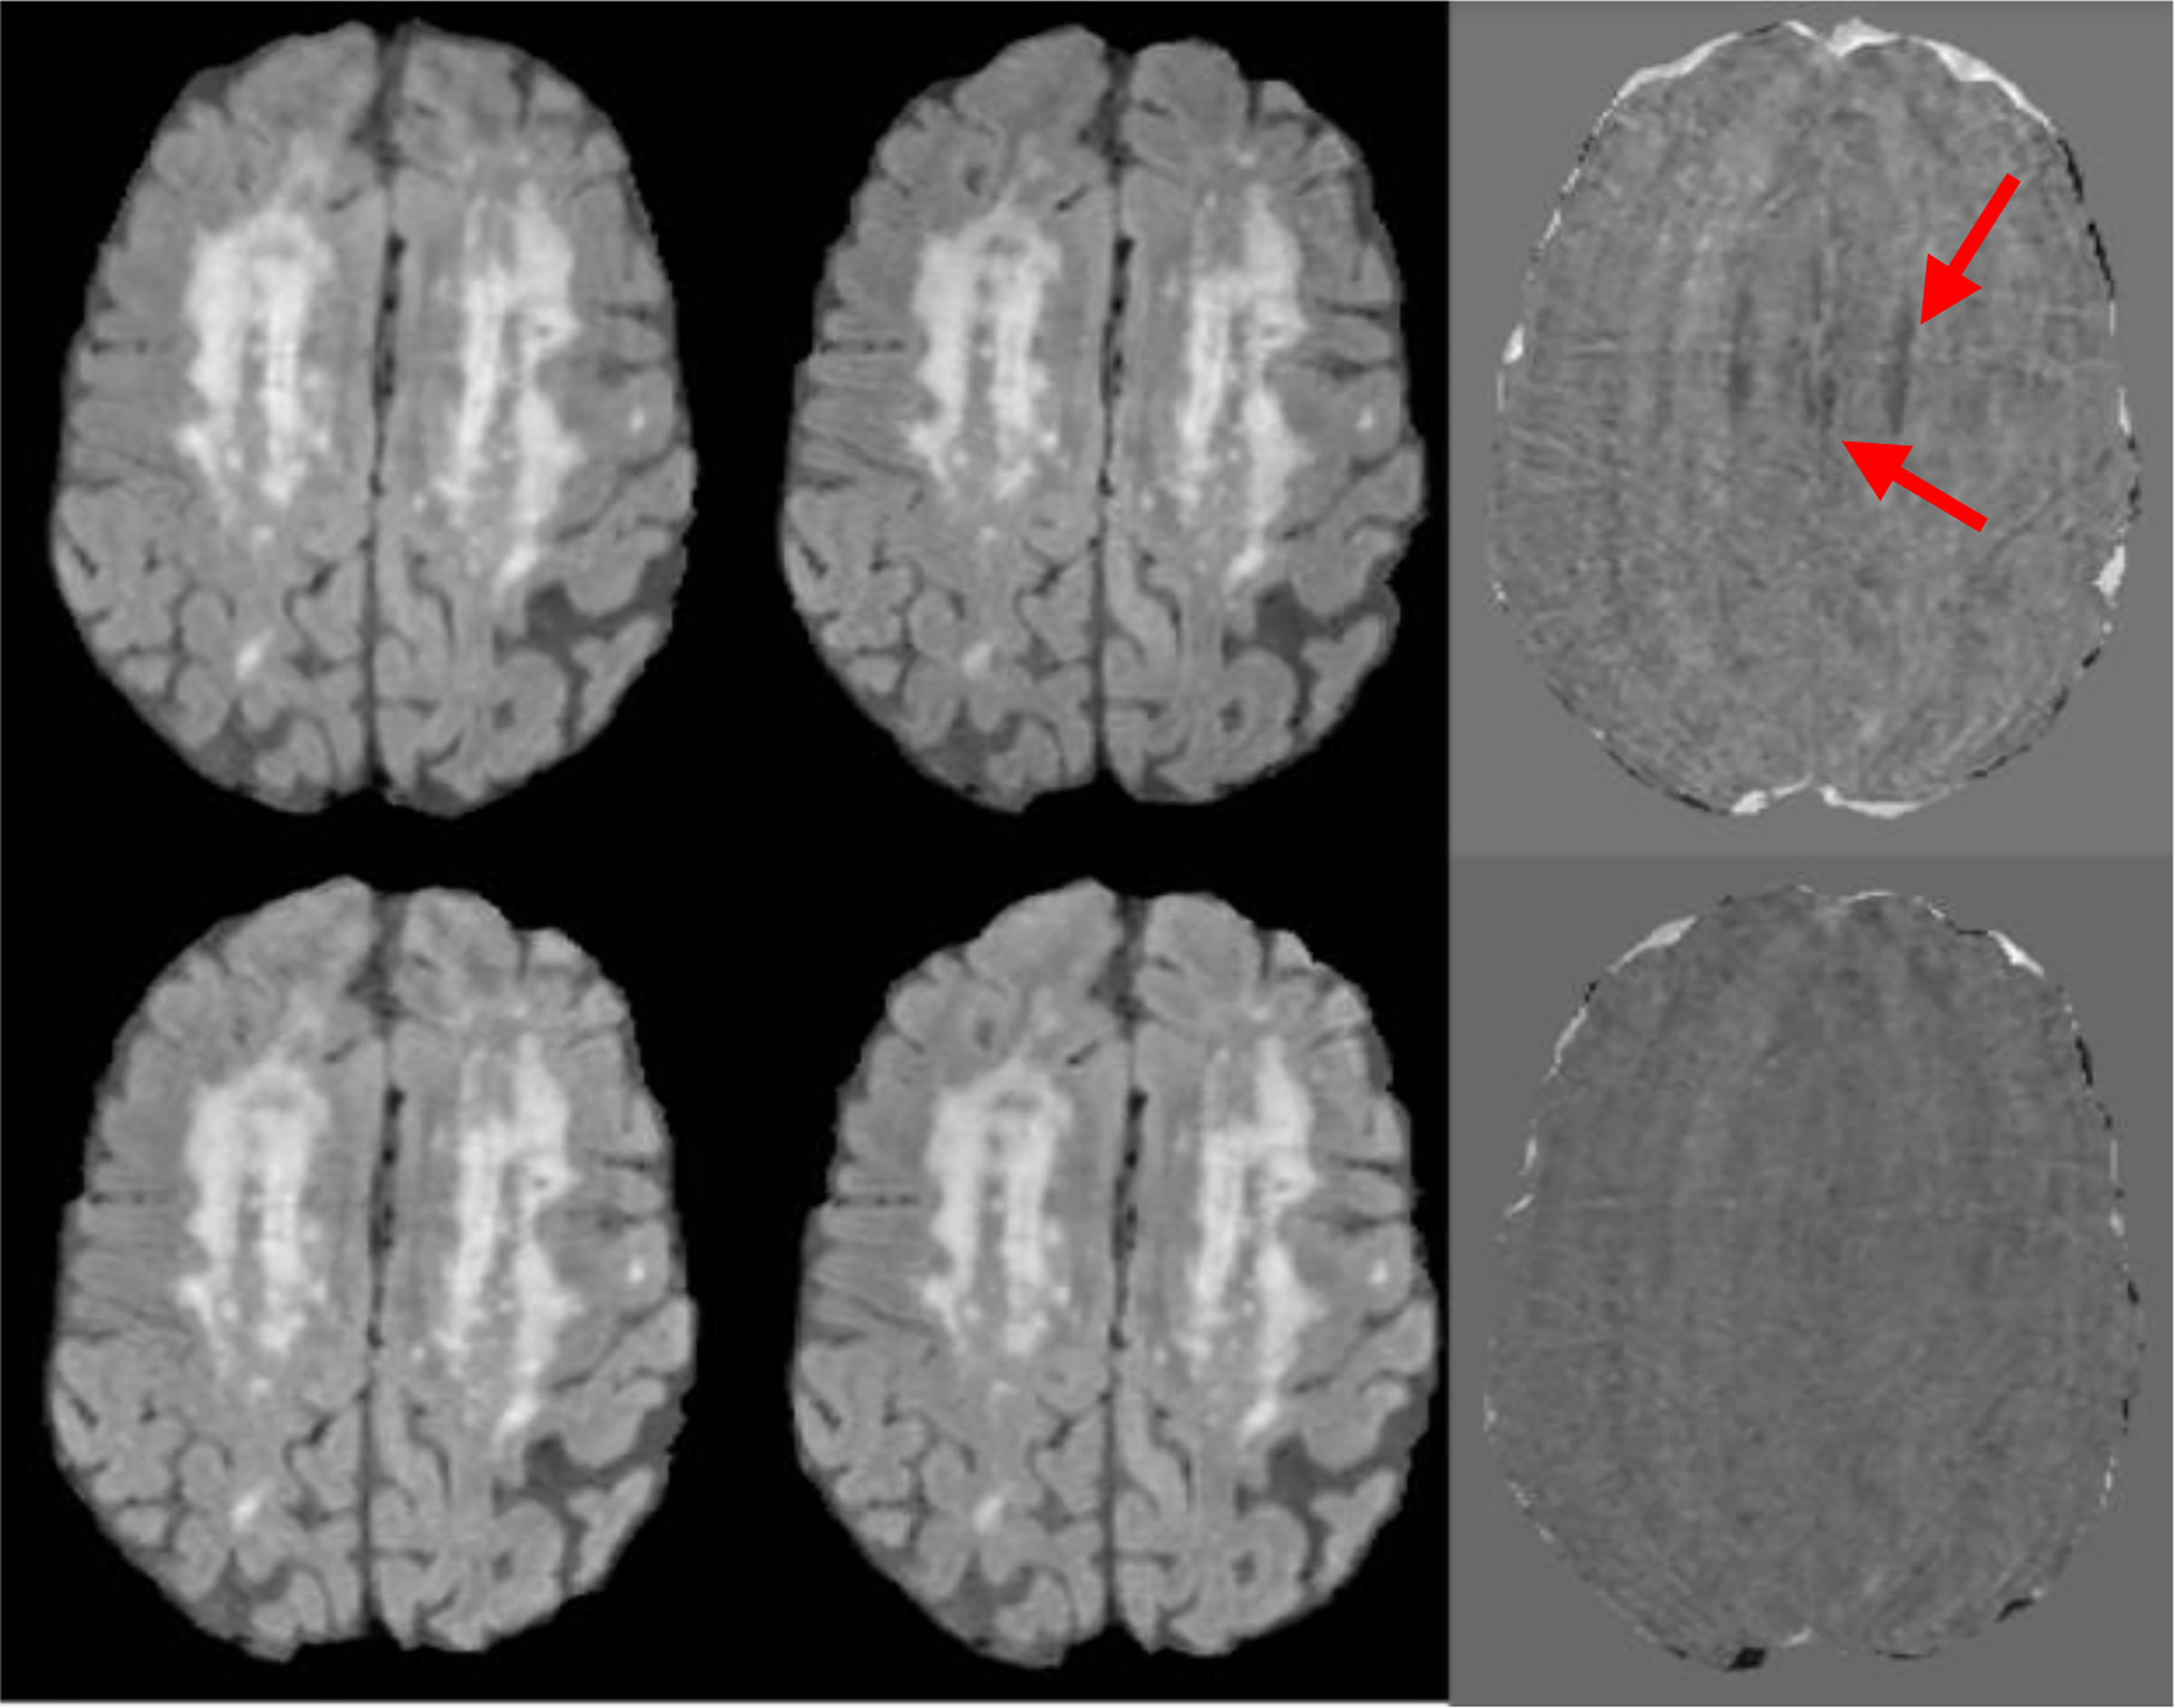
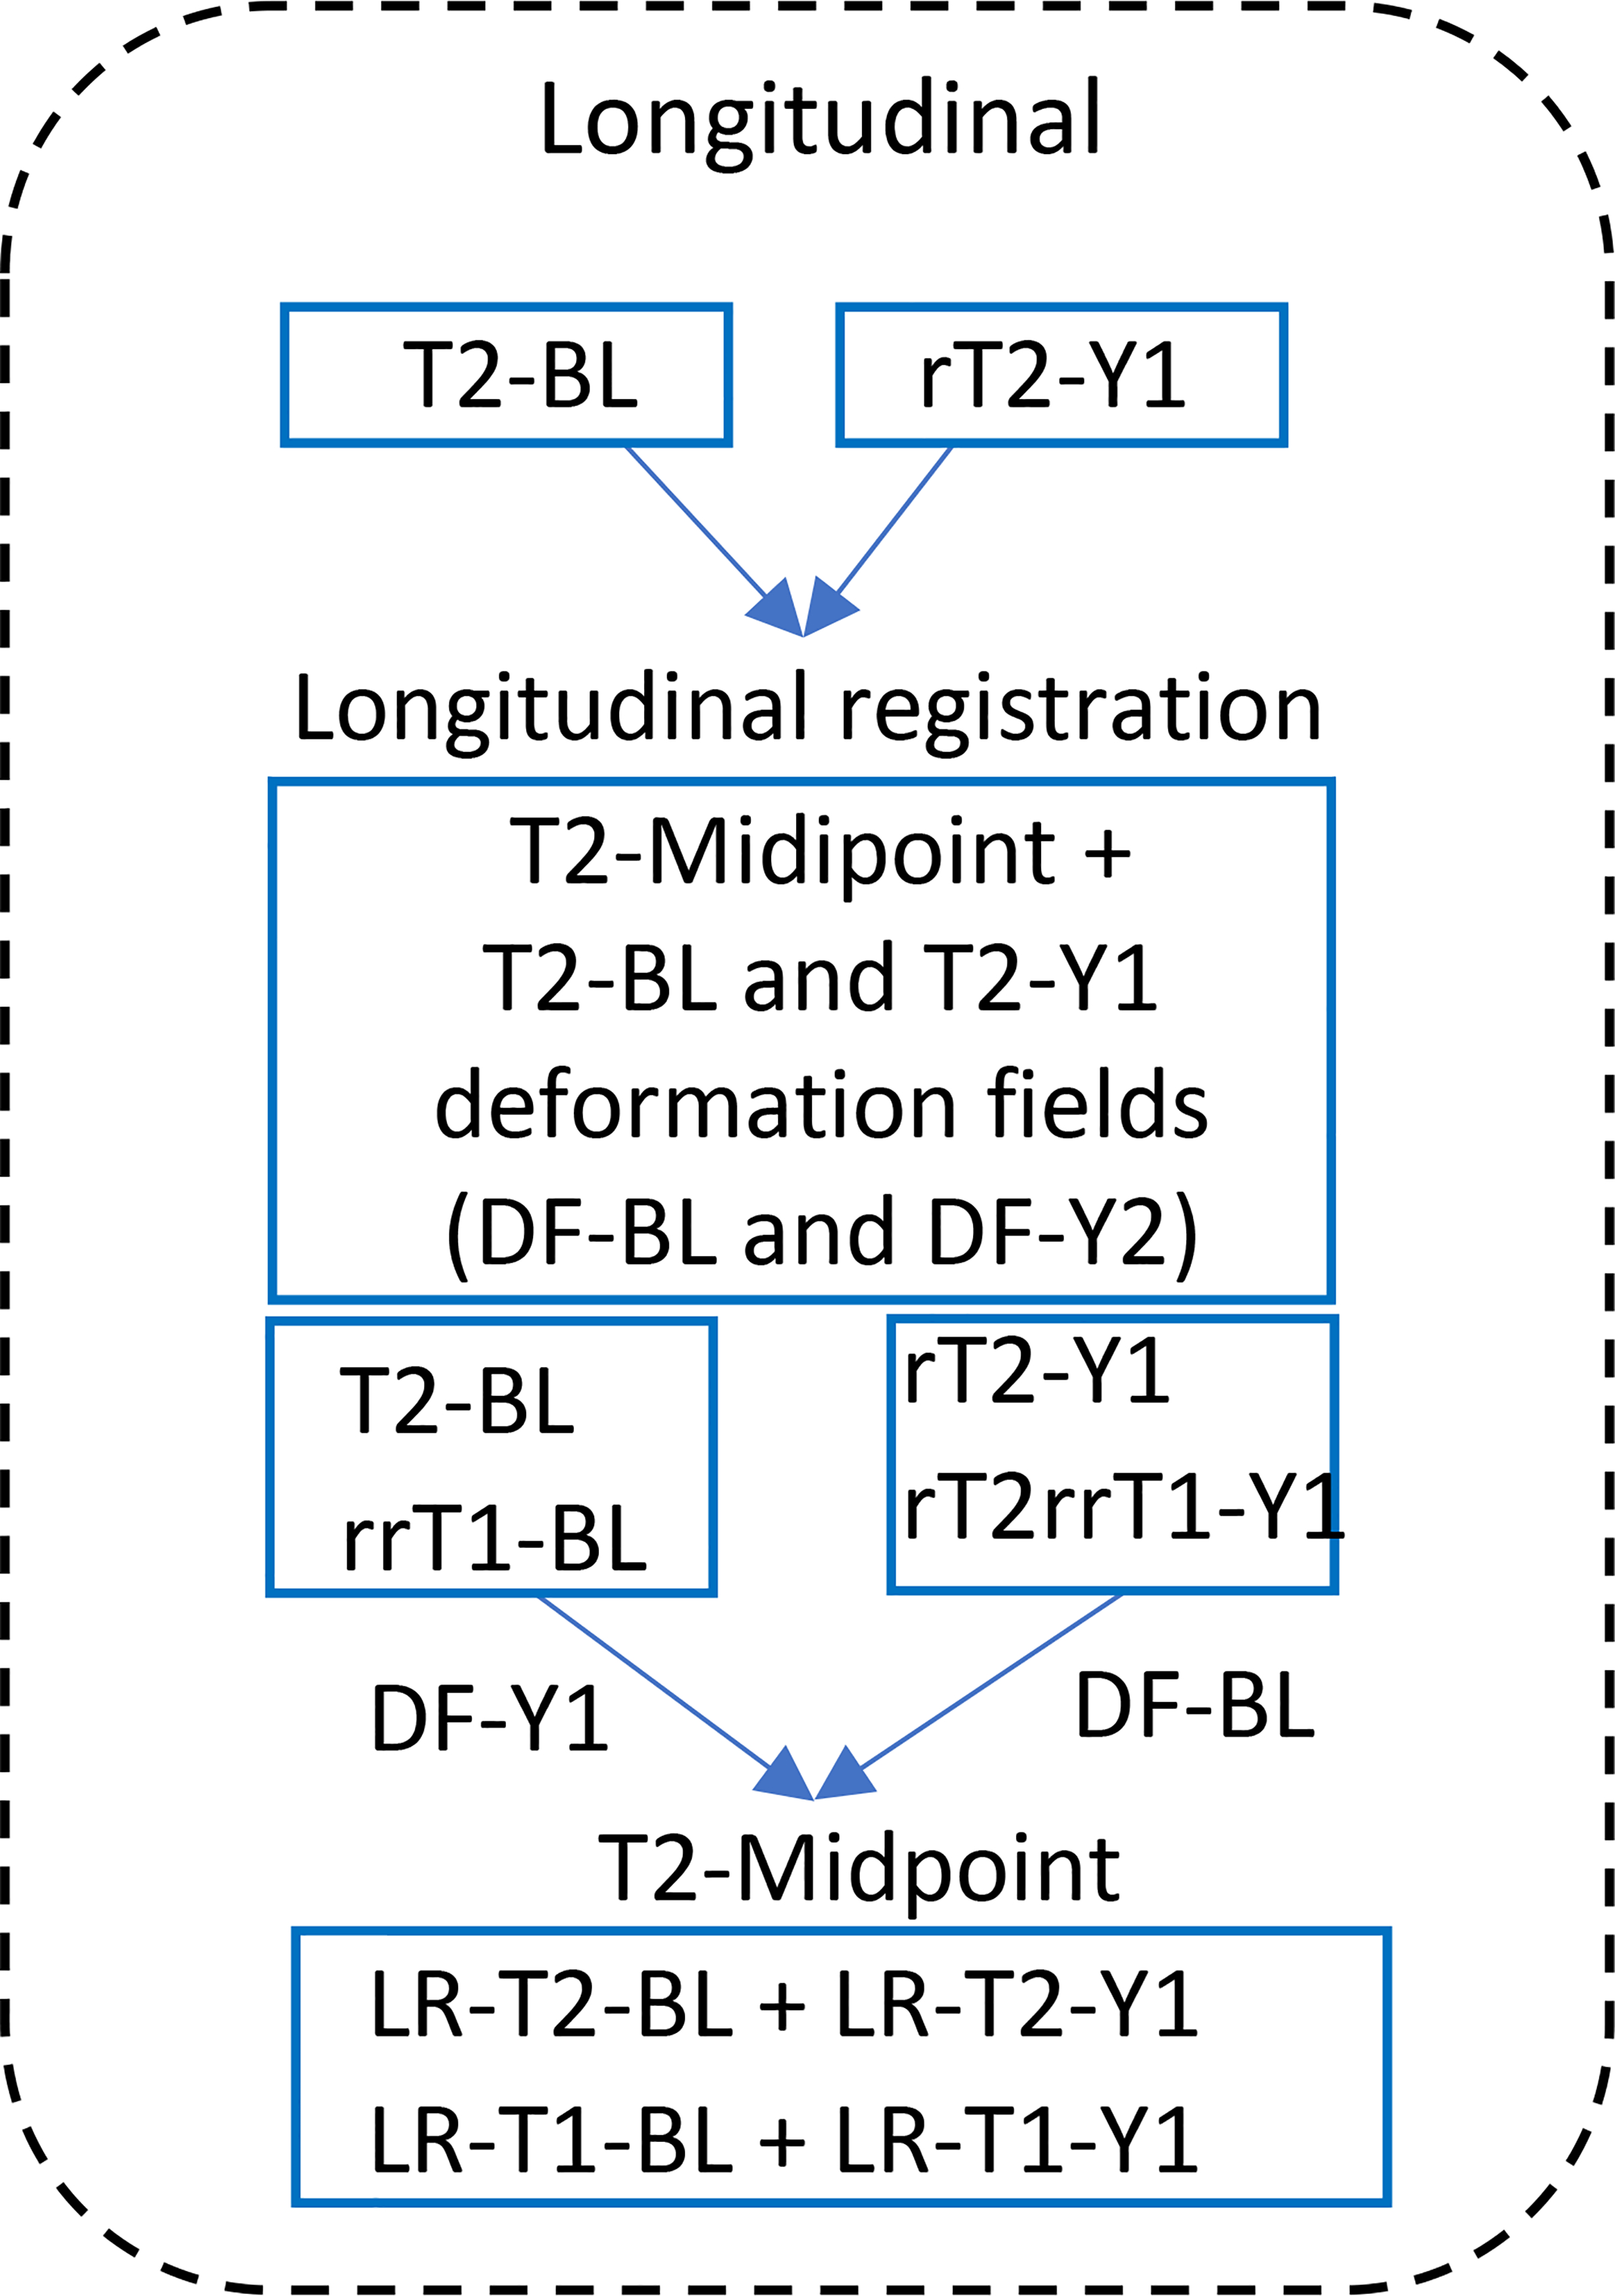
New method: 3D-FLAIR images (baseline and one-year-visit) were used for protocol development and validation. The method was validated by assessing the correlation between forward and reverse longitudinal registration, and between summated regional progression-regression volumes and Global ΔWMH. The clinical relevance of growth-regression ΔWMH were explored in relation to an executive function test.
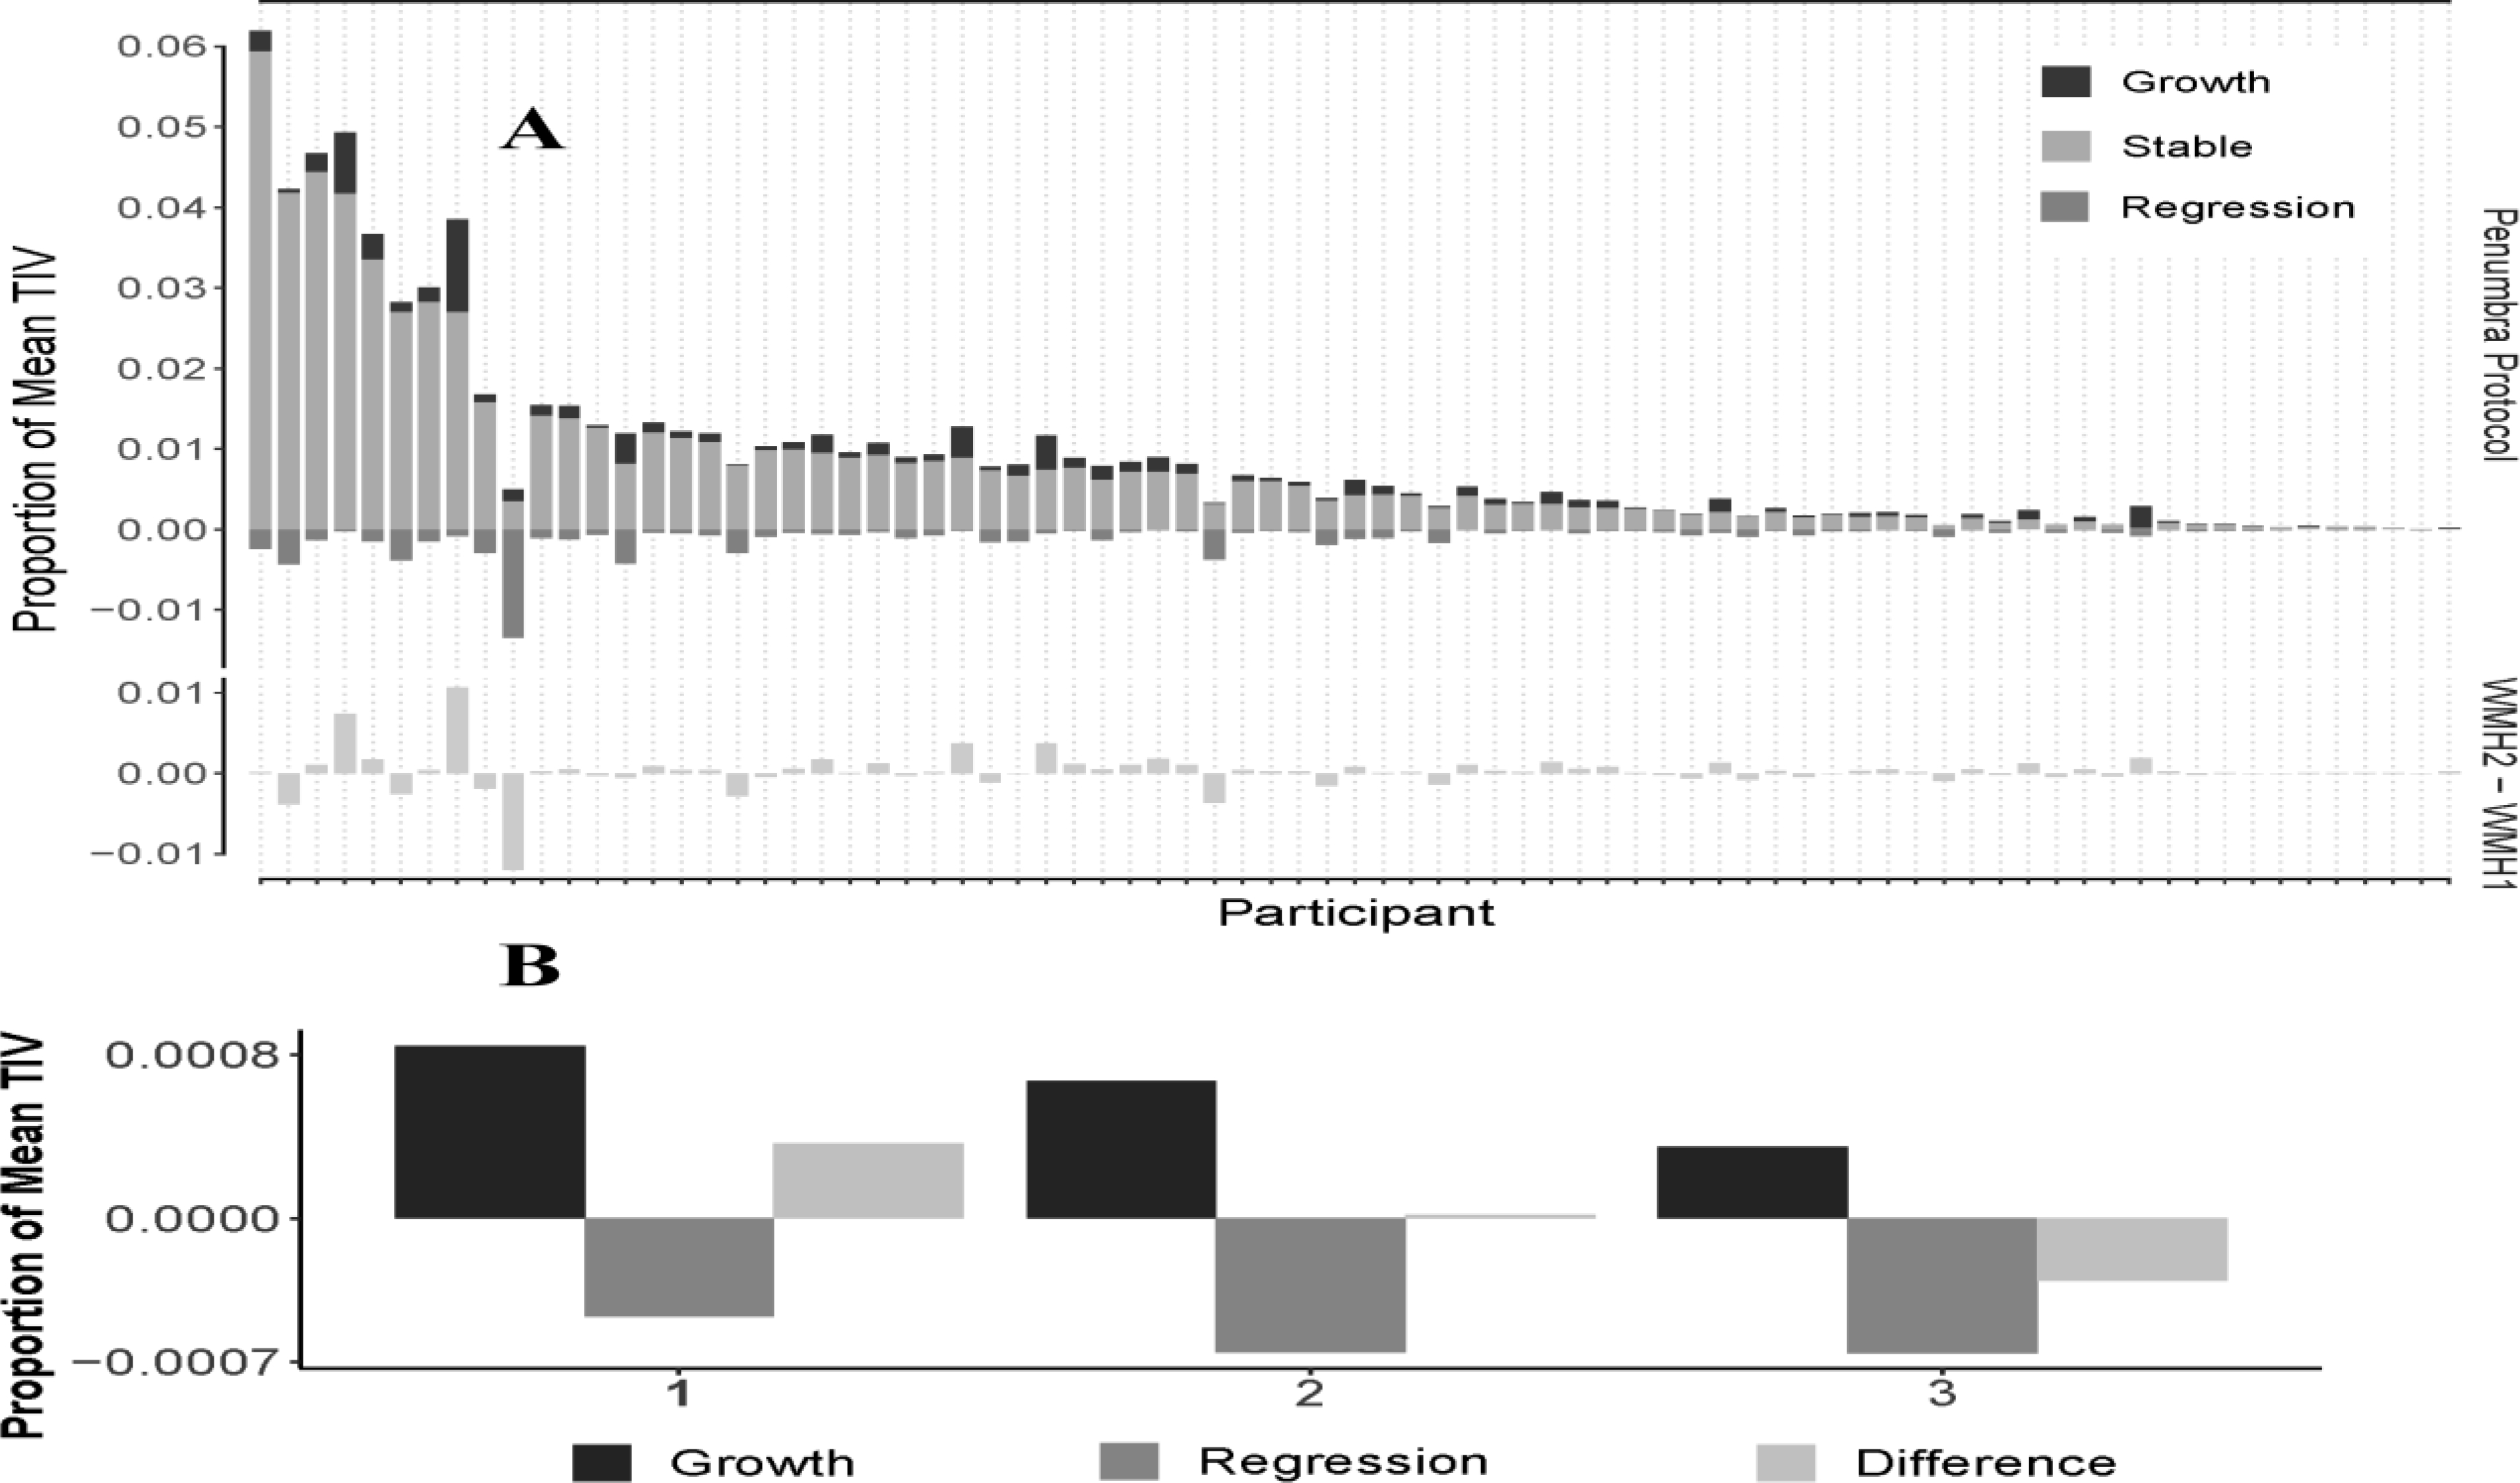
Results: MRI scans for 79 participants (73.5 ± 8.8 years) were used in this study. Global ΔWMH vs. summated regional progression-regression volumes were highly associated (r2 = 0.90; p-value < 0.001). Bi-directional registration validated the registration method (r2 = 0.999; p-value < 0.001). Growth and regression, but not overall ΔWMH, were associated with one-year declines in performance on Trial-Making-Test-B.
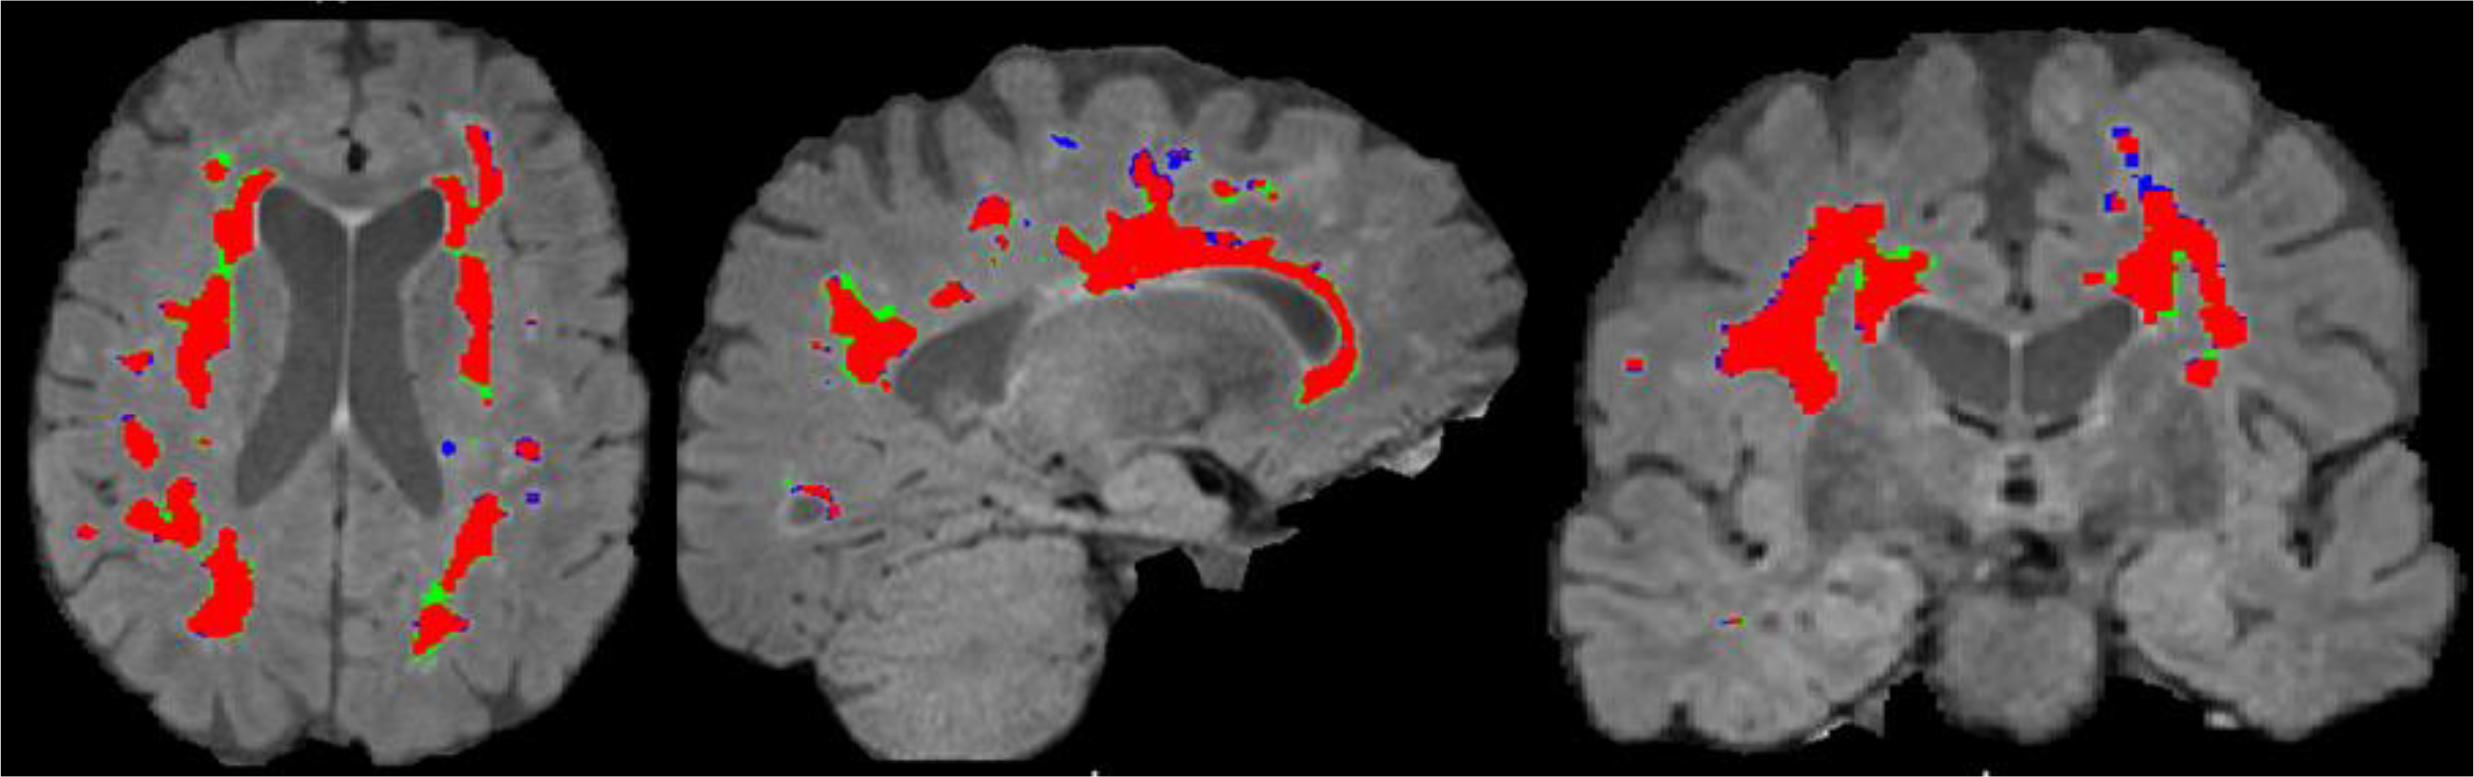
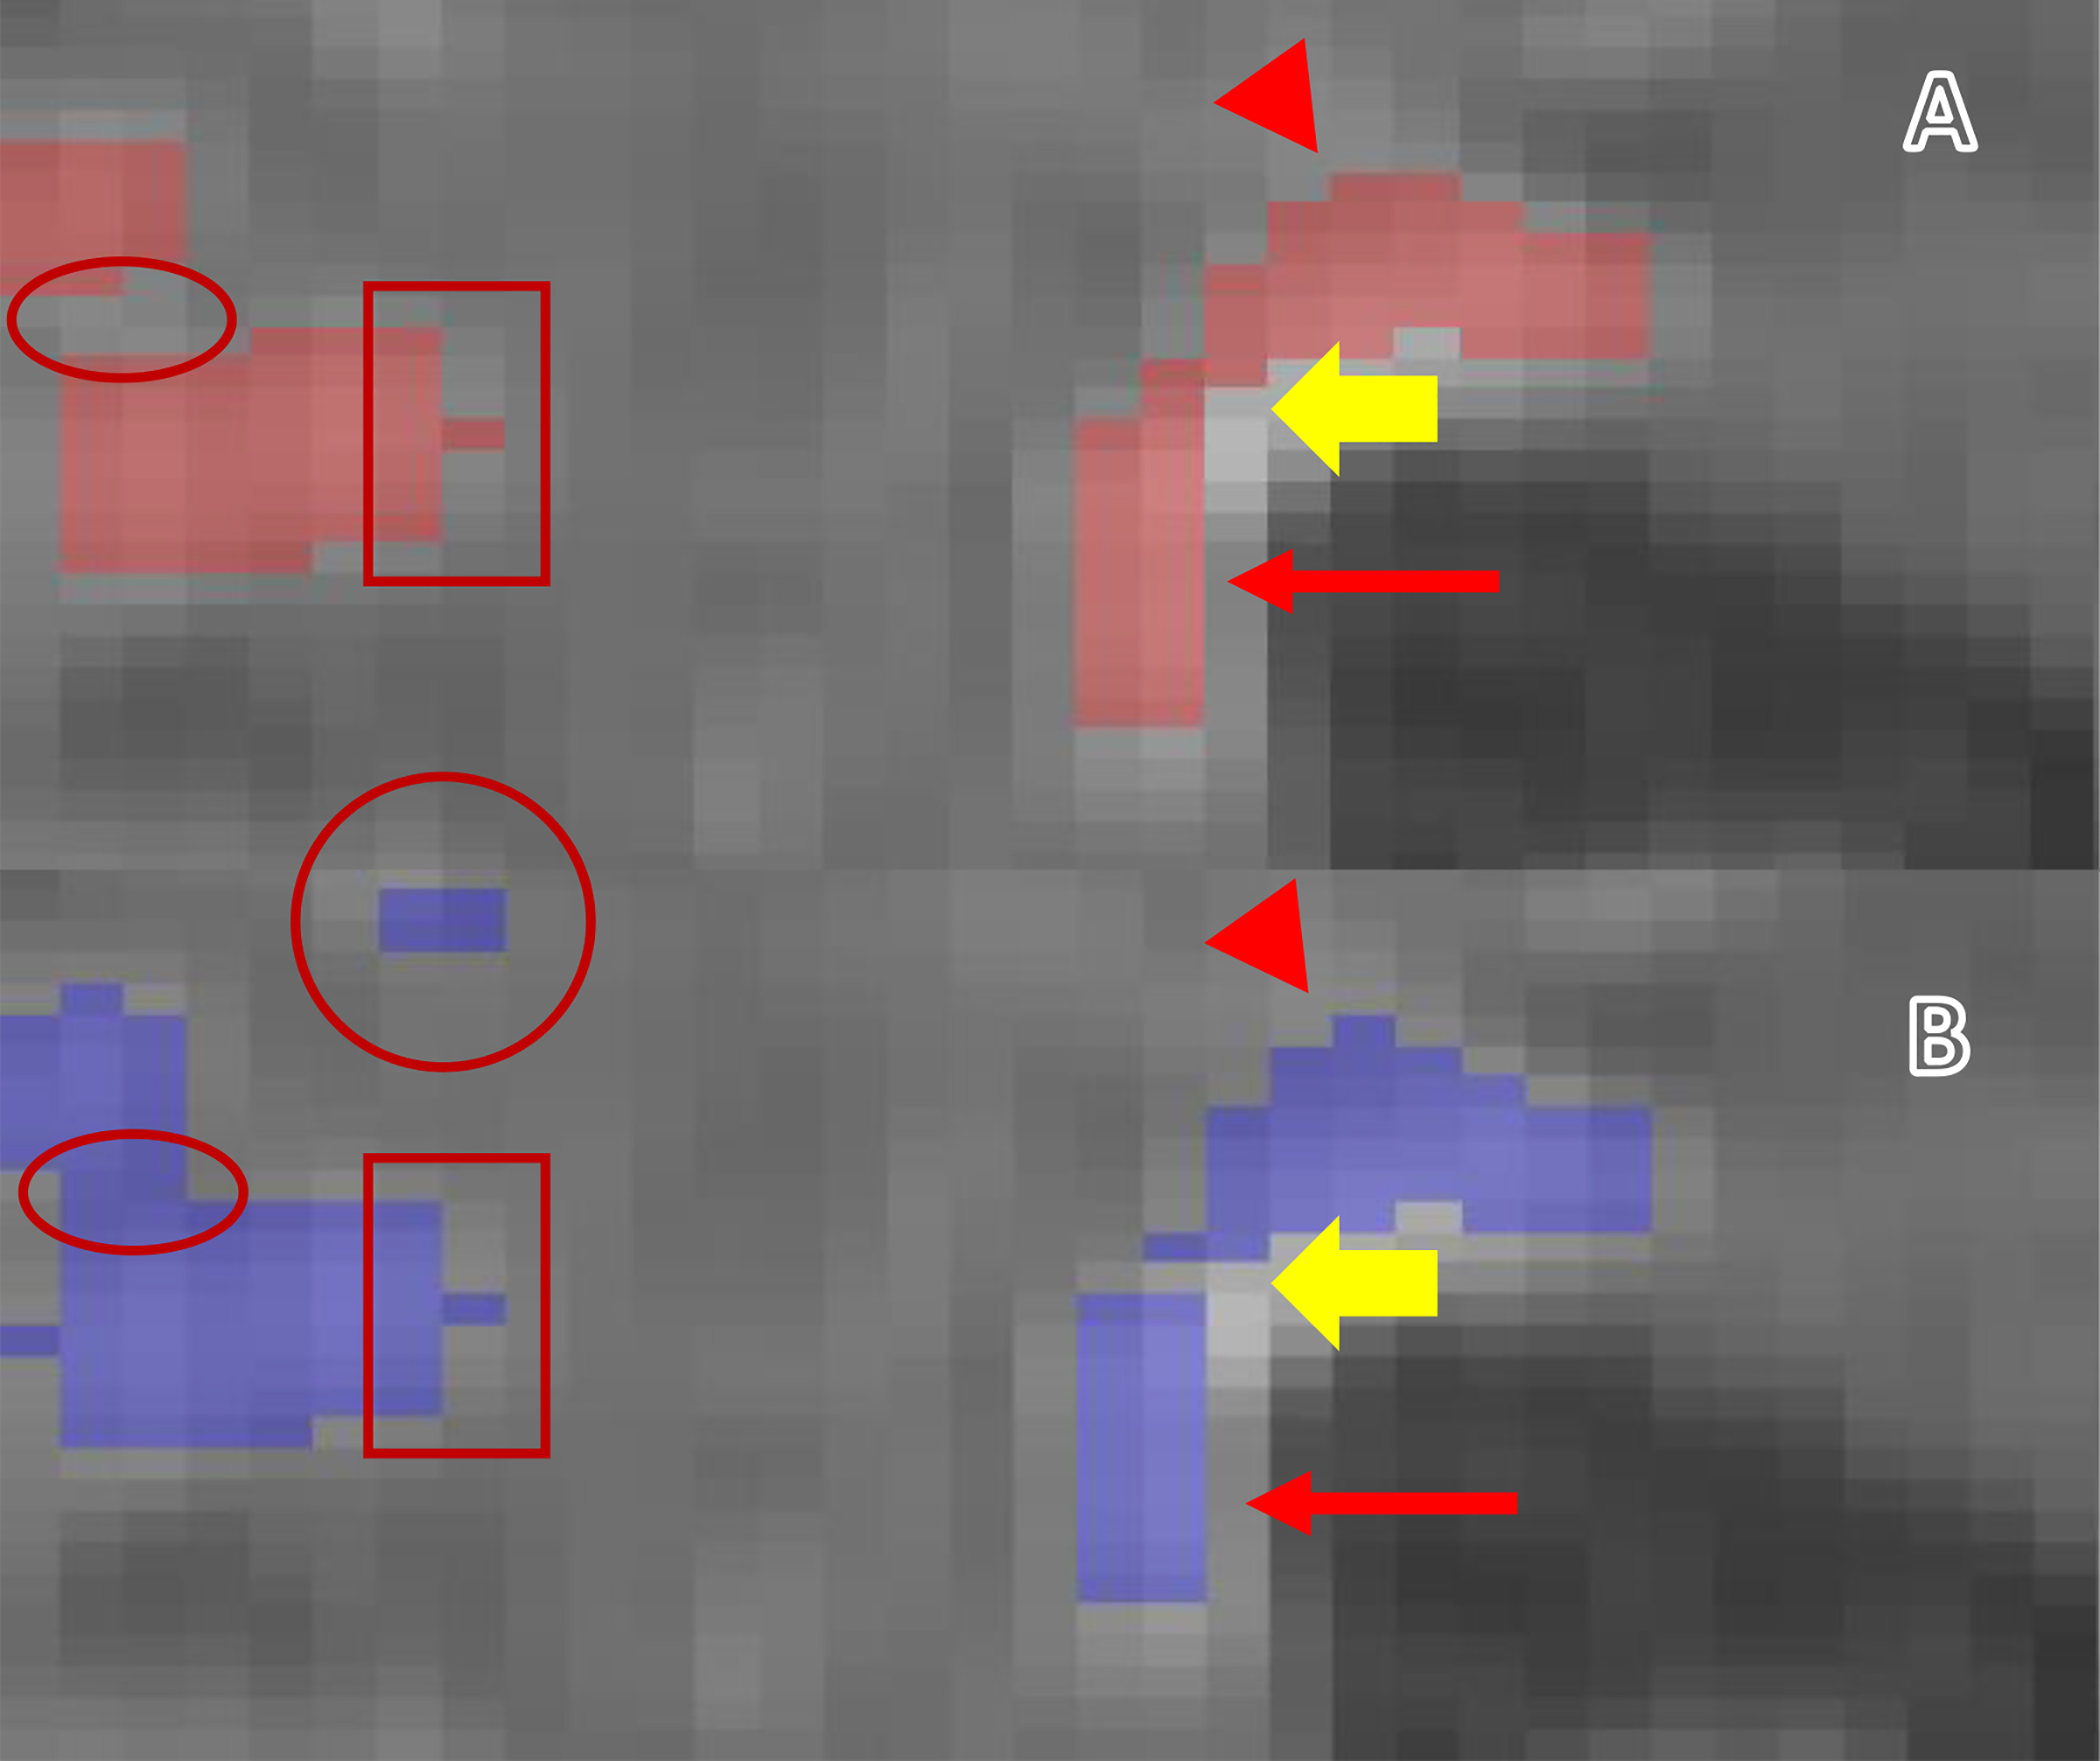
Comparison with existing method(s): This method presents a unique registration protocol for maximum tissue alignment, demonstrating three distinct patterns of longitudinal within-subject ΔWMH (stable, growth and regression).
Conclusions: These data detail the development and validation of a registration protocol for use in assessing within-subject, voxel-level alterations in WMH volume. The methods developed for registration and intensity correction of longitudinal within-subject FLAIR images allow regional and within-lesion characterization of longitudinal ΔWMH. Assessing the impact of associated cerebrovascular-risks and longitudinal clinical changes in relation to dynamic regional ΔWMH is needed in future studies.
Keywords: Aging; Cerebrovascular disease; Dementia; Longitudinal; Small vessel ischemic disease; White matter hyperintensity.
Copyright © 2021 Elsevier B.V. All rights reserved.
Conflict of interest statement
Figures
Similar articles
-
Longitudinal white matter hyperintensity changes and cognitive decline in patients with minor stroke.Aging Clin Exp Res. 2022 May;34(5):1047-1054. doi: 10.1007/s40520-021-02024-5. Epub 2022 Jan 27. Aging Clin Exp Res. 2022. PMID: 35084664 Free PMC article.
-
Hyperinsulinemia and elevated systolic blood pressure independently predict white matter hyperintensities with associated cognitive decrement in the middle-aged offspring of dementia patients.Metab Brain Dis. 2017 Jun;32(3):849-857. doi: 10.1007/s11011-017-9980-9. Epub 2017 Mar 3. Metab Brain Dis. 2017. PMID: 28255864
-
Automatic segmentation of white matter hyperintensities: validation and comparison with state-of-the-art methods on both Multiple Sclerosis and elderly subjects.Neuroimage Clin. 2022;33:102940. doi: 10.1016/j.nicl.2022.102940. Epub 2022 Jan 10. Neuroimage Clin. 2022. PMID: 35051744 Free PMC article.
-
Association of regional white matter hyperintensity volumes with cognitive dysfunction and vascular risk factors in patients with amnestic mild cognitive impairment.Geriatr Gerontol Int. 2021 Aug;21(8):644-650. doi: 10.1111/ggi.14211. Epub 2021 Jun 9. Geriatr Gerontol Int. 2021. PMID: 34105230 Free PMC article.
-
Rate of, and risk factors for, white matter hyperintensity growth: a systematic review and meta-analysis with implications for clinical trial design.J Neurol Neurosurg Psychiatry. 2021 Dec;92(12):1271-1277. doi: 10.1136/jnnp-2021-326569. Epub 2021 Aug 3. J Neurol Neurosurg Psychiatry. 2021. PMID: 34344790
Cited by
-
Multi-Site Cross-Site Inter-Rater and Test-Retest Reliability and Construct Validity of the MarkVCID White Matter Hyperintensity Growth and Regression Protocol.J Alzheimers Dis. 2023;96(2):683-693. doi: 10.3233/JAD-230629. J Alzheimers Dis. 2023. PMID: 37840499 Free PMC article.
-
Longitudinal Changes of White Matter Hyperintensities in Sporadic Small Vessel Disease: A Systematic Review and Meta-analysis.Neurology. 2022 Nov 29;99(22):e2454-e2463. doi: 10.1212/WNL.0000000000201205. Epub 2022 Sep 19. Neurology. 2022. PMID: 36123130 Free PMC article.
-
Advancing clinical trial readiness in white matter disease and related dementias: key steps for future research progress.Geroscience. 2025 Jul 21. doi: 10.1007/s11357-025-01805-4. Online ahead of print. Geroscience. 2025. PMID: 40690160
-
Longitudinal Cognitive Changes in Cerebral Small Vessel Disease: The Effect of White Matter Hyperintensity Regression and Progression.Neurology. 2025 Feb 25;104(4):e213323. doi: 10.1212/WNL.0000000000213323. Epub 2025 Feb 3. Neurology. 2025. PMID: 39899790 Free PMC article.
-
Correlation between white matter hyperintensity and delusional symptoms in Alzheimer's disease.BMC Psychiatry. 2023 Dec 6;23(1):914. doi: 10.1186/s12888-023-05420-5. BMC Psychiatry. 2023. PMID: 38057778 Free PMC article.
References
-
- Abner EL, Kryscio RJ, Schmitt FA, Fardo DW, Moga DC, Ighodaro ET, Jicha GA, Yu L, Dodge HH, Xiong C, Woltjer RL, Schneider JA, Cairns NJ, Bennett DA, and Nelson PT. 2017. “Outcomes after diagnosis of mild cognitive impairment in a large autopsy series.” Ann Neurol 81 (4):549–559. doi: 10.1002/ana.24903. - DOI - PMC - PubMed
-
- Al-Janabi OM, Bauer CE, Goldstein LB, Murphy RR, Bahrani AA, Smith CD, Wilcock DM, Gold BT, and Jicha GA. 2019. “White Matter Hyperintensity Regression: Comparison of Brain Atrophy and Cognitive Profiles with Progression and Stable Groups.” Brain Sci 9 (7). doi: 10.3390/brainsci9070170. - DOI - PMC - PubMed
-
- Association, American Psychiatric. 2013. Diagnostic and statistical manual of mental disorders (DSM-5®). Vol. 5. Arlington, VA: American Psychiatric Association.
Publication types
MeSH terms
Grants and funding
LinkOut - more resources
Full Text Sources
Medical
