

Quantifying heterogeneity in SARS-CoV-2 transmission during the lockdown in India
- PMID: 34171509
- PMCID: PMC8219474
- DOI: 10.1016/j.epidem.2021.100477
Quantifying heterogeneity in SARS-CoV-2 transmission during the lockdown in India
Abstract
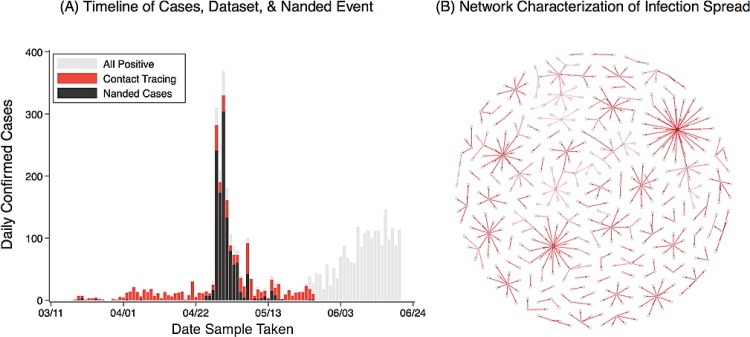
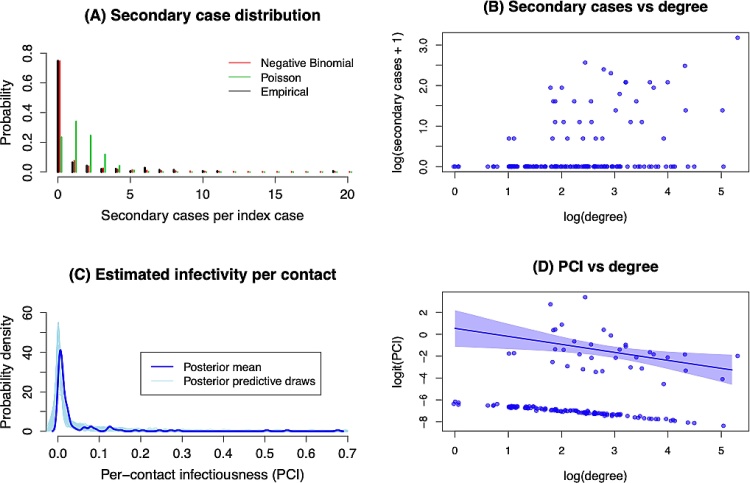
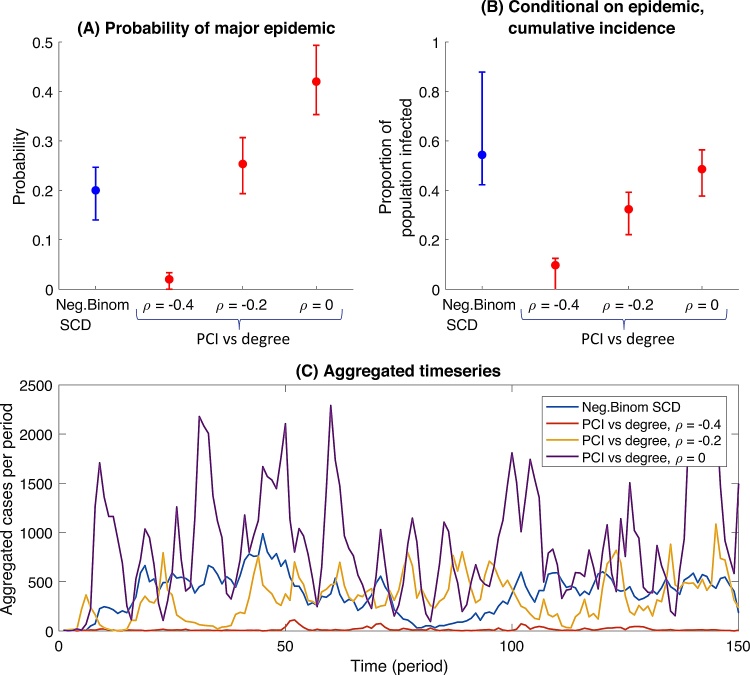
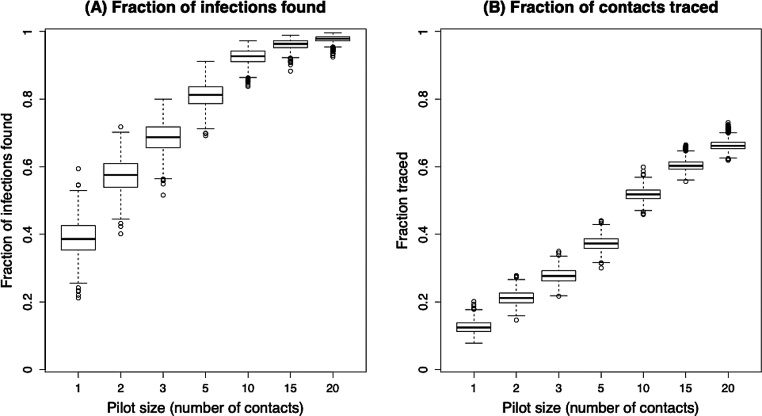
The novel SARS-CoV-2 virus, as it manifested in India in April 2020, showed marked heterogeneity in its transmission. Here, we used data collected from contact tracing during the lockdown in response to the first wave of COVID-19 in Punjab, a major state in India, to quantify this heterogeneity, and to examine implications for transmission dynamics. We found evidence of heterogeneity acting at multiple levels: in the number of potentially infectious contacts per index case, and in the per-contact risk of infection. Incorporating these findings in simple mathematical models of disease transmission reveals that these heterogeneities act in combination to strongly influence transmission dynamics. Standard approaches, such as representing heterogeneity through secondary case distributions, could be biased by neglecting these underlying interactions between heterogeneities. We discuss implications for policy, and for more efficient contact tracing in resource-constrained settings such as India. Our results highlight how contact tracing, an important public health measure, can also provide important insights into epidemic spread and control.
Keywords: COVID-19; Heterogeneity; SARS-CoV-2; Transmission dynamics.
Copyright © 2021 The Author(s). Published by Elsevier B.V. All rights reserved.
Conflict of interest statement
None.
Figures
Update of
-
Quantifying heterogeneity in SARS-CoV-2 transmission during the lockdown in India.medRxiv [Preprint]. 2020 Sep 15:2020.09.10.20190017. doi: 10.1101/2020.09.10.20190017. medRxiv. 2020. Update in: Epidemics. 2021 Sep;36:100477. doi: 10.1016/j.epidem.2021.100477. PMID: 32995809 Free PMC article. Updated. Preprint.
Similar articles
-
Quantifying heterogeneity in SARS-CoV-2 transmission during the lockdown in India.medRxiv [Preprint]. 2020 Sep 15:2020.09.10.20190017. doi: 10.1101/2020.09.10.20190017. medRxiv. 2020. Update in: Epidemics. 2021 Sep;36:100477. doi: 10.1016/j.epidem.2021.100477. PMID: 32995809 Free PMC article. Updated. Preprint.
-
Determining the optimal strategy for reopening schools, the impact of test and trace interventions, and the risk of occurrence of a second COVID-19 epidemic wave in the UK: a modelling study.Lancet Child Adolesc Health. 2020 Nov;4(11):817-827. doi: 10.1016/S2352-4642(20)30250-9. Epub 2020 Aug 3. Lancet Child Adolesc Health. 2020. PMID: 32758453 Free PMC article.
-
Social network analysis methods for exploring SARS-CoV-2 contact tracing data.BMC Med Res Methodol. 2020 Sep 17;20(1):233. doi: 10.1186/s12874-020-01119-3. BMC Med Res Methodol. 2020. PMID: 32942988 Free PMC article.
-
Heterogeneity in transmissibility and shedding SARS-CoV-2 via droplets and aerosols.Elife. 2021 Apr 16;10:e65774. doi: 10.7554/eLife.65774. Elife. 2021. PMID: 33861198 Free PMC article.
-
Effectiveness of Contact Tracing for Viral Disease Mitigation and Suppression: Evidence-Based Review.JMIR Public Health Surveill. 2021 Oct 6;7(10):e32468. doi: 10.2196/32468. JMIR Public Health Surveill. 2021. PMID: 34612841 Free PMC article. Review.
Cited by
-
Lessons from SARS-CoV-2 in India: A data-driven framework for pandemic resilience.Sci Adv. 2022 Jun 17;8(24):eabp8621. doi: 10.1126/sciadv.abp8621. Epub 2022 Jun 17. Sci Adv. 2022. PMID: 35714183 Free PMC article.
-
Cross fertilisation of Public Health and Translational Research.J Indian Inst Sci. 2022;102(2):763-782. doi: 10.1007/s41745-022-00317-w. Epub 2022 Aug 10. J Indian Inst Sci. 2022. PMID: 35968232 Free PMC article. Review.
-
Comparison of Public Health Containment Measures of COVID-19 in China and India.Risk Manag Healthc Policy. 2021 Aug 12;14:3323-3332. doi: 10.2147/RMHP.S326775. eCollection 2021. Risk Manag Healthc Policy. 2021. PMID: 34408516 Free PMC article.
-
Disease momentum: Estimating the reproduction number in the presence of superspreading.Infect Dis Model. 2021;6:706-728. doi: 10.1016/j.idm.2021.03.006. Epub 2021 Apr 2. Infect Dis Model. 2021. PMID: 33824936 Free PMC article.
-
Quantifying Mycobacterium tuberculosis Transmission Dynamics Across Global Settings: A Systematic Analysis.Am J Epidemiol. 2023 Jan 6;192(1):133-145. doi: 10.1093/aje/kwac181. Am J Epidemiol. 2023. PMID: 36227246 Free PMC article.
References
Publication types
MeSH terms
Grants and funding
LinkOut - more resources
Full Text Sources
Medical
Miscellaneous
