. 2021 Jun 25;53(1):54.
doi: 10.1186/s12711-021-00643-0.

Genetic variation in recombination rate in the pig

Affiliations

Genetic variation in recombination rate in the pig

Martin Johnsson et al. Genet Sel Evol. .

Abstract

Background: Meiotic recombination results in the exchange of genetic material between homologous chromosomes. Recombination rate varies between different parts of the genome, between individuals, and is influenced by genetics. In this paper, we assessed the genetic variation in recombination rate along the genome and between individuals in the pig using multilocus iterative peeling on 150,000 individuals across nine genotyped pedigrees. We used these data to estimate the heritability of recombination and perform a genome-wide association study of recombination in the pig.

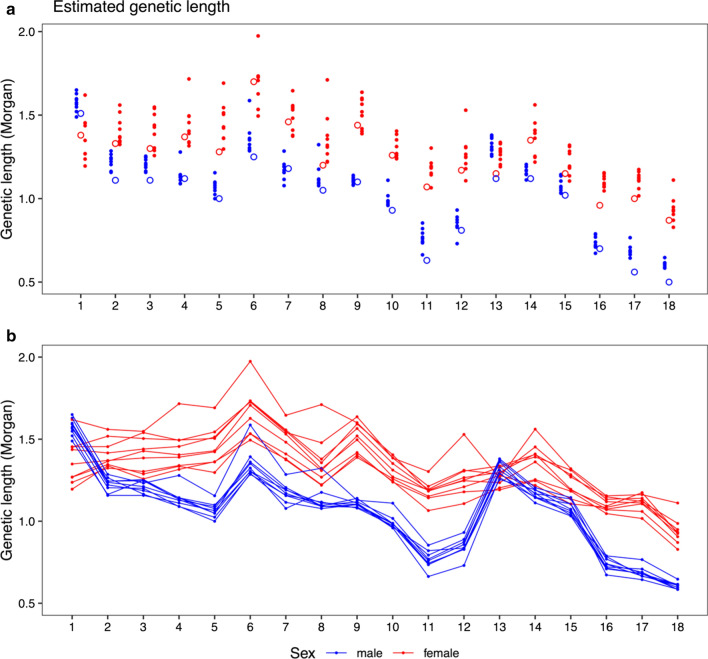
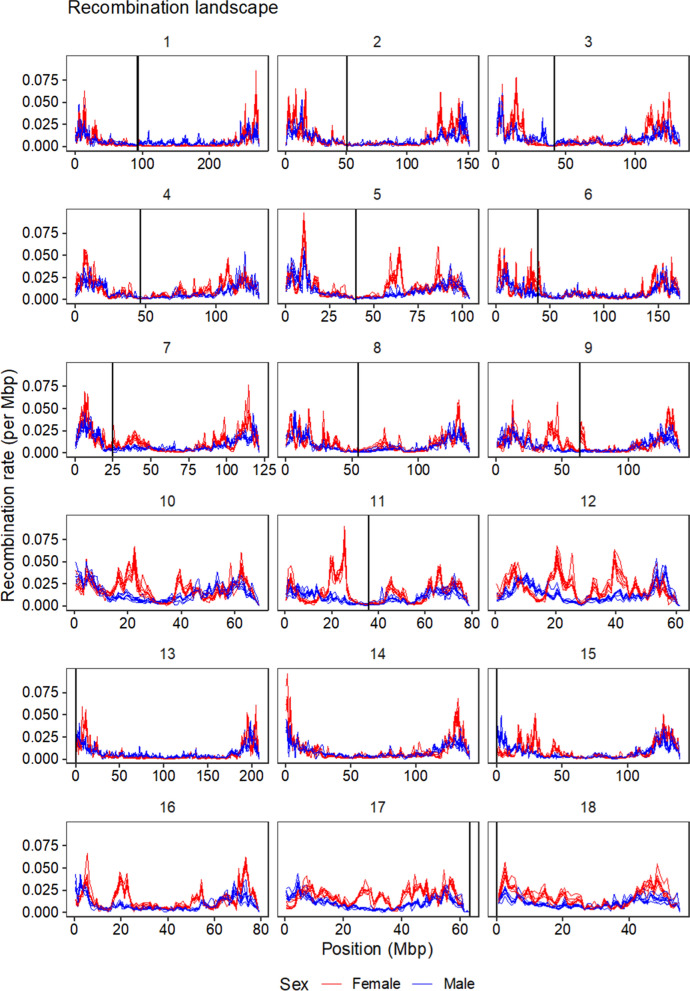
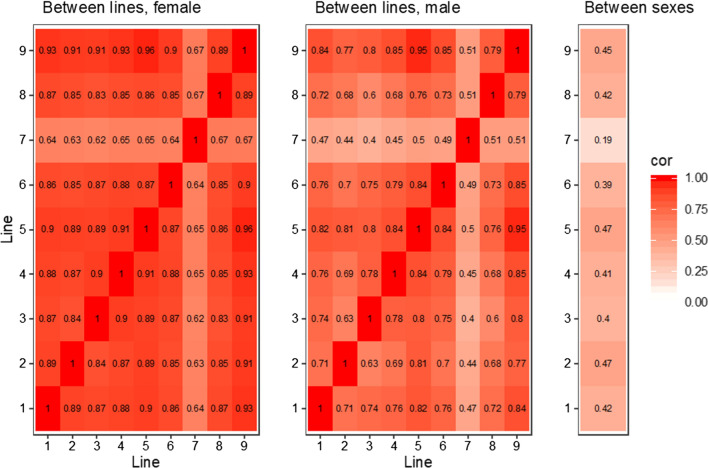
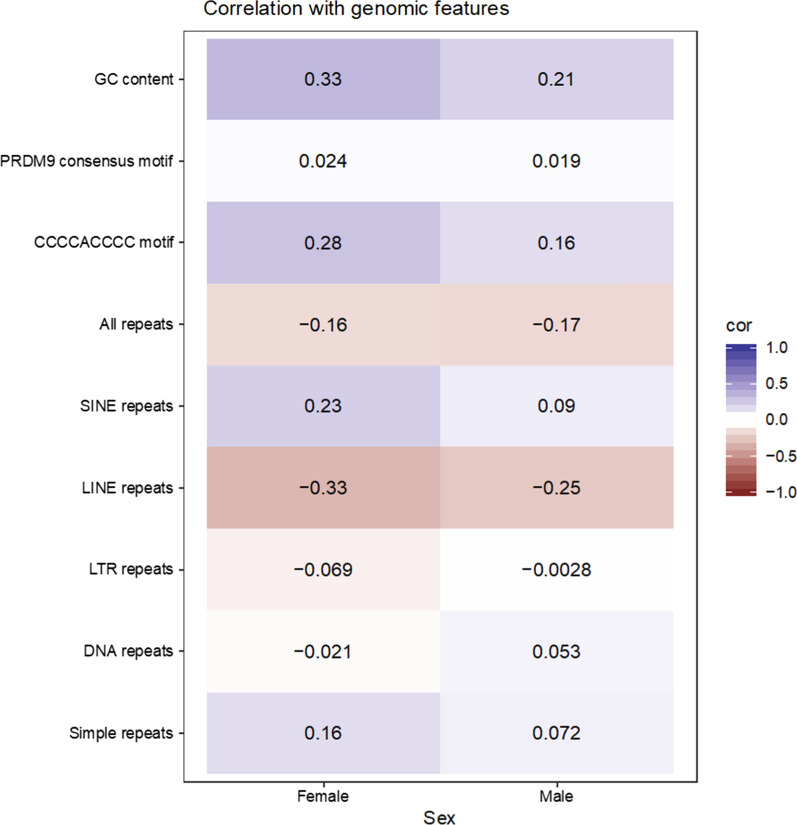
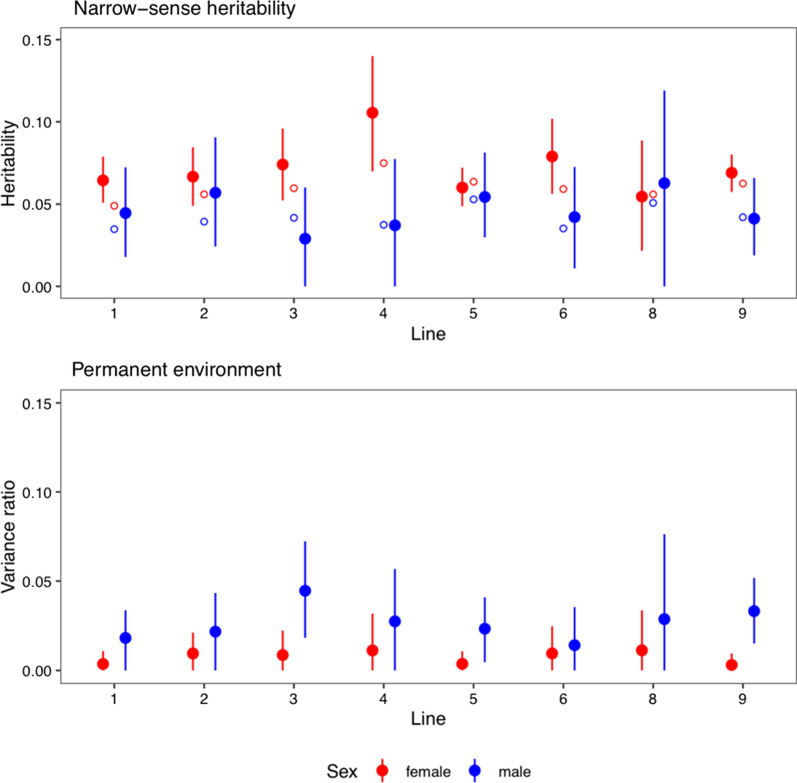
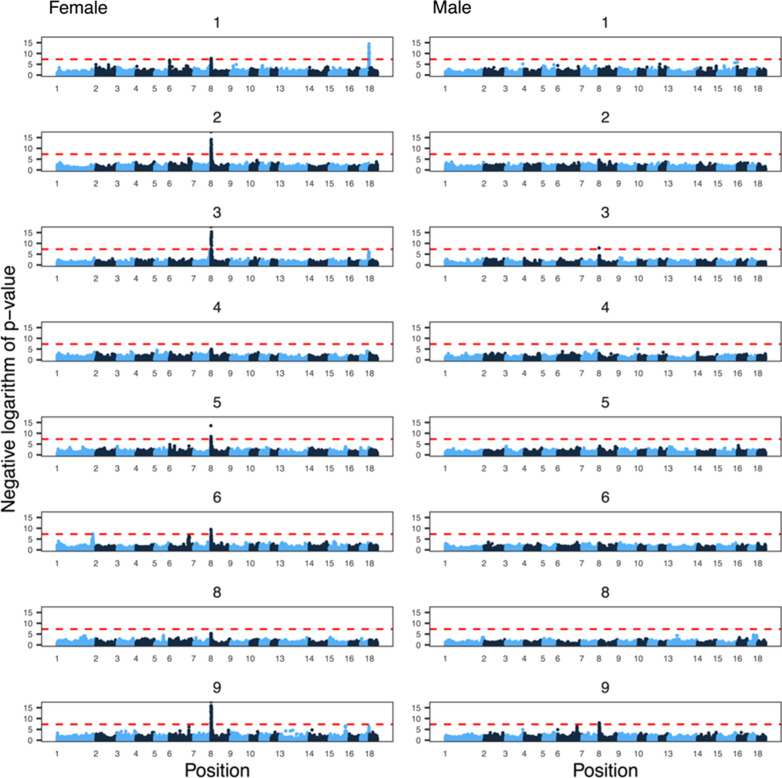
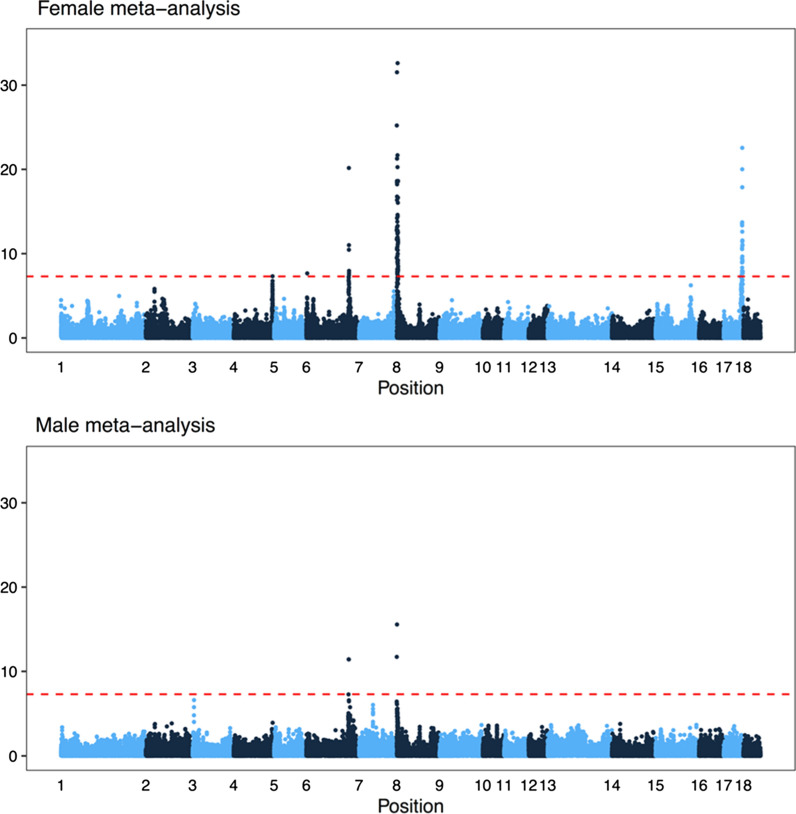
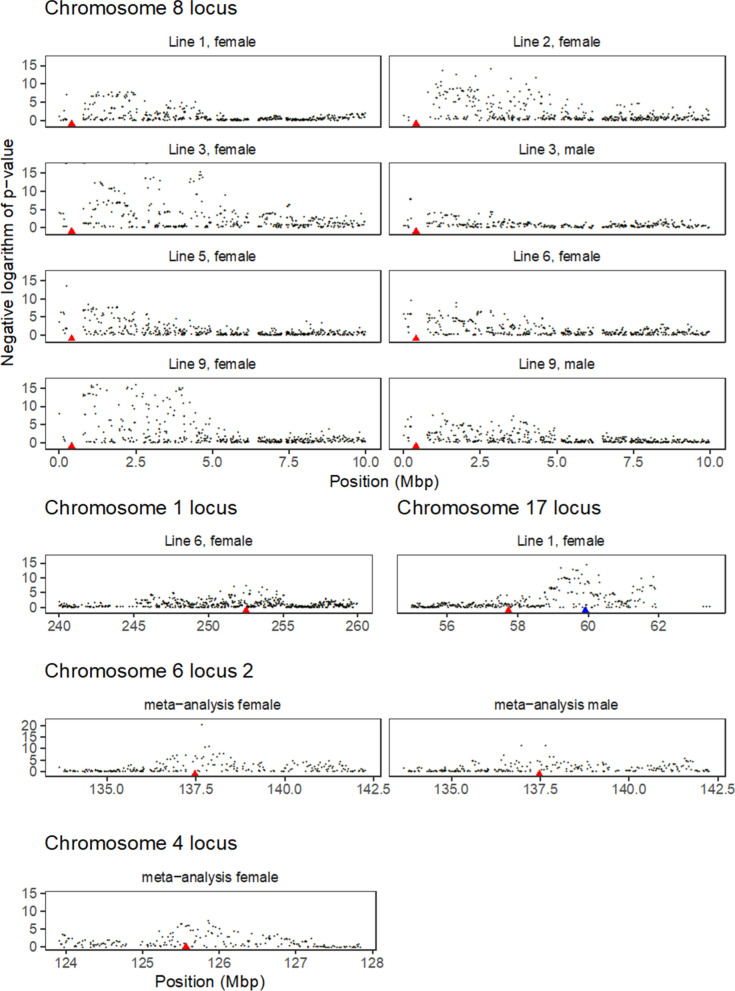
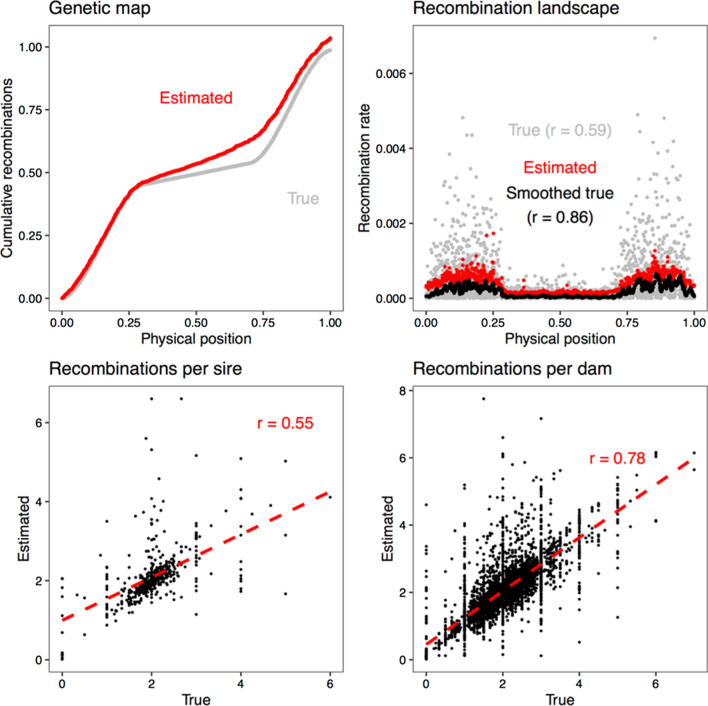
Results: Our results confirmed known features of the recombination landscape of the pig genome, including differences in genetic length of chromosomes and marked sex differences. The recombination landscape was repeatable between lines, but at the same time, there were differences in average autosome-wide recombination rate between lines. The heritability of autosome-wide recombination rate was low but not zero (on average 0.07 for females and 0.05 for males). We found six genomic regions that are associated with recombination rate, among which five harbour known candidate genes involved in recombination: RNF212, SHOC1, SYCP2, MSH4 and HFM1.

Conclusions: Our results on the variation in recombination rate in the pig genome agree with those reported for other vertebrates, with a low but nonzero heritability, and the identification of a major quantitative trait locus for recombination rate that is homologous to that detected in several other species. This work also highlights the utility of using large-scale livestock data to understand biological processes.


Conflict of interest statement

The authors declare that they have no competing interests.

Figures

Fig. 1
Fig. 1
Genetic length of pig autosomes estimated by multilocus iterative peeling. The horizontal axis corresponds to chromosomes 1–18. Red dots and lines are estimates for females and blue dots and lines are estimates for males. a compares estimates from multilocus iterative peeling (filled dots) to estimates from [1] (open circles). b shows the same data, using lines to connect estimates from the same line of pigs
Fig. 2
Fig. 2
Recombination landscape of the pig genome. The lines show recombination rate in 1-Mb windows along the pig genome (Sscrofa11.1). Red lines are estimates for females and blue lines are estimates for males. Each line corresponds to one of the nine breeding lines. The black vertical lines indicate predicted centromere locations in the reference genome, for chromosomes for which the information is available
Fig. 3
Fig. 3
Correlation heatmap of recombination landscapes between lines and sexes. Heatmaps show pairwise correlations between lines of the estimated recombination rates at each marker interval, within each sex, and the correlation between sexes within each line
Fig. 4
Fig. 4
Heatmap of correlations of recombination rates with genomic features in windows of 1 Mb. The heatmap shows correlations of recombination rates with sequence features within 2272 1-Mb windows along the autosomes of the pig genome (Sscrofa11.1)
Fig. 5
Fig. 5
Heritability of genome-wide recombination rates. The dots are estimates of narrow-sense heritability and of the permanent environmental effect variance proportion for genome-wide recombination rates based on an animal model, with 95% credible intervals. Red and blue are female and male estimates, respectively. Open circles show estimates of genomic heritability based on the genome-wide association analyses. Line 7 was excluded from the analysis because of its small number of dams and sires
Fig. 6
Fig. 6
Genome-wide association analysis of the genome-wide recombination rate. The subplots are Manhattan plots of the negative logarithm of the p-value of association against genomic position, broken down by line and sex. Alternating colours correspond to chromosomes 1 to 18. Line 7 was excluded from the analysis because of its small number of dams and sires. The dashed red line shows a conventional genome-wide significance threshold of 5 × 10−8. The numbers for chromosomes 11, 12 and 17 were removed for legibility
Fig. 7
Fig. 7
Meta-analysis of genome-wide association studies of genome-wide recombination rates. The subplots are Manhattan plots of the negative logarithm of the p-value of association against genomic position, separately for females and males. Alternating colours correspond to chromosomes 1 to 18. Line 7 was excluded from the analysis because of its small number of dams and sires. The dashed red line shows a conventional genome-wide significance threshold of 5 × 10−8
Fig. 8
Fig. 8
Significant genomic regions for recombination rate that contained candidate genes for recombination. The subplots are Manhattan plots of the negative logarithm of the p-value of association against genomic position, zoomed in to show the region around the significant markers. The red triangles show the locations of RNF212 (ENSSSCG00000045703) on chromosome 8, SHOC1 on chromosome 1 (ENSSSCG00000005463), SPO11 (ENSSSCG00000007502) in red and SYCP2 in blue on chromosome 17, MSH4 (ENSSSCG00000003775) on chromosome 6, and HFM1 (ENSSSCG00000006912) on chromosome 4
Fig. 9
Fig. 9
Estimation of recombination rates using simulated data. Cumulative number of recombination events, recombination landscape along the simulated chromosome, and correlation between true and estimated numbers of recombination events in sires and dams. The smoothed values are rolling averages of 50 markers. The red dashed line is the regression line between true and estimated values

References

    1. Stapley J, Feulner PG, Johnston SE, Santure AW, Smadja CM. Variation in recombination frequency and distribution across eukaryotes: patterns and processes. Philos Trans R Soc Lond B Biol Sci. 2017;372:20160455. doi: 10.1098/rstb.2016.0455. - DOI - PMC - PubMed
    1. Mugal CF, Weber CC, Ellegren H. GC-biased gene conversion links the recombination landscape and demography to genomic base composition: GC-biased gene conversion drives genomic base composition across a wide range of species. BioEssays. 2015;37:1317–1326. doi: 10.1002/bies.201500058. - DOI - PubMed
    1. Kong A, Gudbjartsson DF, Sainz J, Jonsdottir GM, Gudjonsson SA, Richardsson B, et al. A high-resolution recombination map of the human genome. Nat Genet. 2002;31:241–247. doi: 10.1038/ng917. - DOI - PubMed
    1. Kent TV, Uzunović J, Wright SI. Coevolution between transposable elements and recombination. Philos Trans R Soc Lond B Biol Sci. 2017;372:20160458. doi: 10.1098/rstb.2016.0458. - DOI - PMC - PubMed
    1. Brunschwig H, Levi L, Ben-David E, Williams RW, Yakir B, Shifman S. Fine-scale maps of recombination rates and hotspots in the mouse genome. Genetics. 2012;191:757–764. doi: 10.1534/genetics.112.141036. - DOI - PMC - PubMed

LinkOut - more resources