

A novel CT-based radiomics in the distinction of severity of coronavirus disease 2019 (COVID-19) pneumonia
- PMID: 34171991
- PMCID: PMC8231742
- DOI: 10.1186/s12879-021-06331-0
A novel CT-based radiomics in the distinction of severity of coronavirus disease 2019 (COVID-19) pneumonia
Abstract
Background: Convenient and precise assessment of the severity in coronavirus disease 2019 (COVID-19) contributes to the timely patient treatment and prognosis improvement. We aimed to evaluate the ability of CT-based radiomics nomogram in discriminating the severity of patients with COVID-19 Pneumonia.
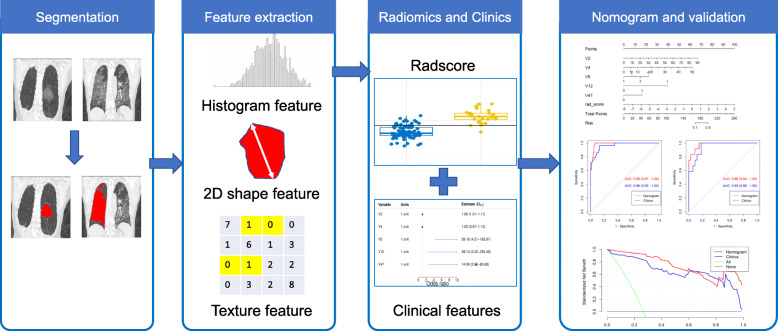
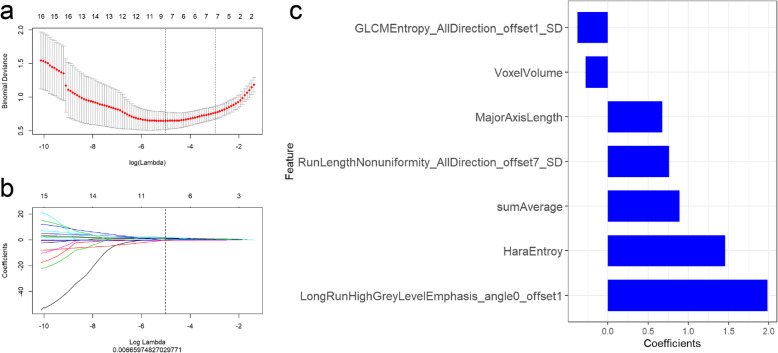
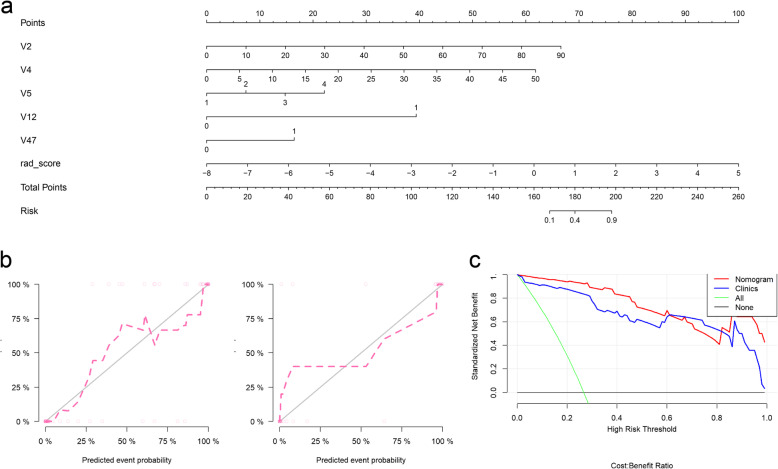
Methods: A total of 150 patients (training cohort n = 105; test cohort n = 45) with COVID-19 confirmed by reverse transcription polymerase chain reaction (RT-PCR) test were enrolled. Two feature selection methods, Max-Relevance and Min-Redundancy (mRMR) and least absolute shrinkage and selection operator (LASSO), were used to extract features from CT images and construct model. A total of 30 radiomic features were finally retained. Rad-score was calculated by summing the selected features weighted by their coefficients. The radiomics nomogram incorporating clinical-radiological features was eventually constructed by multivariate regression analysis. Nomogram, calibration, and decision-curve analysis were all assessed.
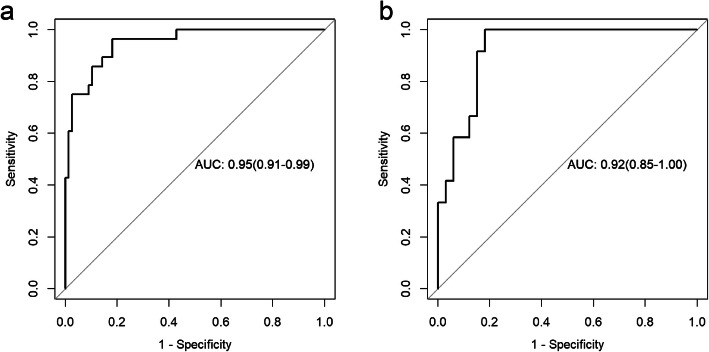
Results: In both cohorts, 40 patients with COVID-19 pneumonia were severe and 110 patients were non-severe. By combining the 30 radiomic features extracted from CT images, the radiomics signature showed high discrimination between severe and non-severe patients in the training set [Area Under the Curve (AUC), 0.857; 95% confidence interval (CI), 0.775-0.918] and the test set (AUC, 0.867; 95% CI, 0.732-949). The final combined model that integrated age, comorbidity, CT scores, number of lesions, ground glass opacity (GGO) with consolidation, and radiomics signature, improved the AUC to 0.952 in the training cohort and 0.98 in the test cohort. The nomogram based on the combined model similarly exhibited excellent discrimination performance in both training and test cohorts.
Conclusions: The developed model based on a radiomics signature derived from CT images can be a reliable marker for discriminating the severity of COVID-19 pneumonia.
Keywords: COVID-19; Nomogram; Radiomics; Tomography; X-ray computed.
Conflict of interest statement
The authors declared that there is no conflict of interest.
Figures
Similar articles
-
CT-based radiomic nomogram for predicting the severity of patients with COVID-19.Eur J Med Res. 2022 Jan 25;27(1):13. doi: 10.1186/s40001-022-00634-x. Eur J Med Res. 2022. PMID: 35078525 Free PMC article.
-
Development and multicenter validation of a CT-based radiomics signature for predicting severe COVID-19 pneumonia.Eur Radiol. 2021 Oct;31(10):7901-7912. doi: 10.1007/s00330-021-07727-x. Epub 2021 Mar 30. Eur Radiol. 2021. PMID: 33786655 Free PMC article.
-
Radiomics nomogram for the prediction of 2019 novel coronavirus pneumonia caused by SARS-CoV-2.Eur Radiol. 2020 Dec;30(12):6888-6901. doi: 10.1007/s00330-020-07032-z. Epub 2020 Jul 3. Eur Radiol. 2020. PMID: 32621237 Free PMC article.
-
A CT-based radiomics nomogram for predicting prognosis of coronavirus disease 2019 (COVID-19) radiomics nomogram predicting COVID-19.Br J Radiol. 2021 Jan 1;94(1117):20200634. doi: 10.1259/bjr.20200634. Epub 2020 Dec 9. Br J Radiol. 2021. PMID: 33296222 Free PMC article.
-
CT radiomics facilitates more accurate diagnosis of COVID-19 pneumonia: compared with CO-RADS.J Transl Med. 2021 Jan 7;19(1):29. doi: 10.1186/s12967-020-02692-3. J Transl Med. 2021. PMID: 33413480 Free PMC article.
Cited by
-
Prediction of potential severe coronavirus disease 2019 patients based on CT radiomics: A retrospective study.Med Phys. 2022 Sep;49(9):5886-5898. doi: 10.1002/mp.15841. Epub 2022 Jul 28. Med Phys. 2022. PMID: 35837868 Free PMC article. Clinical Trial.
-
Facilitating standardized COVID-19 suspicion prediction based on computed tomography radiomics in a multi-demographic setting.Eur Radiol. 2022 Sep;32(9):6384-6396. doi: 10.1007/s00330-022-08730-6. Epub 2022 Apr 1. Eur Radiol. 2022. PMID: 35362751 Free PMC article.
-
The severity assessment and nucleic acid turning-negative-time prediction in COVID-19 patients with COPD using a fused deep learning model.BMC Pulm Med. 2024 Oct 14;24(1):515. doi: 10.1186/s12890-024-03333-x. BMC Pulm Med. 2024. PMID: 39402509 Free PMC article.
-
A meta-analysis of the diagnostic test accuracy of CT-based radiomics for the prediction of COVID-19 severity.Radiol Med. 2022 Jul;127(7):754-762. doi: 10.1007/s11547-022-01510-8. Epub 2022 Jun 22. Radiol Med. 2022. PMID: 35731375 Free PMC article.
-
CT radiomics model combined with clinical and radiographic features for discriminating peripheral small cell lung cancer from peripheral lung adenocarcinoma.Front Oncol. 2023 Mar 20;13:1157891. doi: 10.3389/fonc.2023.1157891. eCollection 2023. Front Oncol. 2023. PMID: 37020864 Free PMC article.
References
-
- Zhu N, Zhang D, Wang W, Li X, Yang B, Song J, Zhao X, Huang B, Shi W, Lu R, Niu P, Zhan F, Ma X, Wang D, Xu W, Wu G, Gao GF, Tan W, China Novel Coronavirus Investigating and Research Team A novel coronavirus from patients with pneumonia in China, 2019. N Engl J Med. 2020;382(8):727–733. doi: 10.1056/NEJMoa2001017. - DOI - PMC - PubMed
MeSH terms
LinkOut - more resources
Full Text Sources
Medical
