

OLIG2 regulates lncRNAs and its own expression during oligodendrocyte lineage formation
- PMID: 34172044
- PMCID: PMC8235854
- DOI: 10.1186/s12915-021-01057-6
OLIG2 regulates lncRNAs and its own expression during oligodendrocyte lineage formation
Abstract
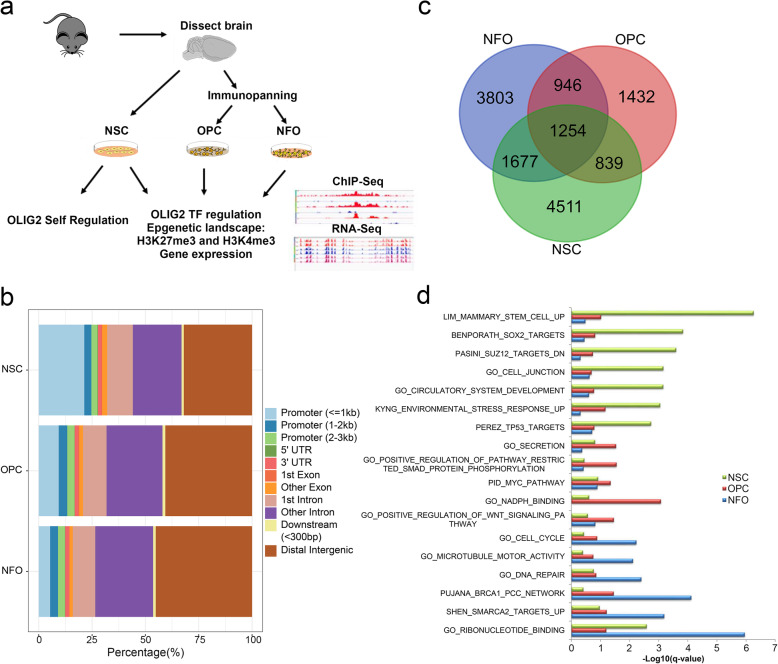
Background: Oligodendrocytes, responsible for axon ensheathment, are critical for central nervous system (CNS) development, function, and diseases. OLIG2 is an important transcription factor (TF) that acts during oligodendrocyte development and performs distinct functions at different stages. Previous studies have shown that lncRNAs (long non-coding RNAs; > 200 bp) have important functions during oligodendrocyte development, but their roles have not been systematically characterized and their regulation is not yet clear.
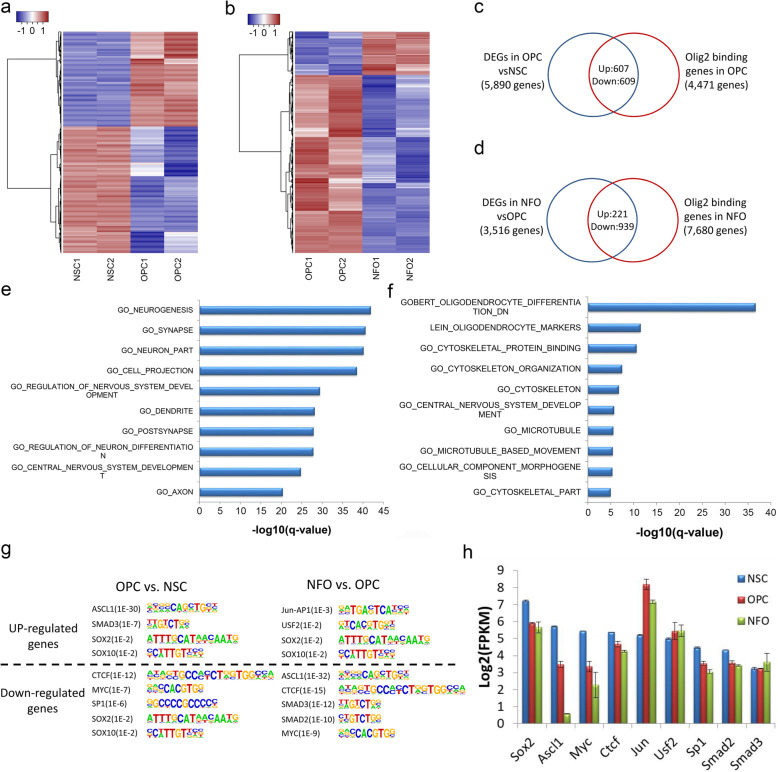
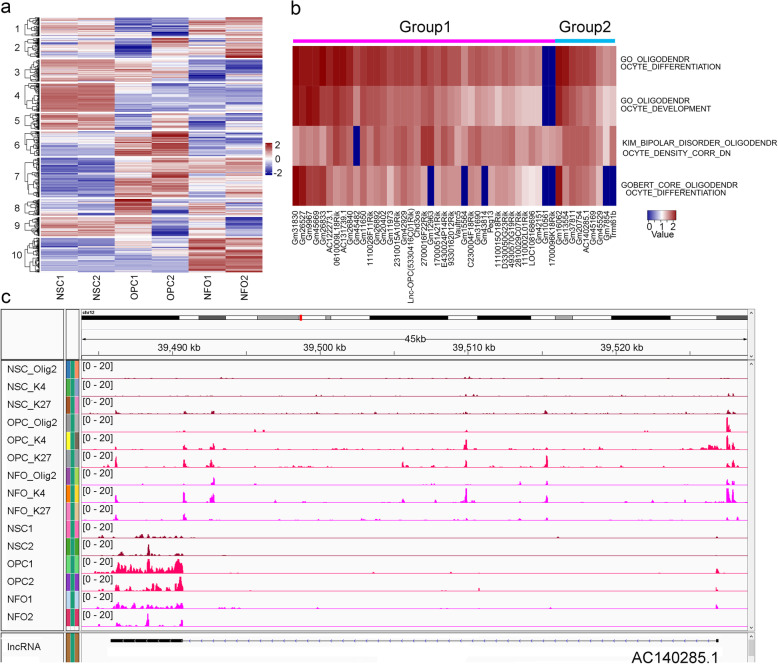
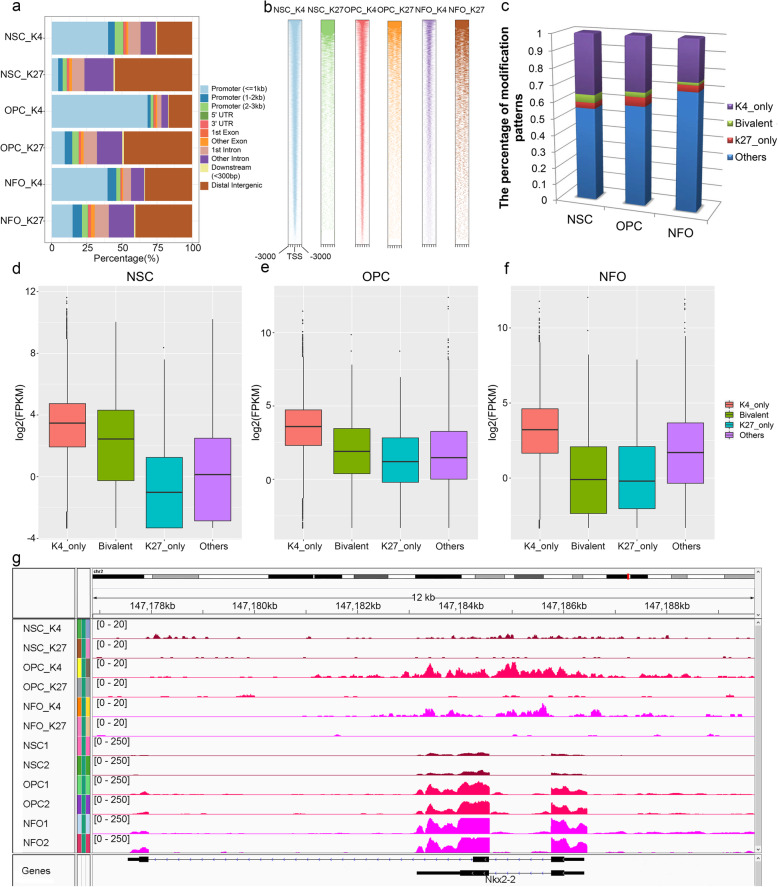
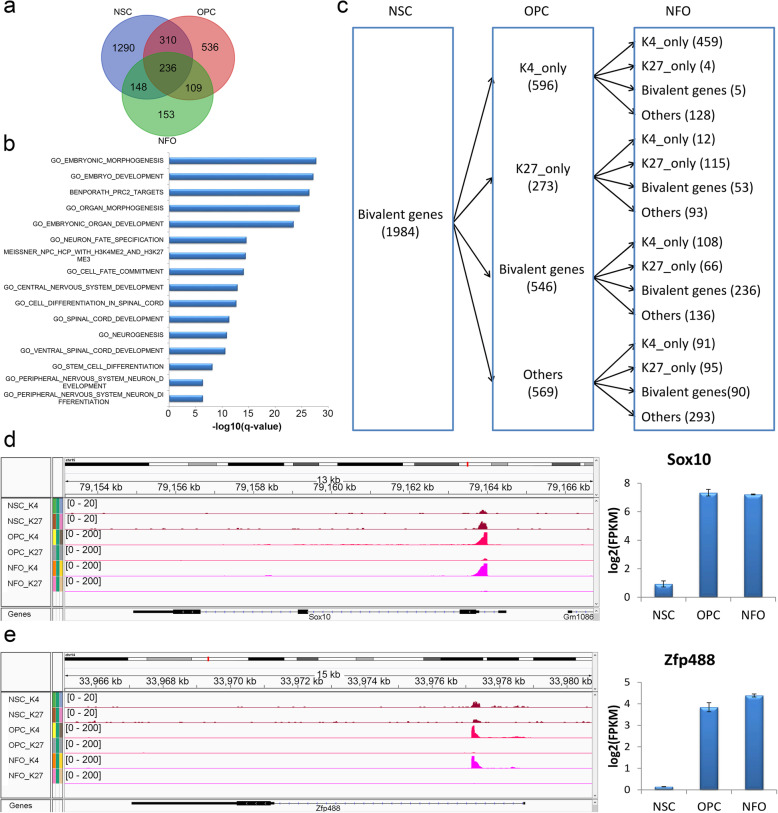
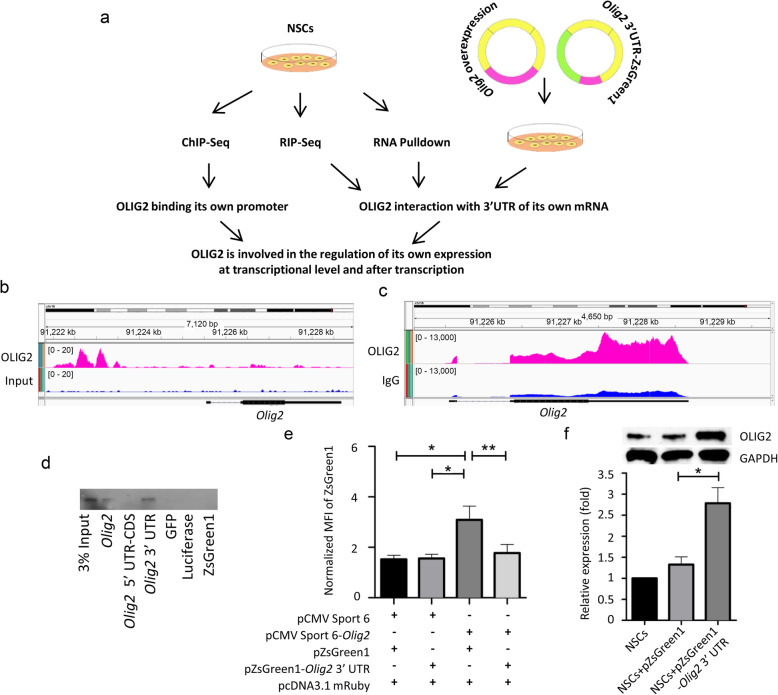
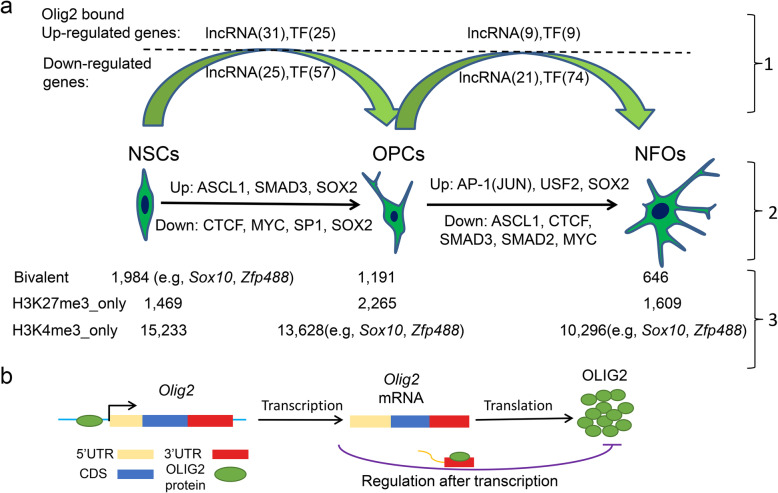
Results: We performed an integrated study of genome-wide OLIG2 binding and the epigenetic modification status of both coding and non-coding genes during three stages of oligodendrocyte differentiation in vivo: neural stem cells (NSCs), oligodendrocyte progenitor cells (OPCs), and newly formed oligodendrocytes (NFOs). We found that 613 lncRNAs have OLIG2 binding sites and are expressed in at least one cell type, which can potentially be activated or repressed by OLIG2. Forty-eight of them have increased expression in oligodendrocyte lineage cells. Predicting lncRNA functions by using a "guilt-by-association" approach revealed that the functions of these 48 lncRNAs were enriched in "oligodendrocyte development and differentiation." Additionally, bivalent genes are known to play essential roles during embryonic stem cell differentiation. We identified bivalent genes in NSCs, OPCs, and NFOs and found that some bivalent genes bound by OLIG2 are dynamically regulated during oligodendrocyte development. Importantly, we unveiled a previously unknown mechanism that, in addition to transcriptional regulation via DNA binding, OLIG2 could self-regulate through the 3' UTR of its own mRNA.
Conclusions: Our studies have revealed the missing links in the mechanisms regulating oligodendrocyte development at the transcriptional level and after transcription. The results of our research have improved the understanding of fundamental cell fate decisions during oligodendrocyte lineage formation, which can enable insights into demyelination diseases and regenerative medicine.
Keywords: Histone modification; LncRNAs; OLIG2; Oligodendrocyte development; Regulation after transcription; Transcriptional regulation.
Conflict of interest statement
The authors declare they have no competing interests.
Figures
Similar articles
-
Comprehensive Identification of Long Non-coding RNAs in Purified Cell Types from the Brain Reveals Functional LncRNA in OPC Fate Determination.PLoS Genet. 2015 Dec 18;11(12):e1005669. doi: 10.1371/journal.pgen.1005669. eCollection 2015 Dec. PLoS Genet. 2015. PMID: 26683846 Free PMC article.
-
Enhancing oligodendrocyte differentiation by transient transcription activation via DNA nanoparticle-mediated transfection.Acta Biomater. 2017 May;54:249-258. doi: 10.1016/j.actbio.2017.03.032. Epub 2017 Mar 23. Acta Biomater. 2017. PMID: 28344151 Free PMC article.
-
Olig2 overexpression induces the in vitro differentiation of neural stem cells into mature oligodendrocytes.Stem Cells. 2006 Apr;24(4):1001-10. doi: 10.1634/stemcells.2005-0239. Epub 2005 Oct 27. Stem Cells. 2006. PMID: 16253982
-
Olig gene function in CNS development and disease.Glia. 2006 Jul;54(1):1-10. doi: 10.1002/glia.20273. Glia. 2006. PMID: 16652341 Review.
-
[Common mechanism underlying oligodendrocyte development and oligodendrogliomagenesis].Brain Nerve. 2009 Jul;61(7):741-51. Brain Nerve. 2009. PMID: 19618851 Review. Japanese.
Cited by
-
Olig2 Ablation in Immature Oligodendrocytes Does Not Enhance CNS Myelination and Remyelination.J Neurosci. 2022 Nov 9;42(45):8542-8555. doi: 10.1523/JNEUROSCI.0237-22.2022. Epub 2022 Oct 5. J Neurosci. 2022. PMID: 36198499 Free PMC article.
-
The epigenetic landscape of oligodendrocyte lineage cells.Ann N Y Acad Sci. 2023 Apr;1522(1):24-41. doi: 10.1111/nyas.14959. Epub 2023 Feb 5. Ann N Y Acad Sci. 2023. PMID: 36740586 Free PMC article. Review.
-
Lysophosphatidic acid receptor 6 regulated by miR-27a-3p attenuates tumor proliferation in breast cancer.Clin Transl Oncol. 2022 Mar;24(3):503-516. doi: 10.1007/s12094-021-02704-8. Epub 2021 Sep 12. Clin Transl Oncol. 2022. PMID: 34510318 Free PMC article.
-
Oligodendroglia heterogeneity in the human central nervous system.Acta Neuropathol. 2022 Feb;143(2):143-157. doi: 10.1007/s00401-021-02390-4. Epub 2021 Dec 3. Acta Neuropathol. 2022. PMID: 34860266 Free PMC article. Review.
-
Oligodendrocyte-specific expression of PSG8-AS1 suggests a role in myelination with prognostic value in oligodendroglioma.Noncoding RNA Res. 2024 Jun 10;9(4):1061-1068. doi: 10.1016/j.ncrna.2024.06.008. eCollection 2024 Dec. Noncoding RNA Res. 2024. PMID: 39022681 Free PMC article.
References
Publication types
MeSH terms
Substances
Grants and funding
LinkOut - more resources
Full Text Sources
Molecular Biology Databases
Miscellaneous
