

Retrospective analysis of recurrence patterns and clinical outcome of grade II meningiomas following postoperative radiotherapy
- PMID: 34172069
- PMCID: PMC8235826
- DOI: 10.1186/s13014-021-01825-2
Retrospective analysis of recurrence patterns and clinical outcome of grade II meningiomas following postoperative radiotherapy
Abstract
Background: Atypical meningiomas exhibit a high tendency for tumor recurrence even after multimodal therapy. Information regarding recurrence patterns after additive radiotherapy is scarce but could improve radiotherapy planning and therapy decision. We conducted an analysis of recurrence patterns with regard to target volumes and dose coverage assessing target volume definition and postulated areas of tumor re-growth origin. Prognostic factors contributing to relapse were evaluated.
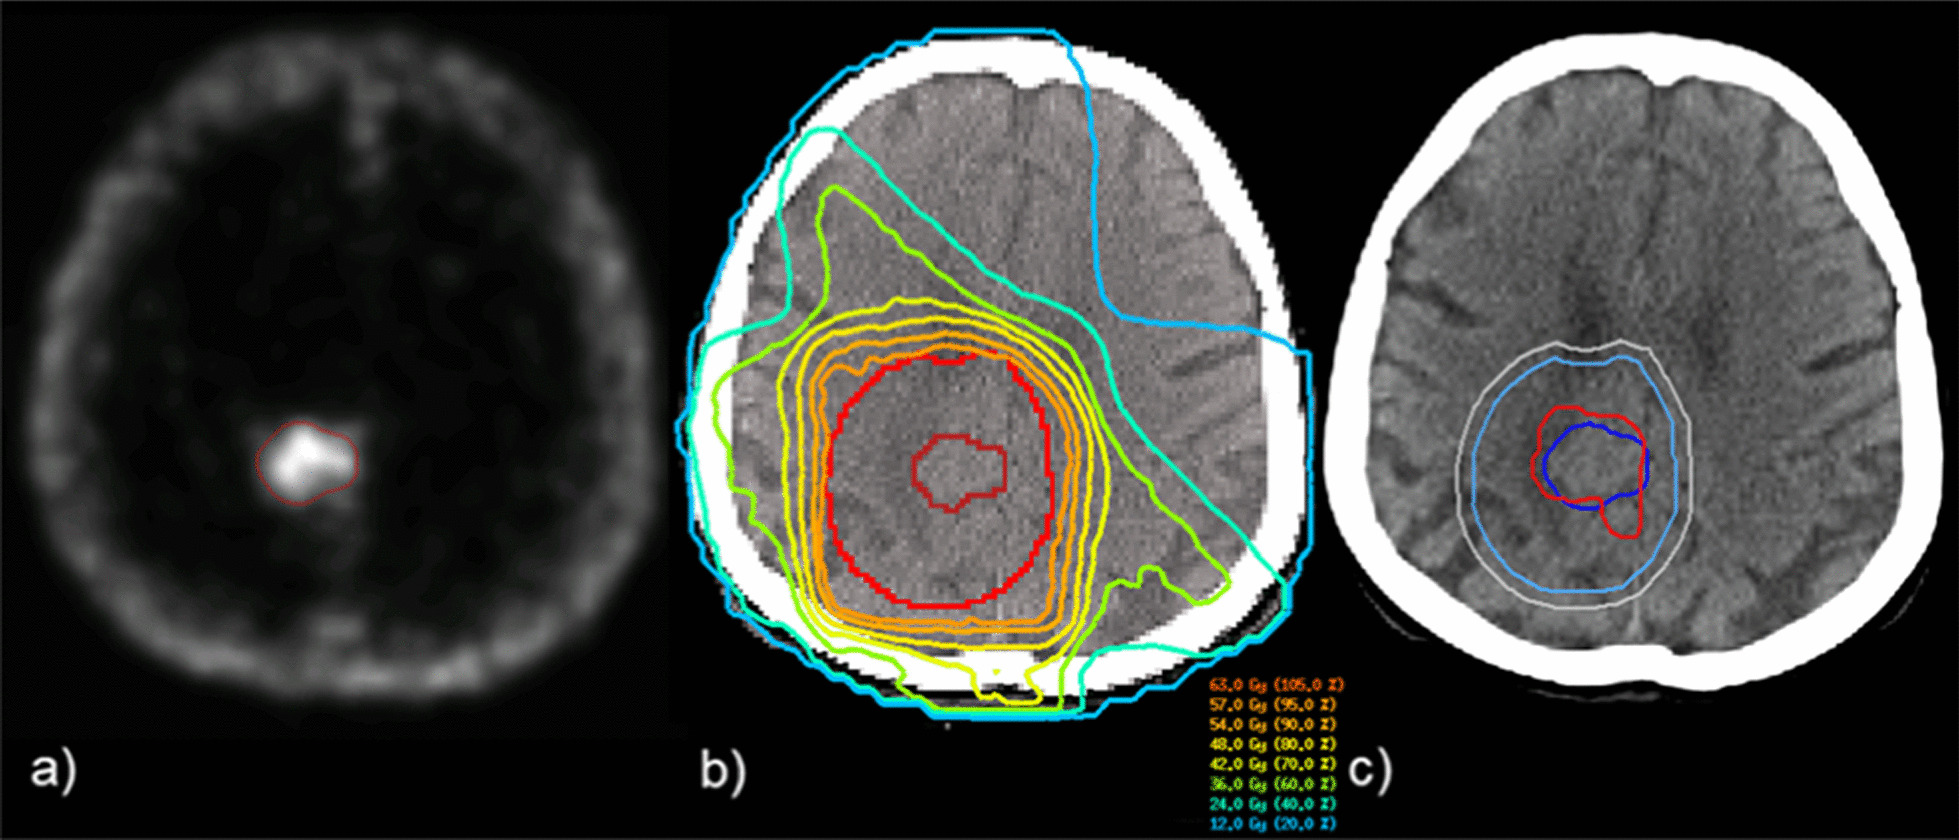
Methods: The clinical outcome of patients who had completed additive, somatostatin receptor (SSTR)-PET/CT-based fractionated intensity-modulated radiotherapy for atypical meningioma between 2007 and 2017 was analyzed. In case of tumor recurrence/progression, treatment planning was evaluated for coverage of the initial target volumes and the recurrent tumor tissue. We proposed a model evaluating the dose distribution in postulated areas of tumor re-growth origin. The median of proliferation marker MIB-1 was assessed as a prognostic factor for local progression and new distant tumor lesions.
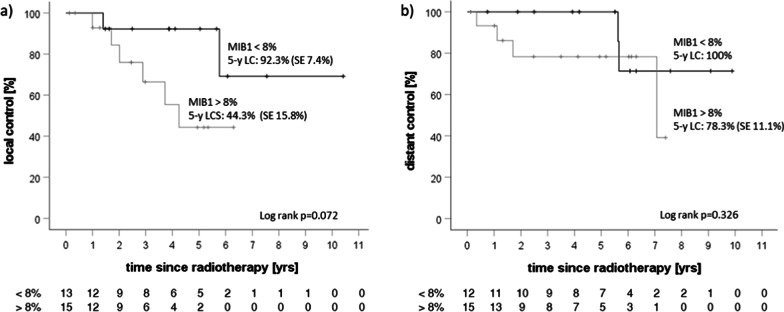
Results: Data from 31 patients who had received adjuvant (n = 11) or salvage radiotherapy (n = 20) were evaluated. Prescribed dose ranged from 54.0 to 60.0 Gy. Local control at five years was 67.9%. Analysis of treatment plans of the eight patients experiencing local failure proved sufficient extent of target volumes and coverage of the prescribed dose of at least 50.0 Gy as determined by mean dose, D98, D2, and equivalent uniform dose (EUD) of all initial target volumes, postulated growth-areas, and areas of recurrent tumor tissue. In all cases, local failure occurred in high-dose volumes. Tumors with a MIB-1 expression above the median (8%) showed a higher tendency for re-growth.
Conclusions: The model showed adequate target volume and relative dose distribution but absolute dose appears lower in recurrent tumors without reaching statistical significance. This might provide a rationale for dose escalation studies. Biological factors such as MIB-1 might aid patients' stratification for dose escalation.
Keywords: Additive radiotherapy; Atypical meningioma; MIB-1; Recurrence pattern analysis; SSTR-PET/CT; Treatment planning.
Conflict of interest statement
GT reports personal fees (advisory board, speaker`s fees) from AbbVie, Bayer, Bristol-Myers-Squibb, Medac, Novocure, travel grants from Bristol-Myers-Squibb, educational and travel grants from Novocure, research grants from Roche Diagnostics, research and travel grants from Medac. The other authors declare no competing interests.
Figures


Similar articles
-
Evaluation of particle radiotherapy for the re-irradiation of recurrent intracranial meningioma.Radiat Oncol. 2018 May 8;13(1):86. doi: 10.1186/s13014-018-1026-x. Radiat Oncol. 2018. PMID: 29739417 Free PMC article.
-
Recurrence pattern analysis after [68Ga]-DOTATATE-PET/CT -planned radiotherapy of high-grade meningiomas.Radiat Oncol. 2018 Jun 14;13(1):110. doi: 10.1186/s13014-018-1056-4. Radiat Oncol. 2018. PMID: 29898747 Free PMC article.
-
68Ga-DOTATATE PET-CT as a tool for radiation planning and evaluating treatment responses in the clinical management of meningiomas.Radiat Oncol. 2021 Aug 16;16(1):151. doi: 10.1186/s13014-021-01875-6. Radiat Oncol. 2021. PMID: 34399805 Free PMC article.
-
Fractionated stereotactic radiation therapy in the management of benign cavernous sinus meningiomas : long-term experience and review of the literature.Strahlenther Onkol. 2006 Nov;182(11):635-40. doi: 10.1007/s00066-006-1548-2. Strahlenther Onkol. 2006. PMID: 17072520 Review.
-
Radiotherapy for atypical or malignant intracranial meningioma.Int J Radiat Oncol Biol Phys. 1996 Mar 1;34(4):817-22. doi: 10.1016/0360-3016(95)02166-3. Int J Radiat Oncol Biol Phys. 1996. PMID: 8598358 Review.
Cited by
-
Radiotherapy intensification for atypical and malignant meningiomas: A systematic review.Neurooncol Pract. 2023 Dec 18;11(2):115-124. doi: 10.1093/nop/npad077. eCollection 2024 Apr. Neurooncol Pract. 2023. PMID: 38496911 Free PMC article. Review.
-
Topographic Patterns of Intracranial Meningioma Recurrences-Systematic Review with Clinical Implication.Cancers (Basel). 2024 Jun 19;16(12):2267. doi: 10.3390/cancers16122267. Cancers (Basel). 2024. PMID: 38927972 Free PMC article. Review.
References
MeSH terms
Grants and funding
LinkOut - more resources
Full Text Sources
Medical
