. 2021 Jun 25;16(1):39.
doi: 10.1186/s13024-021-00458-z.

Key role of the CCR2-CCL2 axis in disease modification in a mouse model of tauopathy

Affiliations

Key role of the CCR2-CCL2 axis in disease modification in a mouse model of tauopathy

Hila Ben-Yehuda et al. Mol Neurodegener. .

Abstract

Background: For decades, dementia has been characterized by accumulation of waste in the brain and low-grade inflammation. Over the years, emerging studies highlighted the involvement of the immune system in neurodegenerative disease emergence and severity. Numerous studies in animal models of amyloidosis demonstrated the beneficial role of monocyte-derived macrophages in mitigating the disease, though less is known regarding tauopathy. Boosting the immune system in animal models of both amyloidosis and tauopathy, resulted in improved cognitive performance and in a reduction of pathological manifestations. However, a full understanding of the chain of events that is involved, starting from the activation of the immune system, and leading to disease mitigation, remained elusive. Here, we hypothesized that the brain-immune communication pathway that is needed to be activated to combat tauopathy involves monocyte mobilization via the C-C chemokine receptor 2 (CCR2)/CCL2 axis, and additional immune cells, such as CD4+ T cells, including FOXP3+ regulatory CD4+ T cells.

Methods: We used DM-hTAU transgenic mice, a mouse model of tauopathy, and applied an approach that boosts the immune system, via blocking the inhibitory Programmed cell death protein-1 (PD-1)/PD-L1 pathway, a manipulation previously shown to alleviate disease symptoms and pathology. An anti-CCR2 monoclonal antibody (αCCR2), was used to block the CCR2 axis in a protocol that partially eliminates monocytes from the circulation at the time of anti-PD-L1 antibody (αPD-L1) injection, and for the critical period of their recruitment into the brain following treatment.

Results: Performance of DM-hTAU mice in short-term and working memory tasks, revealed that the beneficial effect of αPD-L1, assessed 1 month after a single injection, was abrogated following blockade of CCR2. This was accompanied by the loss of the beneficial effect on disease pathology, assessed by measurement of cortical aggregated human tau load using Homogeneous Time Resolved Fluorescence-based immunoassay, and by evaluation of hippocampal neuronal survival. Using both multiparametric flow cytometry, and Cytometry by Time Of Flight, we further demonstrated the accumulation of FOXP3+ regulatory CD4+ T cells in the brain, 12 days following the treatment, which was absent subsequent to CCR2 blockade. In addition, measurement of hippocampal levels of the T-cell chemoattractant, C-X-C motif chemokine ligand 12 (Cxcl12), and of inflammatory cytokines, revealed that αPD-L1 treatment reduced their expression, while blocking CCR2 reversed this effect.

Conclusions: The CCR2/CCL2 axis is required to modify pathology using PD-L1 blockade in a mouse model of tauopathy. This modification involves, in addition to monocytes, the accumulation of FOXP3+ regulatory CD4+ T cells in the brain, and the T-cell chemoattractant, Cxcl12.

Keywords: CCL2; CCR2; CXCL12; Dementia; Immunotherapy; Monocytes; PD-L1; Regulatory T cells; Tauopathy.


Conflict of interest statement

M.S. is an inventor of the intellectual property that forms the basis for development of PD-L1 immunotherapy for AD.

Figures
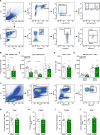
Fig. 1
Fig. 1
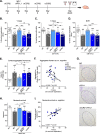
Anti-CCR2 antibody reduces monocyte populations in the blood without affecting cognitive behavior. WT mice received 4 injections of αCCR2 antibody every 4 days, while control mice were untreated. Mice were euthanized 3 days after the 4th injection, and blood was collected. (A) Flow cytometry gating strategy for monocyte (top) and memory CD4+ T cell (bottom) populations in the blood of WT animals. (B) Flow cytometry analyses of Ly6G CD115+ myeloid cells (two-tailed Student’s t-test: t(14) = 2.256, *p = 0.0406), (C) Ly6C+ myeloid populations (two-tailed Student’s t-test: Ly6Chi t(14) = 3.764, **p = 0.0021; Ly6Cmed t(14) = 2.442, *p = 0.0285), (D) CD4+ T cells, and (E) memory CD4+ T cell populations in control and αCCR2-injected groups, n = 8 mice per group. (F) Flow cytometry gating strategy and (G) analysis of Tregs in the blood of WT mice, n = 10 mice per group. Data are presented as mean ± s.e.m. *p < 0.05, **p < 0.01. (H-J) Male WT mice received 4–5 injections of αCCR2 antibody every 4 days, while control mice remained untreated. Behavioral testing was carried out during the 4 days following the last injection. (H) T-maze: Willingness to explore a novel environment is presented as percent of time spent by each mouse in a novel arm divided by the total time spent in all three arms (the novel arm and two familiar arms). (I) Spontaneous alternation in the Y maze: The spontaneous alternation behavior of the mice is presented as percent alternation: number of alternations divided by number of possible triads (see Methods). (J) Novel Object Recognition (NOR): The memory recognition is presented as percent time the mouse interacted with the novel object divided by the total time spent with both objects. n = 6 mice per group. Data are presented as mean ± s.e.m. One-way ANOVA was used for the analyses
Fig. 2
Fig. 2
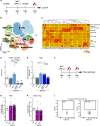
Anti-CCR2 antibody abrogates the beneficial effect of PD-L1 blockade. This experiment included four groups of DM-hTAU mice treated either with: IgG, αPD-L1, αCCR2 + αPD-L1, or αCCR2. An additional group of WT mice served as healthy controls. (A) Schematic presentation of experimental design: αCCR2 was i.p. injected to DM-hTAU mice 3 days prior (Day − 3) to αPD-L1 or IgG (Day 0), and again on days 1, 5 and 9. The cognitive behavior of the animals was assessed 1 month after αPD-L1 treatment by T-maze, spontaneous alternation test in Y-maze, and novel object recognition. Subsequently, brains were removed, and aggregated human tau protein levels in the cortices was measured. (B) T-maze: Willingness to explore a novel environment is presented as percent of time spent by each mouse in a novel arm divided by the total time spent in all three arms (novel and two familiar arms. One-way ANOVA F(4,56) = 9.068, ***p < 0.0001). (C) Spontaneous alternation in Y maze: The spontaneous alternation behavior of the mice is presented as percent alternation: number of alternations divided by number of possible triads (see Methods. One-way ANOVA F(4,55) = 19.73, ***p < 0.0001). (D) Novel Object Recognition (NOR): novel object preference is presented as the percent time the mouse interacted with the novel object divided by the total time spent with both objects (One-way ANOVA F(4,52) = 12.48, ***p < 0.0001). (B-D). Post-hoc uncorrected Fisher’s LSD multiple comparisons between DM-hTAU groups to WT: #p < 0.05, ##p < 0.01, ###p < 0.001. Post-hoc uncorrected Fisher’s LSD multiple comparisons between the DM-hTAU groups: *p < 0.05, **p < 0.01, ***p < 0.001. n = 9–18 mice per group. Results were combined from two independent experiments. Data are presented as mean ± s.e.m. (E) Cortical aggregated human tau protein levels were measured by HTRF immunoassay, and are presented as Delta F% normalized to the amount of total protein in each tissue (mg). One-way ANOVA F(4,28) = 7.409, ***p = 0.0003. Post-hoc uncorrected Fisher’s LSD multiple comparisons between DM-hTAU groups to WT: ###p < 0.001. Post-hoc uncorrected Fisher’s LSD multiple comparisons between the DM-hTAU groups: *p < 0.05. n = 8–6 mice per group. Data are presented as mean ± s.e.m. (F) Pearson correlation coefficient test between the measured aggregated human tau protein and the T maze score of each mouse revealed a significant negative linear correlation. r(Pearson) = − 0.5368, ***p < 0.001. (G) Representative images (scale bar - 100 μm) and (H) quantification of pyramidal neurons in the subiculum of female mice. One-way ANOVA F(4,19) = 7.686, ***p = 0.0007. Post-hoc uncorrected Fisher’s LSD multiple comparisons between DM-hTAU groups to WT: ##p < 0.01, ###p < 0.001. Post-hoc uncorrected Fisher’s LSD multiple comparisons between the DM-hTAU groups: *p < 0.05, **p < 0.01. n = 3–6 mice per group. Data are presented as mean ± s.e.m. (I) Pearson correlation coefficient test between the neuronal survival in the female’s subiculum and the T maze score of each of them revealed a significant linear correlation. r(Pearson) = 0.6697, ***p < 0.001
Fig. 3
Fig. 3
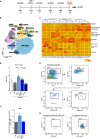
Upregulation of circulating CCR2+ monocytes and FOXP3+ regulatory CD4+ T cells following anti-PD-L1 antibody immunotherapy. This experiment included four groups of DM-hTAU mice treated either with: IgG, αPD-L1, αCCR2 + αPD-L1, or αCCR2. An additional group of WT mice served as healthy controls. (A) Schematic presentation of experimental design: αCCR2 was i.p. injected to DM-hTAU mice 3 days prior (Day − 3) to αPD-L1 or IgG (Day 0), and again 1 day after αPD-L1 treatment (Day 1). Blood was sampled 3 days following αPD-L1 treatment and analyzed by CyTOF. (B) FlowSOM clustering over tSNE plot showing different immune cell populations. (C) Heatmap of the CyTOF data showing Z-score of mean expression levels of the different markers across distinct CD45+ immune cell populations. (B, C) Representative results of one of three independent experiments. (D) Quantification of CCR2+ monocytes as measured by CyTOF. The percentage of the entire cell population per mouse is presented relative to the control IgG group. One-way ANOVA F(4,22) = 14.14, ***p < 0.0001. Post-hoc uncorrected Fisher’s LSD multiple comparisons between DM-hTAU groups and WT: #p < 0.05, ##p < 0.01, ###p < 0.001. Post-hoc uncorrected Fisher’s LSD multiple comparisons between the DM-hTAU groups: **p < 0.01, ***p < 0.001. (E) Quantification of Tregs as determined by CyTOF and analyzed by manual gating. The abundance of each cell population per mouse is presented as the ratio relative to the control IgG group. One-way ANOVA F(4,22) = 2.986, *p = 0.0392. Post-hoc uncorrected Fisher’s LSD multiple comparisons between the DM-hTAU groups: *p < 0.05, **p < 0.01. n = 5–6 mice per group. Data are presented as mean ± s.e.m. (F) WT mice were injected with αPD-L1, and after 3 and 7 days, blood was sampled and analyzed by multiparametric flow cytometry. (G) Flow cytometry analysis of blood Tregs (One-way ANOVA F(2,15) = 4.762, *p = 0.025. Post-hoc uncorrected Fisher’s LSD multiple comparisons between αPD-L1 to IgG groups: *p < 0.05). (H) Flow cytometry analysis of CCR2 expression by blood Tregs, and (I) representative dot plot of the gating strategy. Splenocytes were used as FMO; n = 6 mice per group. Data are presented as mean ± s.e.m.
Fig. 4
Fig. 4
CCR2 blockade prevents accumulation of FOXP3+ regulatory CD4+ T cells in DM-hTAU brains treated with anti-PD-L1. This experiment included four groups of DM-hTAU mice treated either with: IgG, αPD-L1, αCCR2 + αPD-L1, or αCCR2. An additional group of WT mice served as healthy controls. (A) Schematic presentation of experimental design: αCCR2 was i.p. injected to DM-hTAU mice 3 days prior (Day − 3) to αPD-L1 or IgG (Day 0), and again on days 1, 5 and 9. The brains were analyzed by CyTOF 3 days after the last αCCR2 injection (Day 12). (B) FlowSOM clustering over tSNE plot showing different immune populations. DCs- dendritic cells, BAMs- border associated macrophages. (C) Heatmap of the CyTOF data showing Z-score of mean expression levels of the different markers across distinct CD45+ immune cell populations. (B, C) Representative results from one of three independent experiments. (D) Quantification of CD4+ T cells as measured by CyTOF. The percentage of each cell population per mouse was calculated, and normalized to the control IgG group. (One-way ANOVA F(4,20) = 4.427, *p = 0.01. Post-hoc uncorrected Fisher’s LSD multiple comparisons between DM-hTAU groups to WT: #p < 0.05. Post-hoc uncorrected Fisher’s LSD multiple comparisons between the DM-hTAU groups: **p < 0.01). n = 4–6 mice per group. Data are presented as mean ± s.e.m. (E) Flow cytometry gating strategy of Tregs in the brain of DM-hTAU mice. (F) Flow cytometry analysis of Tregs obtained from two experiments, in which each group was comprised of a pool of 10 mice. The results are presented as a ratio to the control IgG group. Data are presented as mean ± s.e.m. (G) Representative flow cytometry dot plots demonstrating negligible expression of CCR2 by the Tregs detected in the brains
Fig. 5
Fig. 5
Anti-PD-L1 antibody therapeutic effect on inflammation reduction is associated with the T-cell chemoattractant Cxcl12. This experiment included three groups of DM-hTAU mice treated either with: IgG, αPD-L1, or αCCR2 + αPD-L1. αCCR2 was i.p. injected to DM-hTAU mice 3 days prior (Day − 3) to αPD-L1 (Day 0), and again on days 1, 5 and 9. Hippocampi were excised and analyzed by RT-qPCR 3 days after the last αCCR2 injection (Day 12). (A) RT-qPCR results for Cxcl12 (One-way ANOVA F(2,15) = 6.3419, **p = 0.0097), (B) Tnfα (One-way ANOVA F(2,15) = 2.095, p = 0.1576), (C) Il-1β (One-way ANOVA F(2,15) = 1.821, p = 0.1959), (D) Il-6 (One-way ANOVA F(2,15) = 5.958, *p = 0.0125), and (E) Il-12p35 (One-way ANOVA F(2,15) = 3.607, p = 0.0526). (A-E) Post-hoc uncorrected Fisher’s LSD multiple comparisons between the groups: *p < 0.05, **p < 0.01; n = 6 mice per group. Data are presented as mean ± s.e.m. (F) Pearson correlation coefficient tests revealed significant linear correlations between the measured mRNA levels of Cxcl12 and of the inflammatory cytokines: Tnfα (r(Pearson) = 0.65, **p = 0.0035), (G) Il-1β (r(Pearson) = 0.734, ***p < 0.001), (H) Il-6 (r(Pearson) = 0.636, **p = 0.0046), and (I) Il-12p35 (r(Pearson) = 0.818, ***p < 0.0001)

Similar articles

Cited by

References

    1. Arvanitakis Z, Shah RC, Bennett DA. Diagnosis and management of dementia: review. JAMA - J Am Med Assoc. 2019;322(16):1589–1599. doi: 10.1001/jama.2019.4782. - DOI - PMC - PubMed
    1. Gale SA, Acar D, Daffner KR. Dementia. Am J Med. 2018;131(10):1161–1169. doi: 10.1016/j.amjmed.2018.01.022. - DOI - PubMed
    1. Dugger BN, Dickson DW. Pathology of neurodegenerative diseases. Cold Spring Harb Perspect Biol. 2017;9(7):a028035. doi: 10.1101/cshperspect.a028035. - DOI - PMC - PubMed
    1. Schwartz M, Kipnis J, Rivest S, Prat A. How do immune cells support and shape the brain in health, disease, and aging? J Neurosci. 2013;33(45):17587–17596. doi: 10.1523/JNEUROSCI.3241-13.2013. - DOI - PMC - PubMed
    1. Ziv Y, Ron N, Butovsky O, Landa G, Sudai E, Greenberg N, Cohen H, Kipnis J, Schwartz M. Immune cells contribute to the maintenance of neurogenesis and spatial learning abilities in adulthood. Nat Neurosci. 2006;9(2):268–275. doi: 10.1038/nn1629. - DOI - PubMed

Publication types