. 2021 Jun 25;7(26):eabe6102.
doi: 10.1126/sciadv.abe6102. Print 2021 Jun.

Strong links between Saharan dust fluxes, monsoon strength, and North Atlantic climate during the last 5000 years

Affiliations

Strong links between Saharan dust fluxes, monsoon strength, and North Atlantic climate during the last 5000 years

Juncal A Cruz et al. Sci Adv. .

Abstract

Despite the multiple impacts of mineral aerosols on global and regional climate and the primary climatic control on atmospheric dust fluxes, dust-climate feedbacks remain poorly constrained, particularly at submillennial time scales, hampering regional and global climate models. We reconstruct Saharan dust fluxes over Western Europe for the last 5000 years, by means of speleothem strontium isotope ratios (87Sr/86Sr) and karst modeling. The record reveals a long-term increase in Saharan dust flux, consistent with progressive North Africa aridification and strengthening of Northern Hemisphere latitudinal climatic gradients. On shorter, centennial to millennial scales, it shows broad variations in dust fluxes, in tune with North Atlantic ocean-atmosphere patterns and with monsoonal variability. Dust fluxes rapidly increase before (and peaks at) Late Holocene multidecadal- to century-scale cold climate events, including those around 4200, 2800, and 1500 years before present, suggesting the operation of previously unknown strong dust-climate negative feedbacks preceding these episodes.


Figures

Fig. 1
Fig. 1. Kaite paleodust record in the context of the North Atlantic region.
Map showing the location of the site for the dust flux reconstruction based in stalagmite Buda-100 (Kaite Cave, northern Spain), indicated with a red star, as well as of other previous proxy reconstructions mentioned in this paper (yellow stars, numbered 1 to 11): (1) Mid-Atlantic dust flux record, GGC6 sediment core (13); (2) North Atlantic Current (NAC) temperature record, MD95-2011 sediment core (48); (3) Iceland-Scotland Overflow Water (ISOW) strength record, GS06-144 08GC sediment core (51); (4) NAC drift ice record, VM-29-191 sediment core (61); (5) Gulf of Cadiz hydroclimate reconstruction, GeoB5901-2 core site (53); (6) Sidi Ali lake (Morocco) paleoprecipitation and paleodust record (10); (7) Eastern North Atlantic Central Water offshore Morocco temperature record, OC437-7 24GGC sediment core (46); (8) GC37 sediment core near Canary Islands (34); (9) OC437-7/GC49 sediment core, offshore Western Sahara (12); (10) dust record, GeoB9501 sediment core (14); (11) dust record, ODP-658C (15); (12) dust record, OC437-7/GC68 sediment core, offshore Mauritania (12); (13) Sahel-Sahara paleoprecipitation record, GeoB4905-4 sediment core (35); (14) Gulf of Guinea sea surface temperature, MD03-2707 sediment core (39). The map also includes the dominant Saharan dust trajectories toward Western Europe and the North Atlantic (18, 19). Western PSA and Central PSA indicate the North African dust “preferential source areas” and their approximate average values for dust 87Sr/86Sr (in parentheses) (20).
Fig. 2
Fig. 2. Reconstruction of Saharan dust flux in northern Iberia.
Dust deposition rate (left axis) based on 87Sr/86Sr ratios (right axis) measured along stalagmite Buda-100 from Kaite Cave (Spain) and U-Th age-dating, which allowed a high-resolution age model for 4.9 to 0.9 ka BP interval (horizontal axis). Two additional reconstructions for Saharan dust fluxes are given based on the lowest and highest estimates for present-day dust fluxes, and, respectively, in maximum and minimum estimates for average 87Sr/86Sr ratios of Saharan dust reaching the cave area (see the Supplementary Materials for details). The paleodust fluxes inferred from Buda-100 are always above of the deposition rates simulated for the so-called African Humid Period at ~6.0 ka BP (28, 29) and below present-day values. Error bars are 2σ for both 230Th ages and 87Sr/86Sr ratios.
Fig. 3
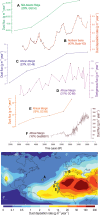
Fig. 3. Saharan dust in Iberia versus North Atlantic paleodust records.
Dust reconstruction based in Buda-100 stalagmite compared with previous dust reconstructions based in marine sediment core GG6-C of the mid-Atlantic ridge (13) and sediment cores GC49 and GC68 (12), GeoB9501 (14), and ODP-658C (15) of the northwestern African margin. Beyond the different resolution of the records, all show good coherence in the long-term trend. Also, the absolute values of dust fluxes are concordant with the distance of the sampling sites to dust sources and pathways. The map shows current average dust deposition (32) rates and location of paleodust record sites.
Fig. 4
Fig. 4. Saharan dust fluxes and key ocean-atmosphere and climate time series.
Time series for selected ocean-atmosphere proxy records (see Fig. 1 for locations) and for key climate forcings in the 4.9 to 0.9 ka BP interval. (A) Reconstruction of the total solar irradiance (59) with purple arrows indicating grand minima of solar activity. (B) Flow speed in the Iceland-Scotland overflow water (ISOW) inferred from sortable-silt mean size (average) in core GS06-144 08GC (51). Smooth curve is a B-Spline fit 10 dec. (C) LIG for 15 July in the Northern Hemisphere, given by the insolation between latitudes 65° and 15°N, using data from (79). (D) LTG for the Northern Hemisphere, between latitudes 50° and 10°N, calculated with data from (43) (40° to 60°N annual average temperature minus 0° to 20°N annual average temperature). (E) Saharan dust deposition rate in northern Iberia (this paper). (F) Strength of the Asian monsoon inferred from oxygen isotope ratios in a stalagmite from Dongge Cave, southern China (25°N, 108°E) (40). Smooth curve is a 24-point running mean. (G) Intermediate water temperature of the Eastern North Atlantic Central Water (ENACW) inferred from Mg/Ca in sediment core OC437-7 24GGC (46) located in the eastern boundary of the subtropical gyre. The curve is a 200-year low-pass filter. (H) Sea surface temperature in the Gulf of Guinea estimated by Mg/Ca of MD03-2707 sediment core (39) with age model by Waelbroeck et al. (80). The curve is a B-Spline fit 10 dec. Blue ribbons at the bottom indicate the time of the main supraregional “cold events” described in the literature (see the main text). Vertical scales in (B), (G), and (H) are inverted to facilitate visual comparison.

Similar articles

Cited by

References

    1. Carslaw K. S., Boucher O., Spracklen D. V., Mann G. W., Rae J. G. L., Woodward S., Kulmala M., A review of natural aerosol interactions and feedbacks within the Earth system. Atmos. Chem. Phys. 10, 1701–1737 (2010).
    1. Solmon F., Mallet M., Elguindi N., Giorgi F., Zakey A., Konaré A., Dust aerosol impact on regional precipitation over western Africa, mechanisms and sensitivity to absorption properties. Geophys. Res. Lett. 35, 1–6 (2008).
    1. Kotsyfakis M., Zarogiannis S. G., Patelarou E., The health impact of Saharan dust exposure. Int. J. Occup. Med. Environ. Health 32, 749–760 (2019). - PubMed
    1. Ginoux P., Prospero J. M., Gill T. E., Hsu N. C., Zhao M., Global-scale attribution of anthropogenic and natural dust sources and their emission rates based on MODIS Deep Blue aerosol products. Rev. Geophys. 50, 1–36 (2012).
    1. O. Boucher, D. Randall, P. Artaxo, C. Bretherton, G. Feingold, P. Forster, V.-M. Kerminen, Y. Kondo, H. Liao, U. Lohmann, P. Rasch, S. K. Satheesh, S. Sherwood, B. Stevens, X. Y. Zhang, in Climate Change 2013 the Physical Science Basis: Working Group I Contribution to the Fifth Assessment Report of the Intergovernmental Panel on Climate Change, T. F. Stocker, D. Qin, G.-K. Plattner, M. Tignor, S. K. Allen, J. Boschung, A. Nauels, Y. Xia, Eds. (Cambridge University Press, New York, 2013), pp. 571–658.