. 2021 Jun 25;7(26):eabg3012.
doi: 10.1126/sciadv.abg3012. Print 2021 Jun.

Systemic regulation of mitochondria by germline proteostasis prevents protein aggregation in the soma of C. elegans

Affiliations

Systemic regulation of mitochondria by germline proteostasis prevents protein aggregation in the soma of C. elegans

Giuseppe Calculli et al. Sci Adv. .

Abstract

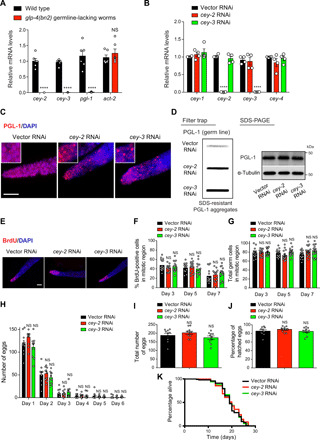
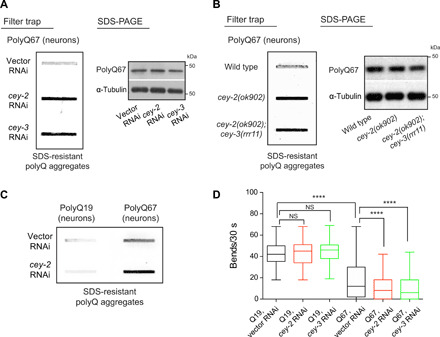
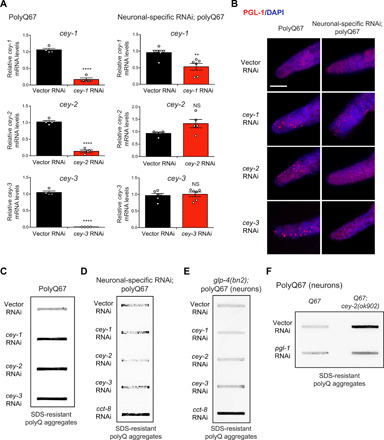
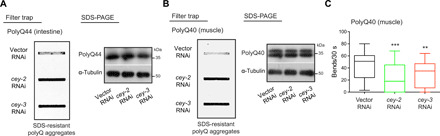
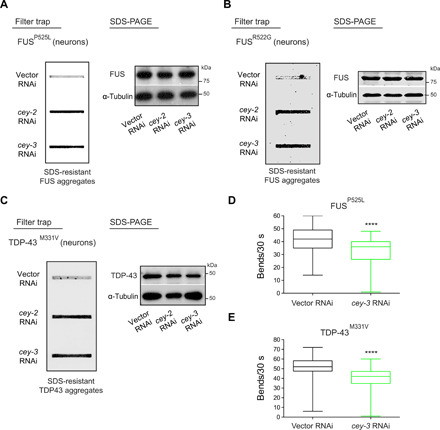
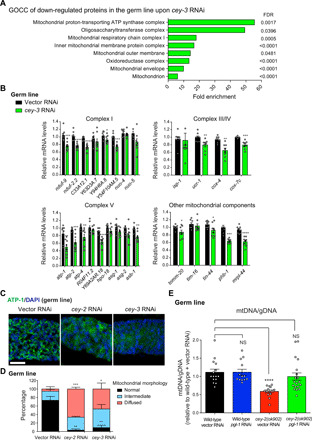
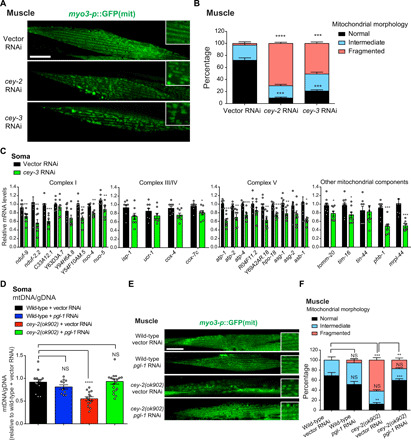
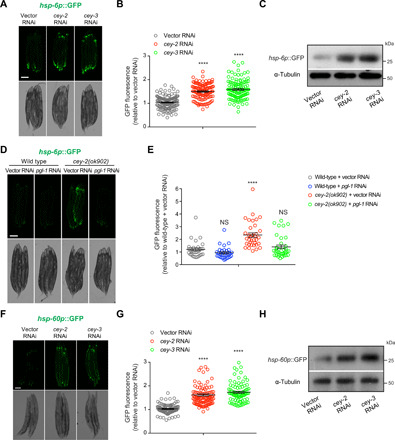
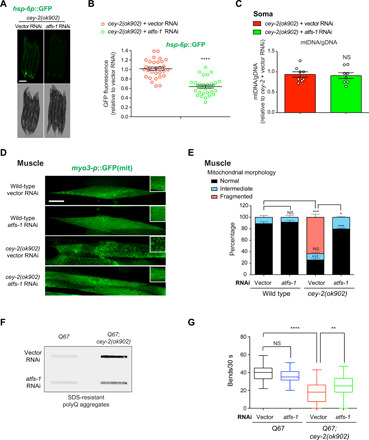
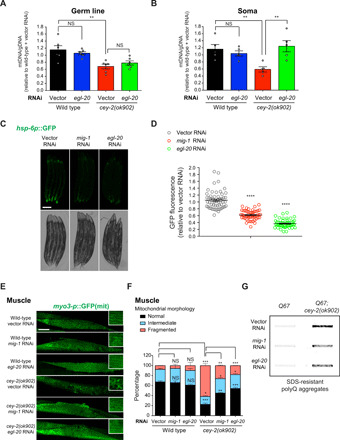
Protein aggregation causes intracellular changes in neurons, which elicit signals to modulate proteostasis in the periphery. Beyond the nervous system, a fundamental question is whether other organs also communicate their proteostasis status to distal tissues. Here, we examine whether proteostasis of the germ line influences somatic tissues. To this end, we induce aggregation of germline-specific PGL-1 protein in germline stem cells of Caenorhabditis elegans Besides altering the intracellular mitochondrial network of germline cells, PGL-1 aggregation also reduces the mitochondrial content of somatic tissues through long-range Wnt signaling pathway. This process induces the unfolded protein response of the mitochondria in the soma, promoting somatic mitochondrial fragmentation and aggregation of proteins linked with neurodegenerative diseases such as Huntington's and amyotrophic lateral sclerosis. Thus, the proteostasis status of germline stem cells coordinates mitochondrial networks and protein aggregation through the organism.


Figures

Fig. 1
Fig. 1. Knockdown of germline-specific CEYs induces PGL-1 aggregation in GSCs.
(A) mRNA levels of ubiquitously expressed act-2 and germline-specific cey-2, cey-3, and pgl-1 (means ± SEM of the relative expression to wild-type worms, n = 6 independent experiments). (B) Knockdown levels in day 3 adults [relative to vector RNA interference (RNAi), means ± SEM, n = 4]. (C) Immunostaining of germ lines with antibody to PGL-1 and 4′,6-diamidino-2-phenylindole (DAPI; nuclei). Knockdown of CEYs triggers aggregation of endogenous PGL-1 in GSCs of the mitotic region (that is, the first 20 rows of cells in the most distal part of the germ line). Scale bar, 20 μm. Images are representative of three independent experiments. (D) Knockdown of CEYs induces aggregation of PGL-1::green fluorescent protein (GFP) (detected by anti-GFP antibody). Right: SDS–polyacrylamide gel electrophoresis (PAGE) with antibodies to GFP and α-tubulin loading control. Images are representative of three independent experiments. (E) 5-Bromodeoxyuridine (BrdU) staining of proliferating GSCs in day 3 adults. Scale bar, 20 μm. (F) Percentage of BrdU-positive cells per total nuclei (DAPI) within the mitotic region (means ± SEM, n = 16 germ lines scored per condition from two independent experiments). (G) Total number of germline cells within the mitotic region (means ± SEM, n = 16 germ lines per condition, two independent experiments). (H) Number of eggs laid per worm every 24 hours (means ± SEM, n = 10 worms per condition, three independent experiments). (I) Total number of eggs laid per worm (means ± SEM, n = 10 worms per condition from three independent experiments). (J) Percentage of hatched eggs (means ± SEM, n = 10 worms per condition, three independent experiments). Statistical comparisons were made by two-tailed Student’s t test for unpaired samples: ****P < 0.0001; NS, not significant (P > 0.05). (K) Life-span analysis (log-rank test, n = 96 worms per condition). Data file S1 contains replicate life-span experiments.
Fig. 2
Fig. 2. Loss of germline-specific CEY factors triggers aggregation of expanded-polyQ peptides in neurons.
(A) Single knockdown of germline-specific CEYs induces aggregation of polyQ67::yellow fluorescent protein (YFP) (detected by anti-GFP antibody) expressed under neuronal-specific F25B3.3 promoter. Worms were analyzed at day 3 of adulthood. The images are representative of four independent experiments. (B) cey-2 and double cey-2, cey-3 functional null mutant worms exhibit increased amounts of polyQ67 aggregates in neurons (detected by anti-GFP antibody). Right: SDS-PAGE analysis with antibodies to GFP and α-tubulin loading control. The images are representative of three independent experiments. (C) Filter trap analysis with anti-GFP antibody of neuronal polyQ19- and polyQ67-expressing models. The images are representative of three independent experiments. (D) Loss of germline-specific CEYs hastens the motility defects of neuronal polyQ67-expressing worms but does not affect control polyQ19 worms. Bar graphs represent average (±SEM) thrashing movements over a 30-s period on day 3 of adulthood (n = 160 worms per condition from three independent experiments). Statistical comparisons were made by two-tailed Student’s t test for unpaired samples. P values: ****P < 0.0001 and NS, P > 0.05.
Fig. 3
Fig. 3. Accumulation of PGL-1 aggregates in GSCs upon loss of CEY factors underlies increased polyQ67 aggregation in neurons.
(A) On the left, quantitative polymerase chain reaction (qPCR) analysis of day 3 adult worms expressing Q67::YFP under neuronal F25B3.3 promoter. Graph represents the relative expression to vector RNAi control (means ± SEM, n = 4). On the right, qPCR after neuronal-specific RNAi treatment in day 3 adult worms expressing Q67::YFP in neurons [means ± SEM, cey-1 (n = 6), cey-2 (n = 5), and cey-3 (n = 6)]. RNAi rescued in the neurons alone of RNAi-deficient worms (sid-1(pk3321); unc-119p::sid-1; F25B3.3p::Q67::YFP). (B) Immunostaining of germ lines in polyQ67-expressing worms with antibody to PGL-1 and DAPI (nuclei). On the left, knockdown of cey-1 induces aggregation of PGL-1 in the germ line. On the right, neuronal-specific RNAi against CEY factors does not impair proteostasis of PGL-1 in the germ line. Scale bar, 20 μm. Images are representative of three independent experiments. (C) Knockdown of cey-1 increases polyQ67 aggregation in neurons (detected by anti-GFP antibody). The images are representative of four independent experiments. (D) Neuronal-specific knockdown of cey-1 does not induce polyQ67 aggregation in neurons. In contrast, neuronal-specific knockdown of cct-8, a subunit of the TRiC/CCT chaperonin complex, promotes polyQ67 aggregation in neurons. The images are representative of four independent experiments. (E) RNAi against CEY factors does not induce polyQ67 aggregation in the neurons of germline-lacking worms (glp-4(bn2)). In contrast, knockdown of cct-8 promotes neuronal polyQ67 aggregation. The images are representative of three independent experiments. (F) Knockdown of germline-specific pgl-1 rescues the increased polyQ67 aggregation phenotype in the neurons of cey-2 mutants. The images are representative of three independent experiments. All statistical comparisons were made by two-tailed Student’s t test for unpaired samples. P values: **P < 0.01, ****P < 0.0001, and NS, P > 0.05.
Fig. 4
Fig. 4. The proteostasis status of germline cells regulates protein aggregation in distinct somatic tissues.
(A) Knockdown of germline-specific CEYs increases polyQ aggregation in C. elegans that express polyQ44::YFP in the intestine alone (detected by anti-GFP antibody). Right: SDS-PAGE analysis with antibodies to GFP and α-tubulin loading control. The images are representative of three independent experiments. (B) Knockdown of germline-specific CEYs increases polyQ aggregation in C. elegans that express polyQ40::YFP in the muscle alone (detected by anti-GFP antibody). Right: SDS-PAGE analysis with antibodies to GFP and α-tubulin loading control. The images are representative of three independent experiments. (C) Loss of germline-specific CEYs promotes motility defects in worms expressing polyQ40::YFP in the muscle. Bar graphs represent average (±SEM) thrashing movements over a 30-s period on day 3 of adulthood (n = 45 worms per condition from three independent experiments). Statistical comparisons were made by two-tailed Student’s t test for unpaired samples. P values: **P < 0.01 and ***P < 0.001.
Fig. 5
Fig. 5. Loss of germline proteostasis triggers aggregation of ALS-related mutant variants of FUS and TDP-43 in neurons.
(A) Knockdown of germline-specific CEYs increases aggregation of ALS-related mutant FUSP525L variant in C. elegans neurons (detected by anti-FUS antibody). Right: SDS-PAGE analysis with antibodies to FUS and α-tubulin loading control. The images are representative of two independent experiments. (B) Knockdown of germline-specific CEYs promotes aggregation of mutant FUSR522G variant in C. elegans neurons (detected by anti-FUS antibody). Right: SDS-PAGE analysis with antibodies to FUS and α-tubulin loading control. The images are representative of two independent experiments. (C) Knockdown of germline-specific CEYs increases aggregation of ALS-related mutant TDP-43M331V variant in C. elegans neurons (detected by anti-TDP-43 antibody). Right: SDS-PAGE analysis with antibodies to TDP-43 and α-tubulin loading control. The images are representative of three independent experiments. (D) Knockdown of cey-3 hastens the motility defects of neuronal FUSP525L-expressing worms (n = 72 worms per condition from two independent experiments). (E) Loss of cey-3 hastens the motility defects of neuronal TDP-43M331V–expressing worms (n = 74 worms per condition from three independent experiments). In (D) and (E), bar graphs represent average (±SEM) thrashing movements over a 30-s period on day 3 of adulthood. Statistical comparisons were made by two-tailed Student’s t test for unpaired samples. P values: ****P < 0.0001.
Fig. 6
Fig. 6. Accumulation of PGL-1 aggregates impinges on the mitochondrial network of germline cells.
(A) GOCC analysis of down-regulated proteins in isolated germ lines from C. elegans following cey-3 knockdown [false discovery rate (FDR) < 0.05]. Eight of the most enriched GOCC terms are shown. Please see data file S3 for the complete list of enriched GOCC terms. (B) qPCR analysis of mitochondrial components in isolated germ lines. Graphs represent the relative expression to vector RNAi control (means ± SEM of eight independent experiments). (C) Immunostaining of germline cells with antibody to mitochondrial marker ATP-1. Cell nuclei were stained with DAPI. Scale bar, 20 μm. Images are representative of three independent experiments. (D) Percentage of germ lines with normal, intermediate, or diffused mitochondrial network morphology (means ± SEM of three independent experiments, vector RNAi = 50 germ lines, cey-2 RNAi = 43 germ lines, and cey-3 RNAi = 52 germ lines). (E) Relative DNA [mitochondrial DNA (mtDNA)]/genomic DNA (gDNA) ratio in isolated germ lines to wild-type + vector RNAi [means ± SEM, wild-type + vector RNAi (n = 15 biological replicates from three independent experiments), wild-type + pgl-1 RNAi (n = 13), cey-2(ok902) + vector RNAi (n = 14), and cey-2(ok902) + pgl-1 RNAi (n = 19)]. In (B), (D), and (E), statistical comparisons were made by two-tailed Student’s t test for unpaired samples. P values: *P < 0.05, **P < 0.01, ***P < 0.001, ****P < 0.0001, and NS, P > 0.05.
Fig. 7
Fig. 7. Aggregation of PGL-1 in the germ line induces changes in the mitochondrial network of somatic tissues.
(A) Representative images of mitochondrial morphology in muscle cells marked by myo-3p::GFP(mit) upon knockdown of germline-specific CEYs. Scale bar, 20 μm. Images are representative of three independent experiments. (B) Percentage of animals with normal, intermediate, or fragmented mitochondrial network morphology in the muscle (means ± SEM of three independent experiments, vector RNAi = 30 animals, cey-2 RNAi = 45 animals, and cey-3 RNAi = 41 animals). (C) qPCR analysis of mitochondrial components in somatic tissues (isolated intestines + heads). Graphs represent the relative expression to vector RNAi control (means ± SEM of eight independent experiments). (D) Relative DNA (mtDNA)/gDNA ratio in somatic tissues to wild-type + vector RNAi [means ± SEM, wild-type + vector RNAi (n = 13 biological replicates from three independent experiments), wild-type + pgl-1 RNAi (n = 11), cey-2(ok902) + vector RNAi (n = 14), and cey-2(ok902) + pgl-1 RNAi (n = 19)]. (E) Knockdown of pgl-1 partially rescues changes in muscle mitochondrial morphology induced by loss of cey-2 function. Scale bar, 20 μm. Images are representative of three independent experiments. (F) Percentage of animals with normal, intermediate, or fragmented mitochondrial network morphology in the muscle [means ± SEM of three independent experiments, wild-type + vector RNAi = 44 worms, wild-type + pgl-1 RNAi = 38 worms, cey-2(ok902) + vector RNAi = 62 worms, and cey-2(ok902) + pgl-1 RNAi = 78 worms]. Statistical comparisons were made by two-tailed Student’s t test for unpaired samples. P values: *P < 0.05, **P < 0.01, ***P < 0.001, ****P < 0.0001, and NS, P > 0.05.
Fig. 8
Fig. 8. Loss of germline proteostasis triggers the UPRmt in somatic tissues.
(A) Knockdown of germline-specific CEY factors induces somatic hsp-6p::GFP expression. Scale bar, 200 μm. Images are representative of four independent experiments. (B) Quantification of hsp-6p::GFP fluorescence relative to vector RNAi [means ± SEM, vector RNAi (n = 128 worms), cey-2 RNAi (n = 122 worms), and cey-3 RNAi (n = 114 worms) from four independent experiments]. (C) Western blot analysis of hsp-6p::GFP worms with antibodies to GFP and α-tubulin loading control. The images are representative of three independent experiments. (D) cey-2(ok902) mutant animals exhibit increased somatic hsp-6p::GFP expression, a phenotype rescued by pgl-1 RNAi. Scale bar, 200 μm. Images are representative of two independent experiments. (E) Quantification of hsp-6p::GFP fluorescence relative to wild-type + vector RNAi [means ± SEM, wild-type + vector RNAi (n = 30 worms), wild-type + pgl-1 RNAi (n = 30), cey-2(ok902) + vector RNAi (n = 35), and cey-2(ok902) + pgl-1 RNAi (n = 35) from two independent experiments]. (F) Knockdown of germline-specific CEY factors induces somatic hsp-60p::GFP expression. Scale bar, 200 μm. Images are representative of four independent experiments. (G) Quantification of hsp-60p::GFP fluorescence relative to vector RNAi [means ± SEM, vector RNAi (n = 93 worms), cey-2 RNAi (n = 103 worms), and cey-3 RNAi (n = 83 worms) from four independent experiments]. (H) Western blot analysis of hsp-60p::GFP worms with antibodies to GFP and α-tubulin loading control. The images are representative of three independent experiments. Statistical comparisons were made by two-tailed Student’s t test for unpaired samples. P values: ****P < 0.0001 and NS, P > 0.05.
Fig. 9
Fig. 9. Induction of somatic UPRmt upon loss of germline-specific CEY factors determines mitochondrial fragmentation and protein aggregation in the soma.
(A) Knockdown of atfs-1 diminishes UPRmt induction in cey-2(ok902) mutant worms. Scale bar, 200 μm. Images are representative of two independent experiments. (B) Quantification of hsp-6p::GFP fluorescence relative to cey-2(ok902) + vector RNAi (means ± SEM, n = 30 worms per condition from two independent experiments). (C) Relative DNA (mtDNA)/gDNA ratio in somatic tissues to cey-2(ok902) + vector RNAi (means ± SEM, n = 8 biological replicates from two independent experiments). (D) Knockdown of atfs-1 ameliorates the fragmentation of mitochondria in the muscle induced by loss of cey-2 function. Scale bar, 20 μm. Images are representative of three independent experiments. (E) Percentage of animals with normal, intermediate, or fragmented mitochondrial network morphology in the muscle [means ± SEM of three independent experiments, wild-type + vector RNAi = 55 worms, wild-type + atfs-1 RNAi = 77 worms, cey-2(ok902) + vector RNAi = 133 worms, and cey-2(ok902) + atfs-1 RNAi = 137 worms]. (F) Knockdown of atfs-1 ameliorates increased polyQ67 aggregation in the neurons of cey-2 mutants. The images are representative of three independent experiments. (G) Loss-of-function mutation in cey-2 hastens the motility defects of neuronal polyQ67-expressing worms, whereas knockdown of atfs-1 rescues this phenotype. Bar graphs represent average (±SEM) thrashing movements over a 30-s period on day 3 of adulthood (n = 45 worms per condition from two independent experiments). Statistical comparisons were made by two-tailed Student’s t test for unpaired samples. P values: *P < 0.05, **P < 0.01, ***P < 0.001, ****P < 0.0001, and NS, P > 0.05.
Fig. 10
Fig. 10. Proteostasis of germline cells coordinates mitochondrial function and protein aggregation in somatic tissues through Wnt signaling.
(A) Relative DNA (mtDNA)/gDNA ratio in isolated germ lines to wild-type + vector RNAi (means ± SEM, n = 6 biological replicates from three independent experiments). (B) Relative mtDNA/gDNA ratio in somatic tissues (isolated intestines + heads) to wild-type + vector RNAi (means ± SEM, n = 5 biological replicates from three independent experiments). (C) Knockdown of either mig-1 or egl-20 reduces UPRmt induction in the soma of cey-2 mutant worms. Scale bar, 200 μm. Images are representative of two independent experiments. (D) Quantification of hsp-6p::GFP fluorescence relative to vector RNAi [means ± SEM, vector RNAi (n = 55 worms), mig-1 RNAi (n = 51 worms), and egl-20 RNAi (n = 55 worms) from two independent experiments]. (E) Knockdown of either Wnt signal egl-20 or its receptor mig-1 ameliorates changes in the mitochondrial morphology of the muscle induced by loss of cey-2 function. Scale bar, 20 μm. Images are representative of three independent experiments. (F) Percentage of animals with normal, intermediate, or fragmented mitochondrial network morphology in the muscle [means ± SEM of three independent experiments, wild-type + vector RNAi = 40 worms, wild-type + mig-1 RNAi = 35 worms, wild-type + egl-20 RNAi = 41 worms, cey-2(ok902) + vector RNAi = 75 worms, cey-2(ok902) + mig-1 RNAi = 73 worms, and cey-2(ok902) + egl-20 RNAi = 89 worms]. (G) Knockdown of either mig-1 or egl-20 ameliorates increased polyQ67 aggregation in the neurons of cey-2 mutants. The images are representative of three independent experiments. Statistical comparisons were made by two-tailed Student’s t test for unpaired samples. P values: *P < 0.05, **P < 0.01, ***P < 0.001, ****P < 0.0001, and NS, P > 0.05.

Similar articles

Cited by

References

    1. Hipp M. S., Kasturi P., Hartl F. U., The proteostasis network and its decline in ageing. Nat. Rev. Mol. Cell Biol. 20, 421–435 (2019). - PubMed
    1. Vilchez D., Saez I., Dillin A., The role of protein clearance mechanisms in organismal ageing and age-related diseases. Nat. Commun. 5, 5659 (2014). - PubMed
    1. Berendzen K. M., Durieux J., Shao L. W., Tian Y., Kim H. E., Wolff S., Liu Y., Dillin A., Neuroendocrine coordination of mitochondrial stress signaling and proteostasis. Cell 166, 1553–1563.e10 (2016). - PMC - PubMed
    1. Brandt C., Nolte H., Henschke S., Engstrom Ruud L., Awazawa M., Morgan D. A., Gabel P., Sprenger H. G., Hess M. E., Gunther S., Langer T., Rahmouni K., Fenselau H., Krüger M., Brüning J. C., Food perception primes hepatic ER homeostasis via melanocortin-dependent control of mTOR activation. Cell 175, 1321–1335.e20 (2018). - PMC - PubMed
    1. Frakes A. E., Metcalf M. G., Tronnes S. U., Bar-Ziv R., Durieux J., Gildea H. K., Kandahari N., Monshietehadi S., Dillin A., Four glial cells regulate ER stress resistance and longevity via neuropeptide signaling in C. elegans. Science 367, 436–440 (2020). - PMC - PubMed