

Serial sarcomere number is substantially decreased within the paretic biceps brachii in individuals with chronic hemiparetic stroke
- PMID: 34172565
- PMCID: PMC8256086
- DOI: 10.1073/pnas.2008597118
Serial sarcomere number is substantially decreased within the paretic biceps brachii in individuals with chronic hemiparetic stroke
Abstract
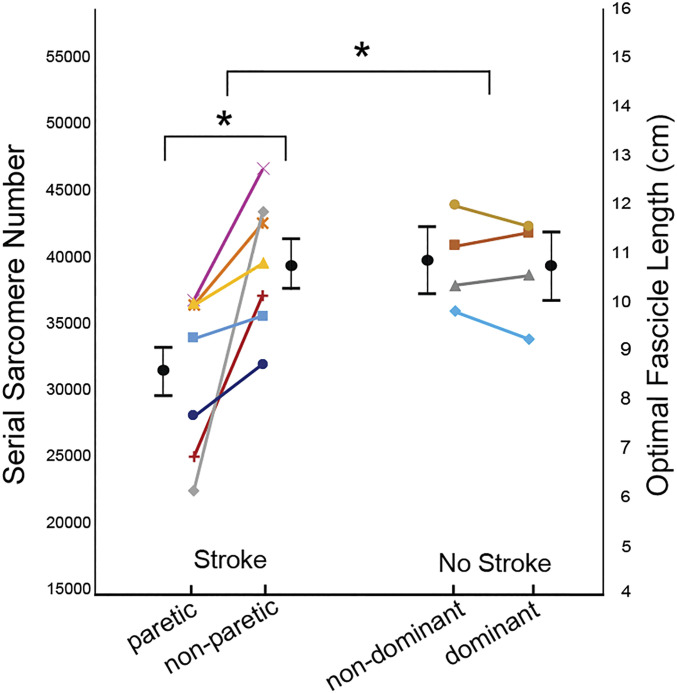
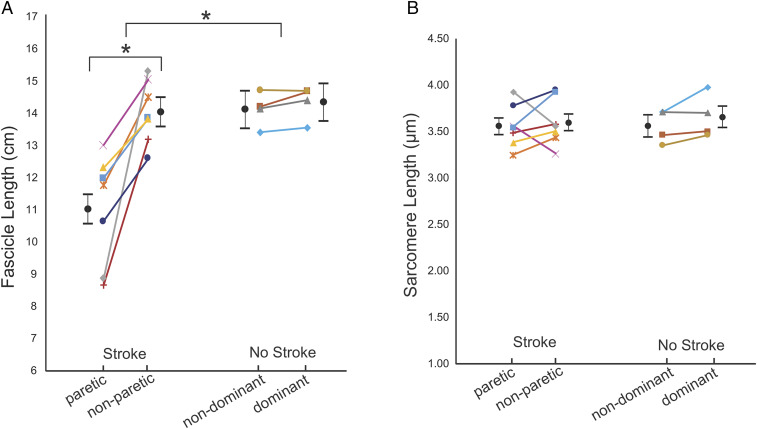
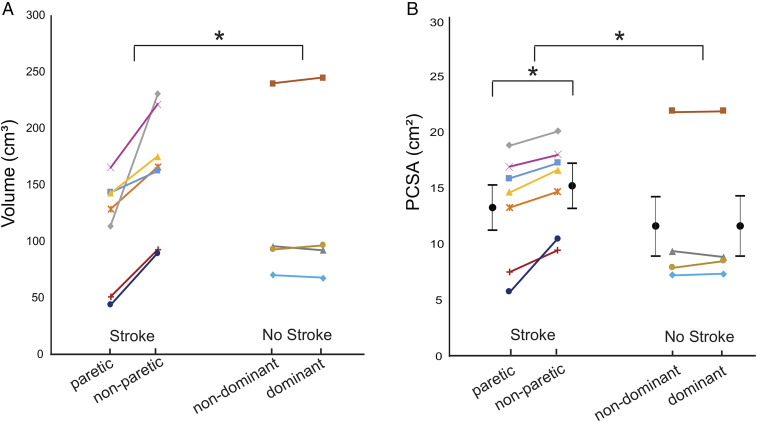
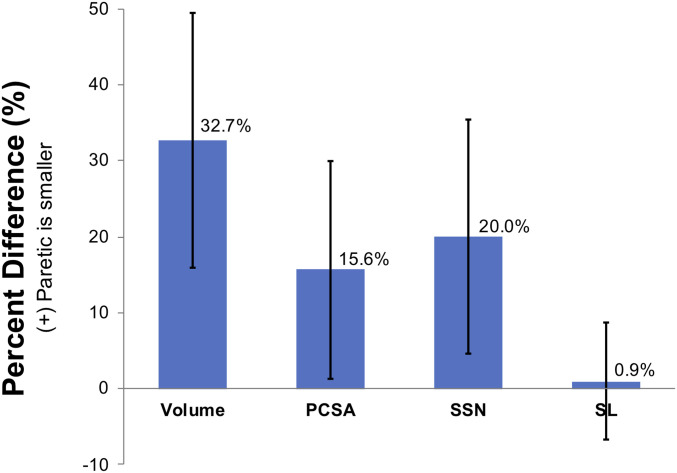
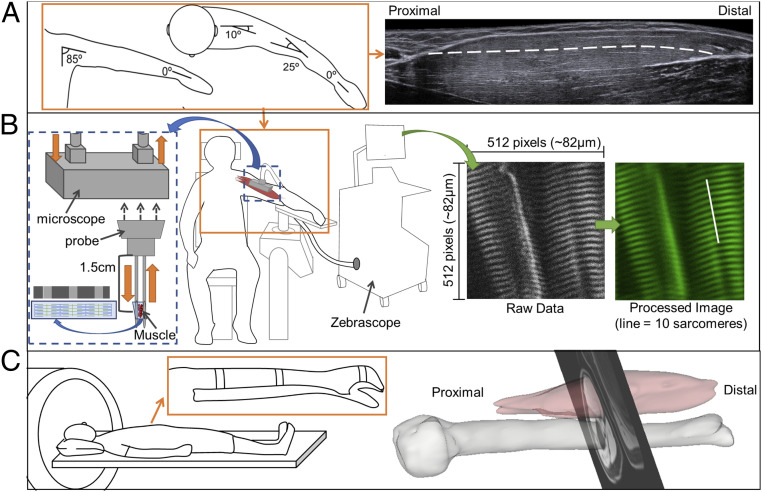
A muscle's structure, or architecture, is indicative of its function and is plastic; changes in input to or use of the muscle alter its architecture. Stroke-induced neural deficits substantially alter both input to and usage of individual muscles. We combined in vivo imaging methods (second-harmonic generation microendoscopy, extended field-of-view ultrasound, and fat-suppression MRI) to quantify functionally meaningful architecture parameters in the biceps brachii of both limbs of individuals with chronic hemiparetic stroke and in age-matched, unimpaired controls. Specifically, serial sarcomere number (SSN) and physiological cross-sectional area (PCSA) were calculated from data collected at three anatomical scales: sarcomere length, fascicle length, and muscle volume. The interlimb differences in SSN and PCSA were significantly larger for stroke participants than for participants without stroke (P = 0.0126 and P = 0.0042, respectively), suggesting we observed muscle adaptations associated with stroke rather than natural interlimb variability. The paretic biceps brachii had ∼8,200 fewer serial sarcomeres and ∼2 cm2 smaller PCSA on average than the contralateral limb (both P < 0.0001). This was manifested by substantially smaller muscle volumes (112 versus 163 cm3), significantly shorter fascicles (11.0 versus 14.0 cm; P < 0.0001), and comparable sarcomere lengths (3.55 versus 3.59 μm; P = 0.6151) between limbs. Most notably, this study provides direct evidence of the loss of serial sarcomeres in human muscle observed in a population with neural impairments that lead to disuse and chronically place the affected muscle at a shortened position. This adaptation is consistent with functional consequences (increased passive resistance to elbow extension) that would amplify already problematic, neurally driven motor impairments.
Keywords: fascicle; imaging; muscle; sarcomere; stroke.
Conflict of interest statement
The authors declare no competing interest.
Figures
Similar articles
-
Motor Impairment-Related Alterations in Biceps and Triceps Brachii Fascicle Lengths in Chronic Hemiparetic Stroke.Neurorehabil Neural Repair. 2018 Sep;32(9):799-809. doi: 10.1177/1545968318792618. Epub 2018 Aug 23. Neurorehabil Neural Repair. 2018. PMID: 30136897 Free PMC article.
-
Ultrasonographic measurements of fascicle length overestimate adaptations in serial sarcomere number.Exp Physiol. 2023 Oct;108(10):1308-1324. doi: 10.1113/EP091334. Epub 2023 Aug 23. Exp Physiol. 2023. PMID: 37608723 Free PMC article.
-
Age-related differences in the loss and recovery of serial sarcomere number following disuse atrophy in rats.Skelet Muscle. 2024 Aug 2;14(1):18. doi: 10.1186/s13395-024-00351-5. Skelet Muscle. 2024. PMID: 39095894 Free PMC article.
-
Age-related reductions in the number of serial sarcomeres contribute to shorter fascicle lengths but not elevated passive tension.J Exp Biol. 2021 May 15;224(10):jeb242172. doi: 10.1242/jeb.242172. Epub 2021 May 24. J Exp Biol. 2021. PMID: 34028517
-
The importance of serial sarcomere addition for muscle function and the impact of aging.J Appl Physiol (1985). 2023 Aug 1;135(2):375-393. doi: 10.1152/japplphysiol.00205.2023. Epub 2023 Jul 6. J Appl Physiol (1985). 2023. PMID: 37410905 Review.
Cited by
-
Multi-sweep 3-dimensional ultrasound is accurate for in vivo muscle volume quantification, expanding use to larger muscles.J Biomech. 2023 Apr;151:111501. doi: 10.1016/j.jbiomech.2023.111501. Epub 2023 Feb 23. J Biomech. 2023. PMID: 36905729 Free PMC article.
-
Does spastic myopathy determine active movement and ambulation speed in chronic spastic paresis?-A cross-sectional study on plantar flexors.PLoS One. 2024 Oct 24;19(10):e0310969. doi: 10.1371/journal.pone.0310969. eCollection 2024. PLoS One. 2024. PMID: 39446866 Free PMC article.
-
Effect of Stretching of Spastic Elbow Under Intelligent Control in Chronic Stroke Survivors-A Pilot Study.Front Neurol. 2021 Dec 14;12:742260. doi: 10.3389/fneur.2021.742260. eCollection 2021. Front Neurol. 2021. PMID: 34970204 Free PMC article.
-
Brachial plexus birth injury and cerebral palsy lead to a common contracture phenotype characterized by reduced functional muscle length and strength.Front Rehabil Sci. 2022 Aug 16;3:983159. doi: 10.3389/fresc.2022.983159. eCollection 2022. Front Rehabil Sci. 2022. PMID: 36188997 Free PMC article.
-
Changes in muscle-tendon unit length-force characteristics following experimentally induced photothrombotic stroke cannot be explained by changes in muscle belly structure.Eur J Appl Physiol. 2021 Sep;121(9):2509-2519. doi: 10.1007/s00421-021-04729-x. Epub 2021 Jun 1. Eur J Appl Physiol. 2021. PMID: 34061247 Free PMC article.
References
-
- Faria-Fortini I., Michaelsen S. M., Cassiano J. G., Teixeira-Salmela L. F., Upper extremity function in stroke subjects: Relationships between the international classification of functioning, disability, and health domains. J. Hand Ther. 24, 257–264, quiz 265 (2011). - PubMed
Publication types
MeSH terms
Grants and funding
LinkOut - more resources
Full Text Sources
Medical
