. 2021 Jun 29;118(26):e2023050118.
doi: 10.1073/pnas.2023050118.

Molecular design of the γδT cell receptor ectodomain encodes biologically fit ligand recognition in the absence of mechanosensing

Affiliations

Molecular design of the γδT cell receptor ectodomain encodes biologically fit ligand recognition in the absence of mechanosensing

Robert J Mallis et al. Proc Natl Acad Sci U S A. .

Abstract

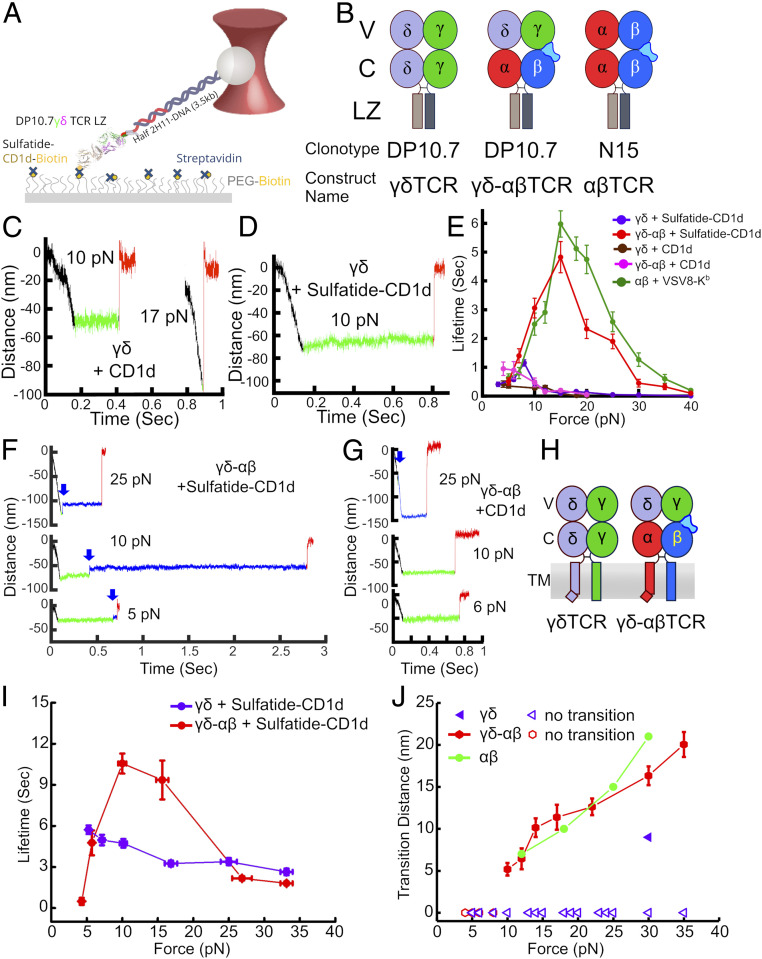
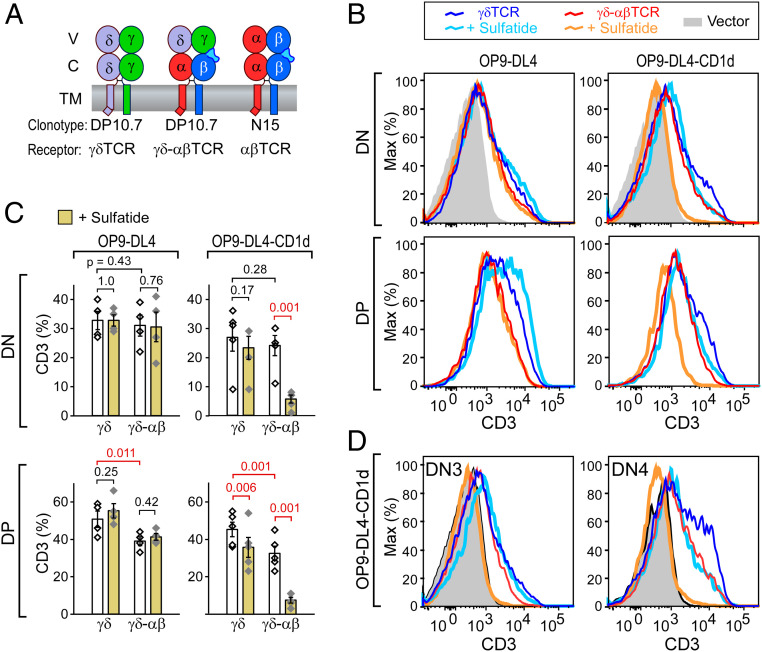
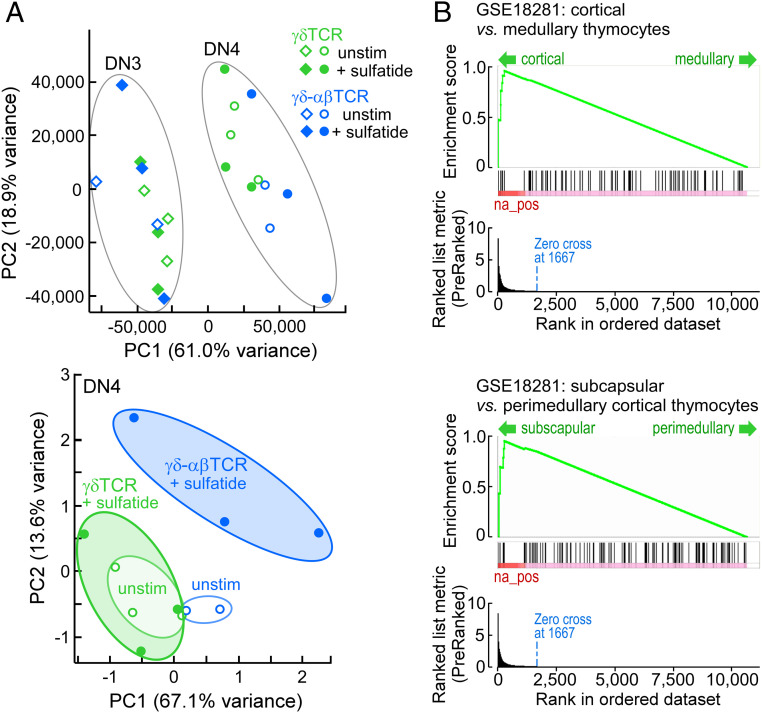
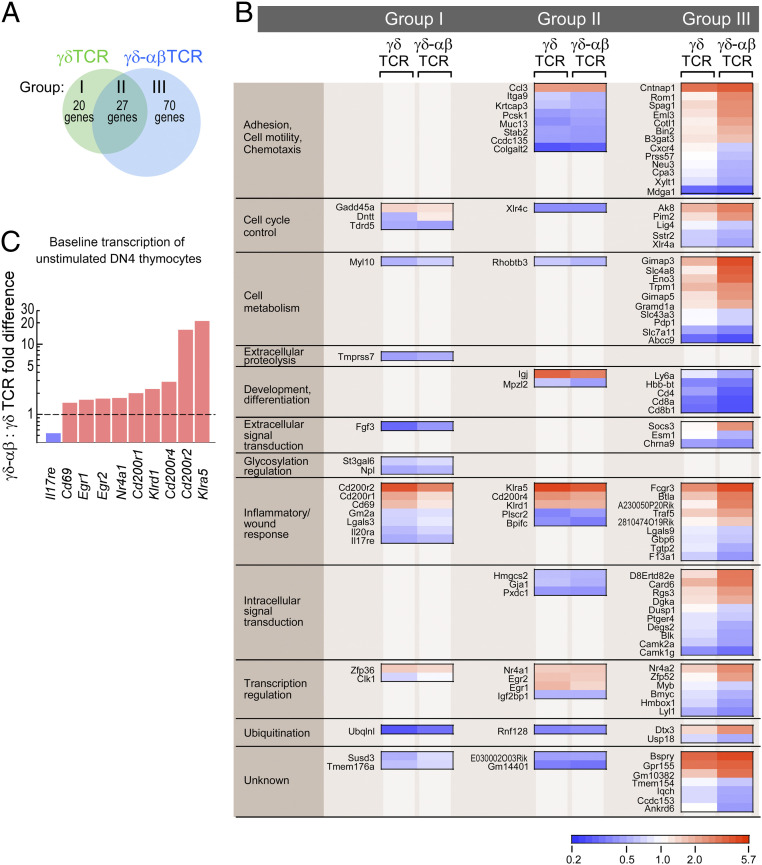
High-acuity αβT cell receptor (TCR) recognition of peptides bound to major histocompatibility complex molecules (pMHCs) requires mechanosensing, a process whereby piconewton (pN) bioforces exert physical load on αβTCR-pMHC bonds to dynamically alter their lifetimes and foster digital sensitivity cellular signaling. While mechanotransduction is operative for both αβTCRs and pre-TCRs within the αβT lineage, its role in γδT cells is unknown. Here, we show that the human DP10.7 γδTCR specific for the sulfoglycolipid sulfatide bound to CD1d only sustains a significant load and undergoes force-induced structural transitions when the binding interface-distal γδ constant domain (C) module is replaced with that of αβ. The chimeric γδ-αβTCR also signals more robustly than does the wild-type (WT) γδTCR, as revealed by RNA-sequencing (RNA-seq) analysis of TCR-transduced Rag2-/- thymocytes, consistent with structural, single-molecule, and molecular dynamics studies reflective of γδTCRs as mediating recognition via a more canonical immunoglobulin-like receptor interaction. Absence of robust, force-related catch bonds, as well as γδTCR structural transitions, implies that γδT cells do not use mechanosensing for ligand recognition. This distinction is consonant with the fact that their innate-type ligands, including markers of cellular stress, are expressed at a high copy number relative to the sparse pMHC ligands of αβT cells arrayed on activating target cells. We posit that mechanosensing emerged over ∼200 million years of vertebrate evolution to fulfill indispensable adaptive immune recognition requirements for pMHC in the αβT cell lineage that are unnecessary for the γδT cell lineage mechanism of non-pMHC ligand detection.

Keywords: T cell activation; T cell receptor; mechanosensor; optical tweezers; γδT cells.


Conflict of interest statement

The authors declare no competing interest.

Figures

Fig. 1.
Fig. 1.
Structural features of γδ and αβTCRs. (A) Structural comparison of TCRαβ (Top) with TCRγδ (Bottom). The Left two panels in each row show surface representations with individual subunits and domains delineated. The FG loop is shown in light blue (TCRαβ) or yellow (TCRγδ) and highlighted in the boxed region. The Right two panels of each row present a zoomed view of the boxed region at approximately the same magnification for each TCR to illustrate the relative size and structure of the respective FG loops. (B) Multiple sequence alignment of mammalian TCR Cβ, Cγ domains, and equivalent Ig CH1 domains of selected isotypes. Secondary structure as assigned in the murine N15αβ X-ray structure 1NFD are indicated. The FG-loop region is boxed. Invariant cysteines are highlighted in red-brown and conserved residues denoted in black and gray.
Fig. 2.
Fig. 2.
Comparison of interdomain contacts within TCRγδ, TCRαβ, and TCRγδ–αβ chimera. A 100- to 300-ns interval during MD simulation for each system was used for analysis (Materials and Methods). (A) Average number of contacts with occupancy greater than 80% (bar: SD of measurements in 10 overlapping time windows of size 36.4 ns). HB, hydrogen bond; NP, nonpolar contact. Locations of these contacts within each structure are shown in SI Appendix, Fig. S1. For the Cγ–Cδ interface, two hydrogen bonds were counted in all 10 windows, hence it has no error bar (red in the first HB group). Asterisk shows average number of contacts between TCRγδ and the TCRγδ–αβ chimera differing with significance level smaller than 10−5. (B) Comparison of the Vγ–Cγ interface and the Vγ–Cβ interface. Constant domains have surface representations overlaid in semitransparent colors, as approximate markers for their boundaries. Number of contacts of occupancy greater than 80% are marked (cf., SI Appendix, Fig. S1). Among the 10 Vγ–Cβ interface bonds, the CβFG loop contributes one H bond and three nonpolar contacts. Boxes highlight the difference in conformations between the two systems, where the valley created by the FG loop in Cβ helps with stabilizing Vγ.
Fig. 3.
Fig. 3.
SM and SMSC measurement of TCRγδ DP10.7–CD1d interaction. (A) LZ-coupled TCR is bound to acid-base LZ-specific half-mAb 2H11 coupled to a DNA linker attached to a polystyrene bead held in an optical trap. Biotinylated CD1d is bound to streptavidin, which is itself bound to PEG–biotin that is attached to the movable piezo stage. (B) Constructs used in SM experiments. (C) Representative SM traces for DP10.7 interaction with CD1d lacking exogenous ligand (CD1d) at 10 or 17 pN. Force load is applied in the black section of the trace, binding dwell is the green section and bond dissociation is the red section. (D) SM trace of DP10.7 interaction with CD1d bound to sulfatide (sulfatide–CD1d) with 10 pN pulling force. (E) Force vs. lifetime plot for the DP10.7 TCRγδ (purple curve, n = 191) or DP10.7γδ–αβ chimera (red curve, n = 126) interaction with sulfatide–CD1d, TCRγδ (brown curve, n = 101) or γδ–αβ (pink curve, n = 92) with CD1d, or N15αβ interaction with its cognate ligand VSV8/H-2Kb (30) (green curve, n = 192). Error bars indicate SEM. (F) SM traces at indicated forces for DP10.7γδ–αβ chimera interaction with CD1d–sulfatide. Initial binding dwell is shown in green and posttransition dwell in blue. Transition points are indicated in each trajectory with blue arrows. Black and red sections are as in C. (G) SM traces at indicated forces for DP10.7γδ–αβ chimera interaction with CD1d with color coding as in F. A transition was identified in the 25-pN trace (blue arrow). (H) Constructs used in SMSC optical trap assay are indicated. Note that the TCRδ TM is depicted with a bend analogous to that of TCRα (28), although there is currently no data to confirm either a bipartite or single helix structure. (I) SMSC optical trap assay force vs. lifetime plot for the DP10.7 TCRγδ interaction (purple curve, n = 45) or DP10.7γδ–αβ chimera (red curve, n = 44) interaction with sulfatide–CD1d. Error bars indicate SEM. (J) Transition distances for DP10.7γδ–αβ chimera (red curve, 23 of 44) interaction with sulfatide–CD1d from traces acquired by SMSC as compared to N15αβ (19) (green curve, n = 15). Error bars indicate SEM. For reference only a single, shorter transition was found in 45 traces for DP10.7 TCRγδ interaction with sulfatide–CD1d (purple triangles, see key).
Fig. 4.
Fig. 4.
Thymocyte response to ligand in stromal cultures. (A) Constructs used in in vitro thymic stromal culture. (B) Surface CD3 FACS fluorescence-activated cell sorting (FACS) analysis of DP10.7γδ (γδTCR) or DP10.7γδ–αβ (γδ–αβTCR)-transduced thymocytes cultured for 8 d in the absence or presence of sulfatide in coculture with parental OP9–DL4 stromal cells or OP9–DL4 cells stably transfected with human CD1d (OP9–DL4–CD1d). All cells were gated with FSC-A and SSC-A to isolate thymocytes then GFP+CD45+ to select transfected thymocytes. CD4+CD8+ = DP; CD4CD8 = DN (SI Appendix, Fig. S6A). Note: DP thymocytes fail to develop with vector transduction only. (C) Statistical analysis of five independent experiments as represented in B. Significance (P value) was determined by linear regression analysis. White bars are from cultures treated with dimethyl sulfoxide vehicle only, yellow are sulfatide treated. (D) Surface CD3 FACS analysis of DN3 and DN4 subsets in response to sulfatide ligand in OP9–DL4–CD1d stromal cell culture. Histogram colors are as in B.
Fig. 5.
Fig. 5.
Transcriptome analysis of DN3 and DN4 transduced thymocytes after 8 d of coculture with OP9–DL4–CD1d stromal cells in the presence or absence of sulfatide. (A) Global PCA of all populations delineates DN3 and DN4 populations (Upper). Restricted PCA of DN4 cells separates the cell states independent of the DN3-to-DN4 drivers (Lower). Ellipses in both panels provide a visual measure of overlap or separation of the indicated populations. Data represent three independent experiments for each condition except for γδ–αβTCR unstimulated (n = 2). (B) Gene set enrichment analysis (MSigDB C7 immune signatures) identifies the DN4 γδ–αβTCR sulfatide-stimulated transcriptome signature as being consistent with that of cortical thymocytes (Upper) with a subcapsular location (Lower).
Fig. 6.
Fig. 6.
Gene signatures for DP10.7γδ (γδTCR) or DP10.7γδ–αβ (γδ–αβTCR) control and sulfatide-stimulated states. (A) For DN4 thymocytes bearing γδ or γδ–αβ TCRs and developing on OP9–DL4–CD1d stromal cells in the absence or presence of sulfatide, RNA was isolated and gene expression profiles were determined by RNA-seq. For each TCR, gene expression profiles delineating the stimulated from the control state were determined using a threshold for p.adj ≤ 0.1. Gene signatures were defined as present only in γδTCR-bearing cells (group I), only in γδ–αβTCR-bearing cells (group III), or shared in both conditions (group II). (B) Heat map profiles, ordered into functional groupings (Left column) for the genes in developing γδ–αβTCR DN4 thymocytes identified as being significantly regulated in the presence of sulfatide. Expression profiles for the same genes developing in γδTCR-bearing thymocytes are also depicted. The scale indicates fold reduction (blue) or fold increase (red). White indicates no fold difference between control and stimulated state. For group I, the fold differences after stimulation did not differ significantly between γδTCR and γδ–αβTCR (P = 0.069) but for all γδTCR transcripts, p.adj ≤ 0.1 and for all γδ–αβTCR, p.adj > 0.1. For group II, p.adj ≤ 0.1 for all indicated genes with no significant difference in fold change. For group III, only the γδ–αβTCR transcripts have a p.adj ≤ 0.1 with an overall significant fold change over γδTCR (P < 0.0001). (C) For select genes in group I and group II, fold differences between γδ–αβTCR- and γδTCR-bearing thymocytes in the unstimulated control condition are presented. The dashed line delineates identity between γδTCR- and γδ–αβTCR-unstimulated expression levels. For all fold differences depicted (pink for γδ–αβTCR > γδTCR, blue for γδ–αβTCR < γδTCR), P < 0.05.

References

    1. Castro C. D., Luoma A. M., Adams E. J., Coevolution of T-cell receptors with MHC and non-MHC ligands. Immunol. Rev. 267, 30–55 (2015). - PMC - PubMed
    1. Davis M. M., Bjorkman P. J., T-cell antigen receptor genes and T-cell recognition. Nature 334, 395–402 (1988). - PubMed
    1. Wang J. H., Reinherz E. L., The structural basis of αβ T-lineage immune recognition: TCR docking topologies, mechanotransduction, and co-receptor function. Immunol. Rev. 250, 102–119 (2012). - PMC - PubMed
    1. Das S., et al. ., Evolution of two prototypic T cell lineages. Cell. Immunol. 296, 87–94 (2015). - PMC - PubMed
    1. Nielsen M. M., Witherden D. A., Havran W. L., γδ T cells in homeostasis and host defence of epithelial barrier tissues. Nat. Rev. Immunol. 17, 733–745 (2017). - PMC - PubMed

Publication types

MeSH terms

Substances