. 2021 Jun 25;6(60):eabg4176.
doi: 10.1126/sciimmunol.abg4176.

CD36 family members are TCR-independent ligands for CD1 antigen-presenting molecules

Affiliations

CD36 family members are TCR-independent ligands for CD1 antigen-presenting molecules

Nicholas A Gherardin et al. Sci Immunol. .

Abstract

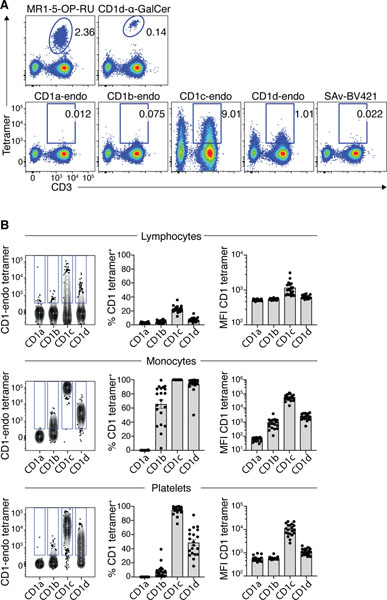
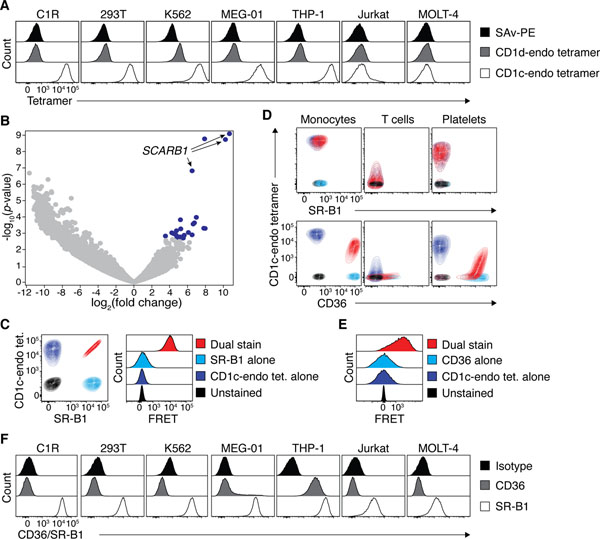
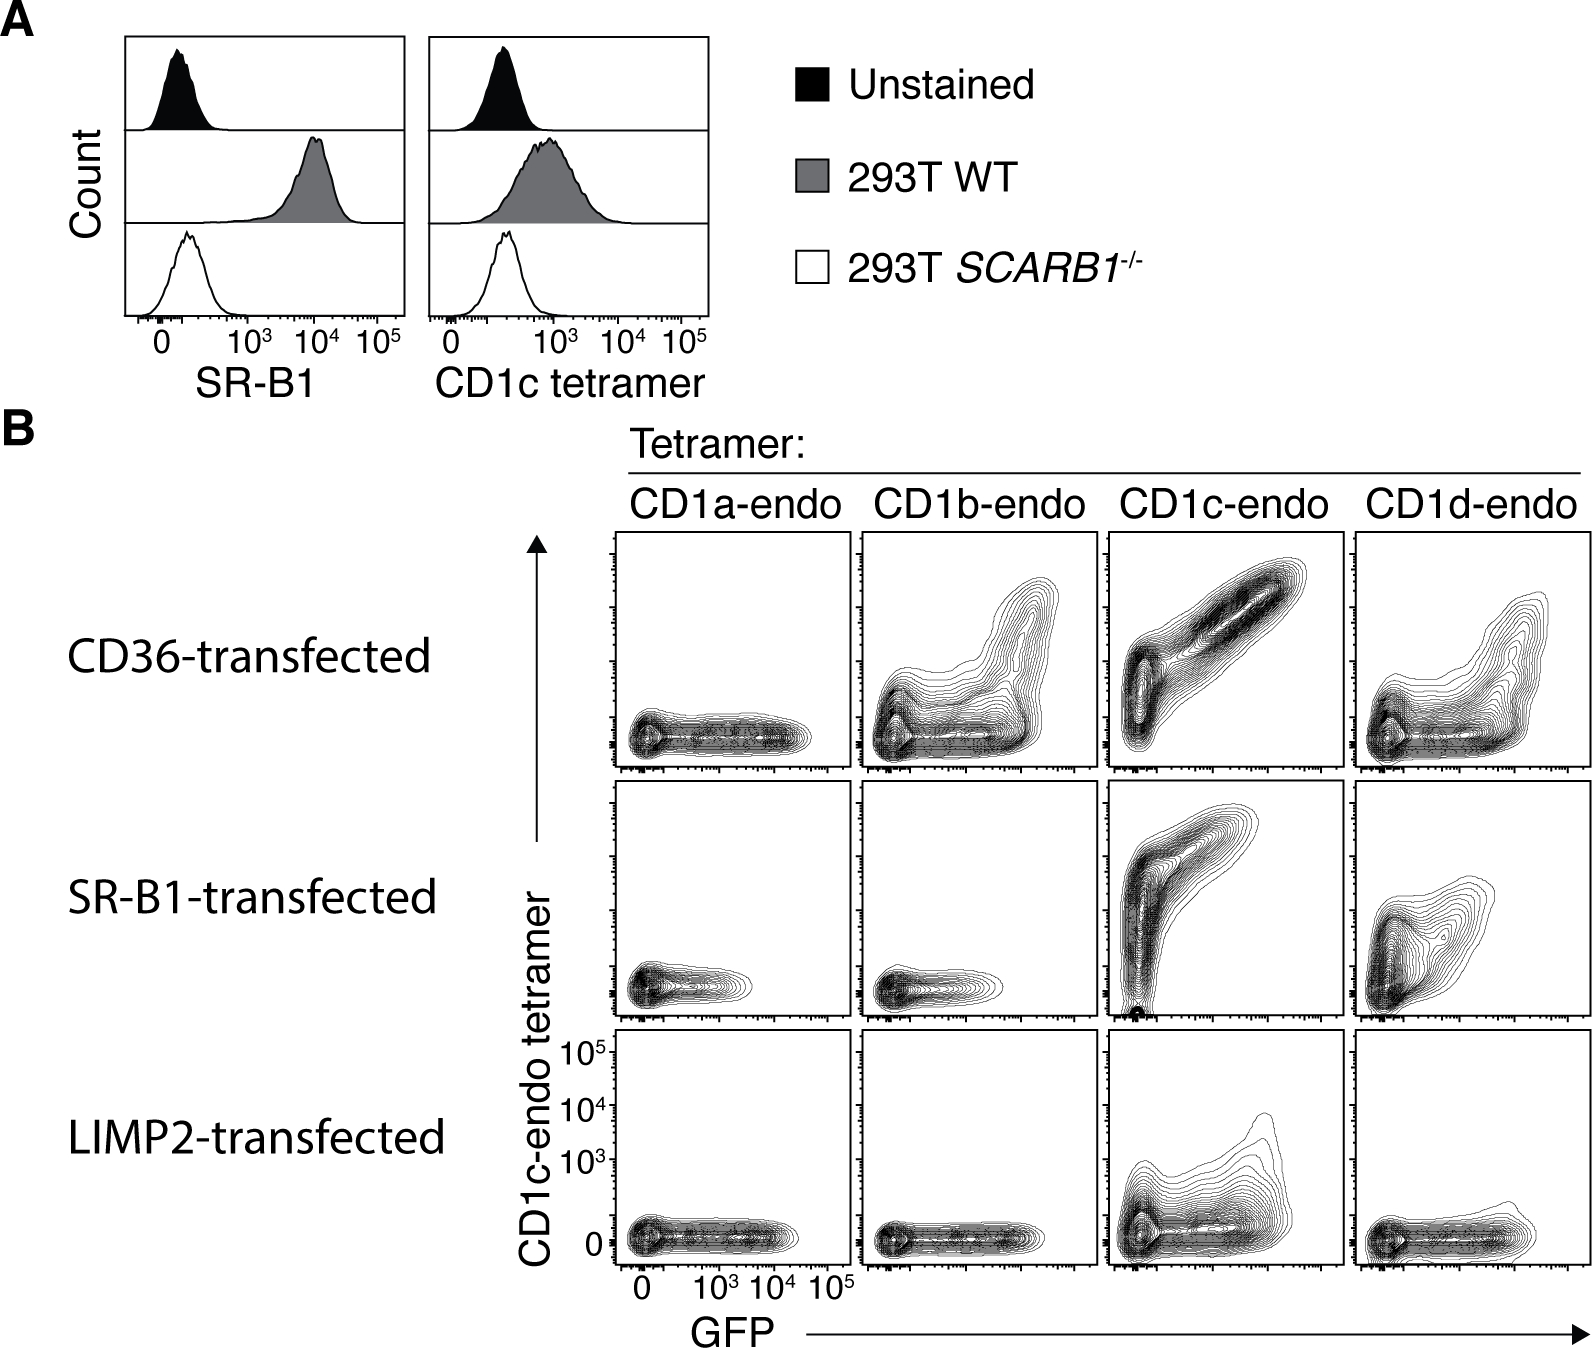
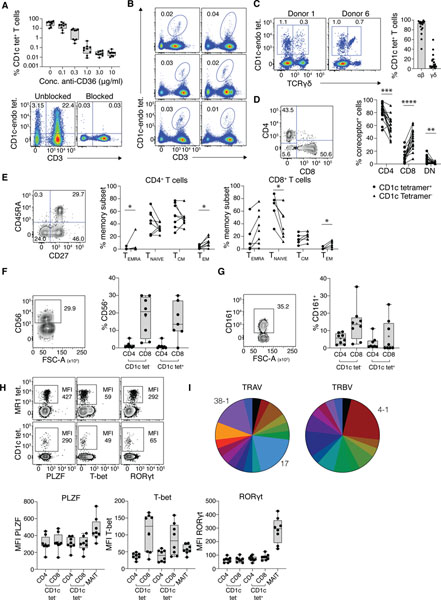
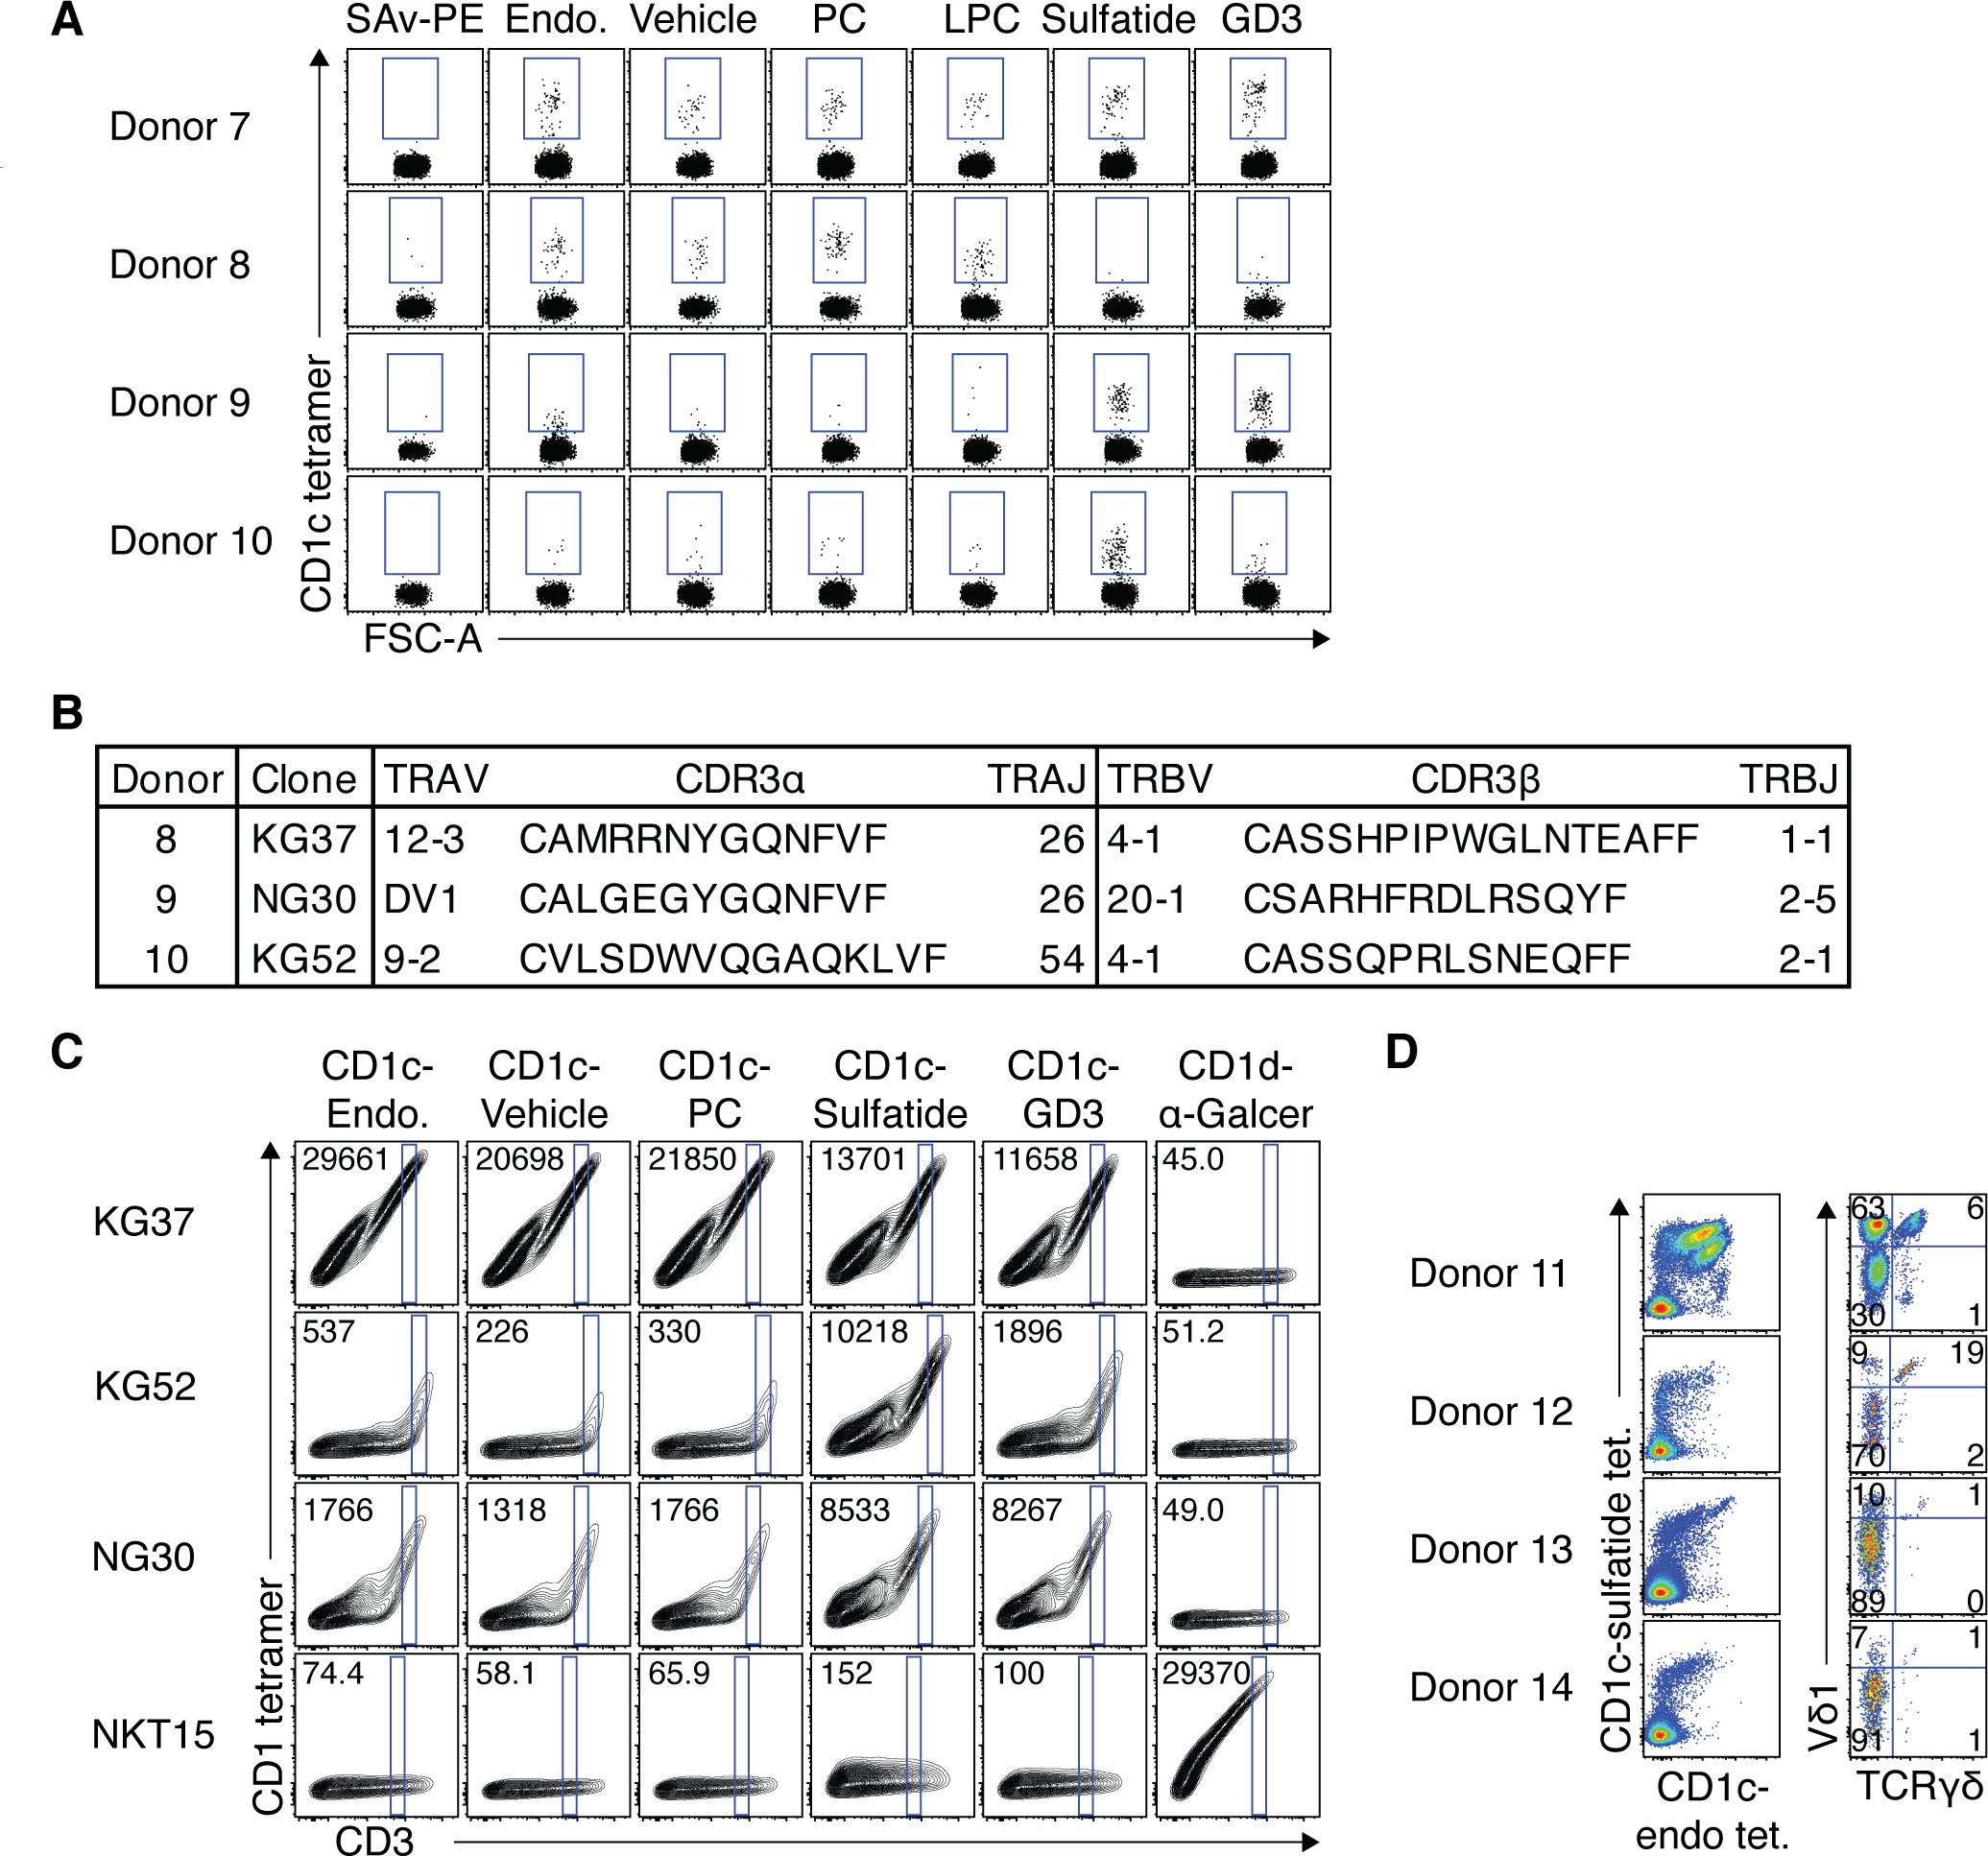
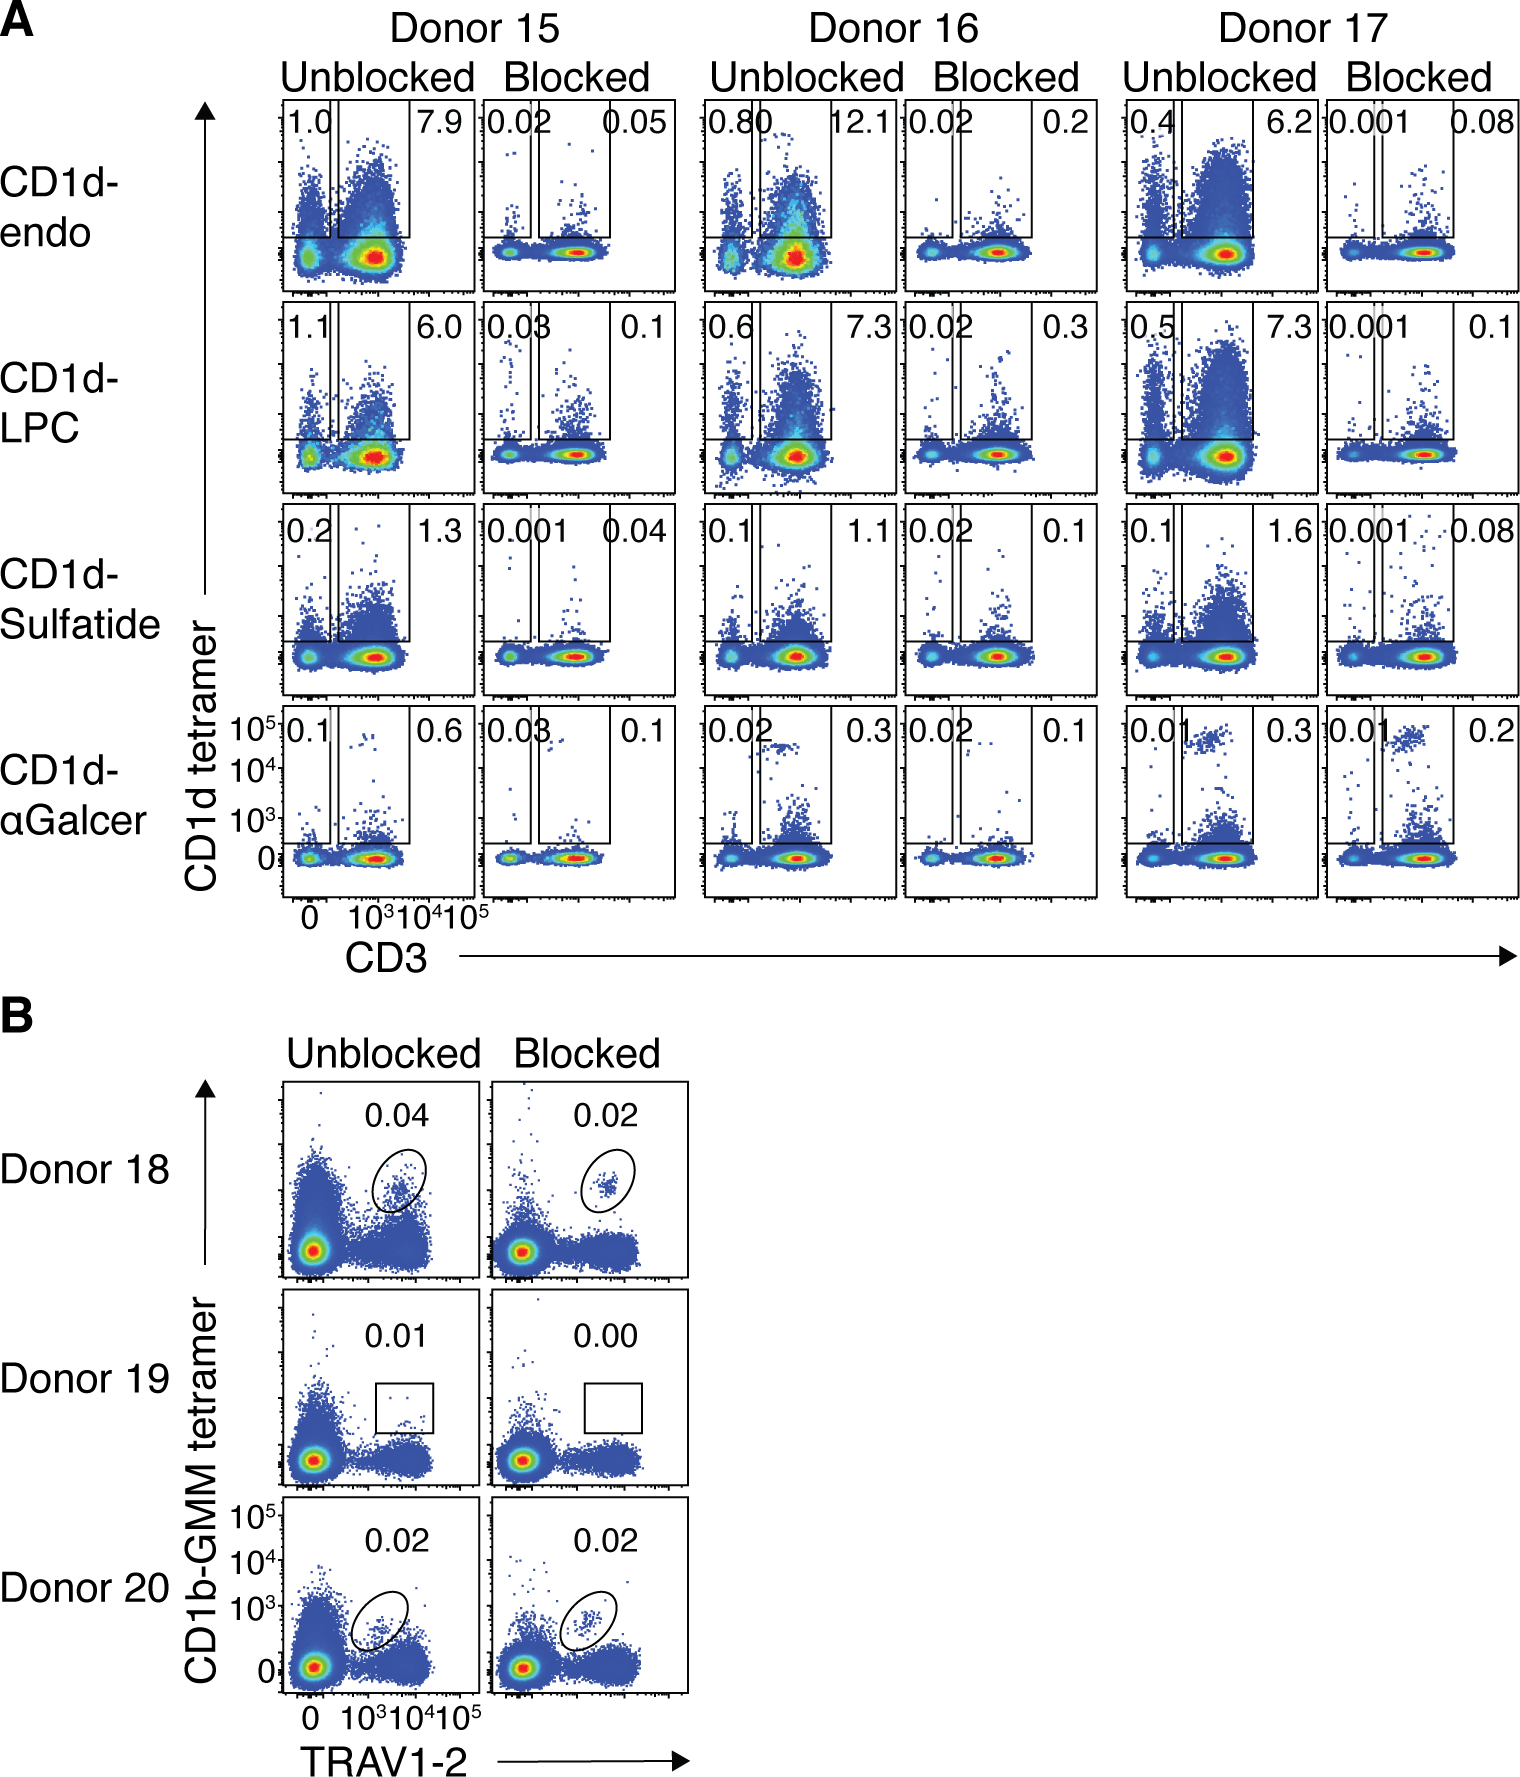
CD1c presents lipid-based antigens to CD1c-restricted T cells, which are thought to be a major component of the human T cell pool. However, the study of CD1c-restricted T cells is hampered by the presence of an abundantly expressed, non-T cell receptor (TCR) ligand for CD1c on blood cells, confounding analysis of TCR-mediated CD1c tetramer staining. Here, we identified the CD36 family (CD36, SR-B1, and LIMP-2) as ligands for CD1c, CD1b, and CD1d proteins and showed that CD36 is the receptor responsible for non-TCR-mediated CD1c tetramer staining of blood cells. Moreover, CD36 blockade clarified tetramer-based identification of CD1c-restricted T cells and improved identification of CD1b- and CD1d-restricted T cells. We used this technique to characterize CD1c-restricted T cells ex vivo and showed diverse phenotypic features, TCR repertoire, and antigen-specific subsets. Accordingly, this work will enable further studies into the biology of CD1 and human CD1-restricted T cells.


Figures

Figure 1:
Figure 1:. CD1-endo tetramers exhibited non-TCR-mediated binding to diverse blood cells.
A. Representative flow cytometric pseudo-colour plots showing tetramer staining on CD3+ T cells and CD3 lymphocytes using MR1–5-OP-RU, CD1d-αGalCer, CD1a-endo, CD1b-endo, CD1c-endo and CD1d-endo BV421 tetramers. Representative of n=6 donors. B. Comparison of staining profiles of CD1-endo PE tetramers on lymphocytes (CD45+), monocytes (CD14+, SSC-AHI and FSC-AHI) and platelets (CD42b+ SSC-Alow and FSC-Alow). Left panel: contour plots showing concatenated CD1-endo tetramer staining profiles from the same donor. Different CD1-endo tetramers were used to stain separate samples and the data subsequently concatenated. Gates were set based on FMO. Middle panel: Bar graphs showing the proportion of cells staining with each CD1-endo tetramer (n=20). Right panel: Bar graphs showing median fluorescence intensity (MFI) of CD1-endo tetramer positive cells (n=20). SAv = streptavidin.
Figure 2:
Figure 2:. Identification of SR-B1 and CD36 as CD1 binding partners.
A. Representative histogram overlays showing CD1c- and CD1d-endo tetramer staining on diverse cell lines. B. Volcano plot showing relative expression of gRNAs between C1R cells transduced with the GeCKO v1 human CRISPR knockout library versus those enriched for an inability to bind CD1c-endo tetramers. Blue data points represent guides significantly overrepresented with a false discovery rate <0.05 in the enriched pool. Arrows point to guides targeting the SCARB1 gene. C. Left plot: Representative Overlaid contour plots of C1R cells that were unstained (black), single labelled (navy/light blue) or co-labelled (red) with CD1c-endo tetramers and/or anti-SR-B1. Right plot: Representative histogram overlays of these cells showing emission in the FRET channel. D. Representative overlaid contour plots of blood cell subsets that were unstained (black), single labelled (navy/light blue) or co-labelled (red) with CD1c-endo tetramers and/or anti-SR-B1 (top panel) or anti-CD36 (bottom panel). Colour code as per C and E for SR-B1 and CD36 respectively E. Representative histogram overlays of cells in D. stained with anti-CD36, showing emission in the FRET channel. F. Representative histogram overlays showing CD36 and SR-B1 staining on diverse cell lines. All subfigures presenting FACS data are representative of 3 independent experiments.
Figure 3:
Figure 3:. CD36 family members bound to CD1 molecules.
A. Representative histogram overlays showing SR-B1 and CD1c-endo tetramer staining on wildtype and SCARB1-deficient 293T cells. B. Representative contour plots showing CD1-endo tetramer staining on 293T.SCARB1−/− cells transiently transfected to express CD36, SR-B1 or LIMP2. Data are representative of 3 independent experiments each.
Figure 4:
Figure 4:. CD36 blockade enabled characterisation of CD1c-reactive T cells.
A. Upper panel: Bar graph showing the proportion of CD3+ T cells in PBMC that stain with CD1c-endo tetramers after blocking with titrating doses of anti-CD36 (n=9). Lower panel: Representative FACS plots from the n=9 donors showing CD1c-endo staining on lymphocytes with and without complete CD36 blockade, gated on CD14, CD19 viable lymphocytes. B. Representative FACS plots showing CD1-endo tetramer+ T cells on 6 selected PBMC samples after CD36-blockade, gated as per A. C. Left panel: Representative FACS plots from 2 donor samples showing CD1c-endo tetramer staining on CD3+ T cells after magnetic enrichment from PBMC using CD1c-endo tetramers, post CD36 blockade. Gated on CD3+, CD14, CD19 viable lymphocytes. Right panel: Bar graph showing distribution of γδ and αβ T cells amongst CD1c-endo tetramer+ T cells from n=16 enriched PBMC samples. D. Coreceptor distribution of magnetically-enriched CD1c-endo-restricted αβ T cells. Left panel: representative FACS plot of CD4 and CD8 staining. Right panel: Line graph showing coreceptor distribution from n=16 donors. E. Memory subset distribution of magnetically-enriched CD1c-endo-restricted αβ T cells. Left panel: representative FACS plot of CD27 and CD45RA staining. Middle and right panels: Line graphs showing memory subset distribution of CD4 (middle) and CD8 (right) T cell subsets from n=8 donors. F-G. Innate surface marker expression on magnetically-enriched CD1c-endo-restricted αβ T cells. Left panels: representative FACS plot of CD56 (F) or CD161 (G) staining. Right panel: Bar graph showing CD56 or CD161 expression on n=8 donors. H. Transcription factor expression. Upper panel: Representative FACS plot of transcription factor staining from n=8 donors on MAIT versus non-MAIT cells from the enriched samples. Lower panel: Bar graphs showing transcription factor expression on CD4+ or CD8+ cells from CD1c-endo tetramer+ (CD1c tet+), CD1c-endo tetramer (CD1c tet−) or MAIT cells in the enriched sample, from n=8 donors. I. Pie charts showing distribution of distinct TRAV (left) and TRBV (right) genes used by n=24 CD1c-endo tetramer+ αβ T cells annotated in table 1. Enriched genes are labelled, remaining genes are differentiated by colour only.
Figure 5:
Figure 5:. Lipid-antigen discrimination by CD1c-restricted T cells.
A. Dot plots showing staining of CD3+ T cells from 4 donors with CD1c tetramers loaded with PC, LPC, sulfatide or GD3 compared to CD1c-endo or tyloxapol vehicle control. Streptavidin-PE (SAv-PE) was also used a negative staining control. B. Table showing TCR sequences derived from CD1c tetramer+ populations in figure A. C. Representative contour plots showing CD1-lipid tetramer staining of 293T.SCARB1−/− cells transiently transfected to express CD1c-restricted TCRs from table in B or control NKT TCR clone NKT15. Consistent gates were set on a ‘window’ of CD3 expression across the different tetramer for each transfection, and median fluorescent intensity (MFI) of events in that gate is depicted in the top left of each plot. Experiment was performed 5 times for KG37, KG52 and NKT15 and 3 times for NG30, with similar results in each experiment. D. FACS plots from 4 donor PBMC samples co-stained and magnetically enriched with both CD1c-sulfatide and CD1c-endo tetramers. Left panel shows CD1c tetramer co-staining on enriched CD3+ T cells. Right panel shows TCRγδ and Vδ1 staining on total CD1c tetramer+ T cells.
Figure 6:
Figure 6:. CD36-blockade facilitated ex vivo analysis of type II NKT cells and GEM-T cells.
A. FACS plots from 3 healthy donor PBMC samples (representative of a cohort of 8) showing CD1d tetramer staining on lymphocytes with and without CD36-blockade. B. FACS plots from 3 healthy donor PBMC samples showing CD1b-GMM tetramer staining on CD4+ T cells with and without CD36-blockade.

Similar articles

Cited by

References

    1. Rossjohn J, Gras S, Miles JJ, Turner SJ, Godfrey DI, McCluskey J, T cell antigen receptor recognition of antigen-presenting molecules. Annual review of immunology 33, 169–200 (2015). - PubMed
    1. Godfrey DI, Uldrich AP, McCluskey J, Rossjohn J, Moody DB, The burgeoning family of unconventional T cells. Nature immunology 16, 1114–1123 (2015). - PubMed
    1. Van Rhijn I, Godfrey DI, Rossjohn J, Moody DB, Lipid and small-molecule display by CD1 and MR1. Nature reviews. Immunology 15, 643–654 (2015). - PMC - PubMed
    1. Cotton RN, Shahine A, Rossjohn J, Moody DB, Lipids hide or step aside for CD1-autoreactive T cell receptors. Current opinion in immunology 52, 93–99 (2018). - PMC - PubMed
    1. Brigl M, Brenner MB, CD1: antigen presentation and T cell function. Annual review of immunology 22, 817–890 (2004). - PubMed

Publication types