

HIV and Sexually Transmitted Infection Epidemic Potential of Networks of Men Who Have Sex With Men in Two Cities
- PMID: 34172692
- PMCID: PMC8338912
- DOI: 10.1097/EDE.0000000000001390
HIV and Sexually Transmitted Infection Epidemic Potential of Networks of Men Who Have Sex With Men in Two Cities
Abstract
Background: The speed with which a pathogen circulates in a sexual network is a function of network connectivity. Cross-sectional connectivity is a function of network features like momentary degree and assortative mixing. Temporal connectivity is driven by partner acquisition rates. The forward-reachable path (FRP) has been proposed as a summary measure of these two aspects of transmission potential. We use empirical data from San Francisco and Atlanta to estimate the generative parameters of the FRP and compare results to the HIV/sexually transmitted infection epidemics in each city.
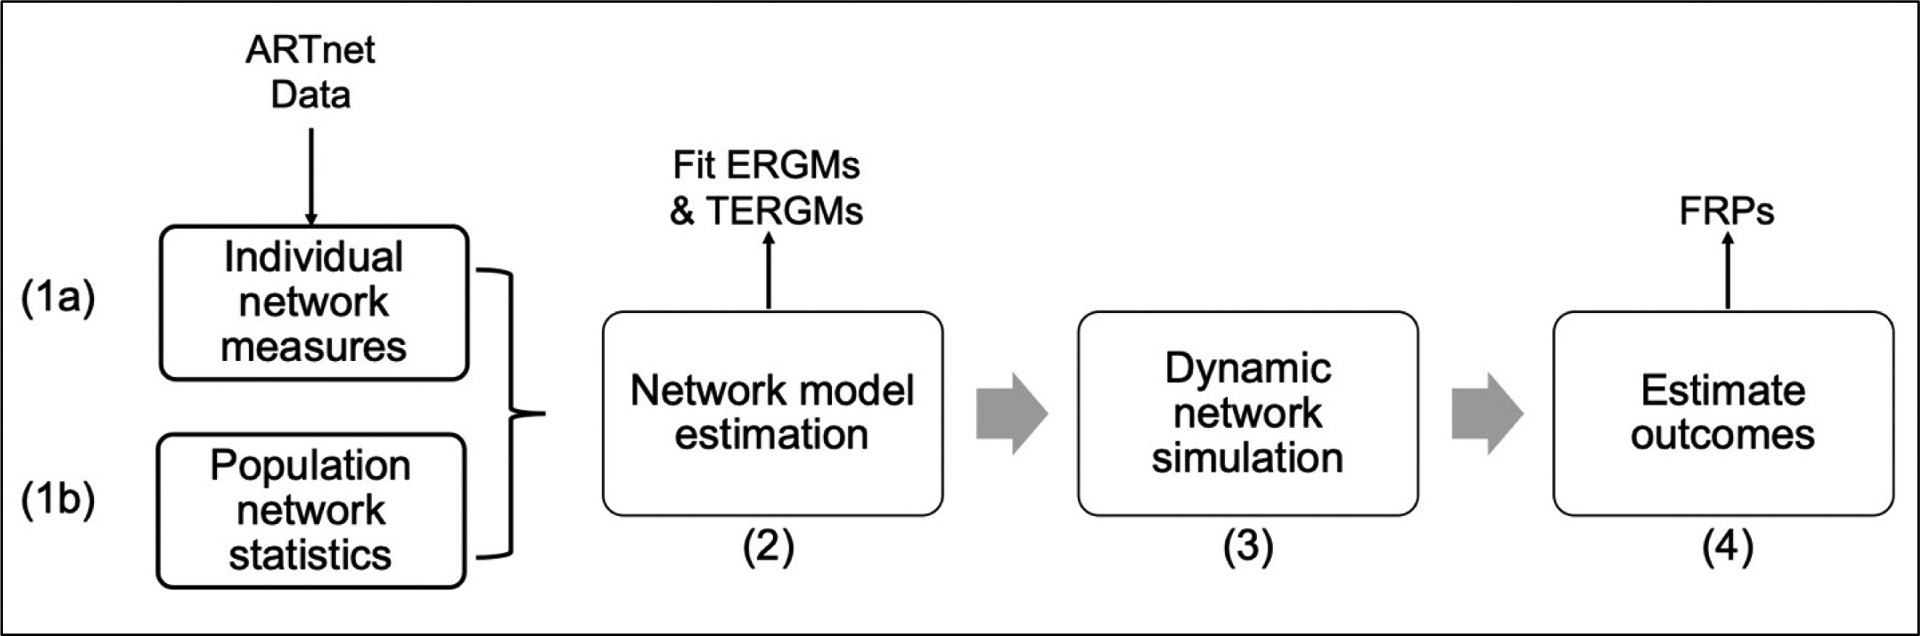
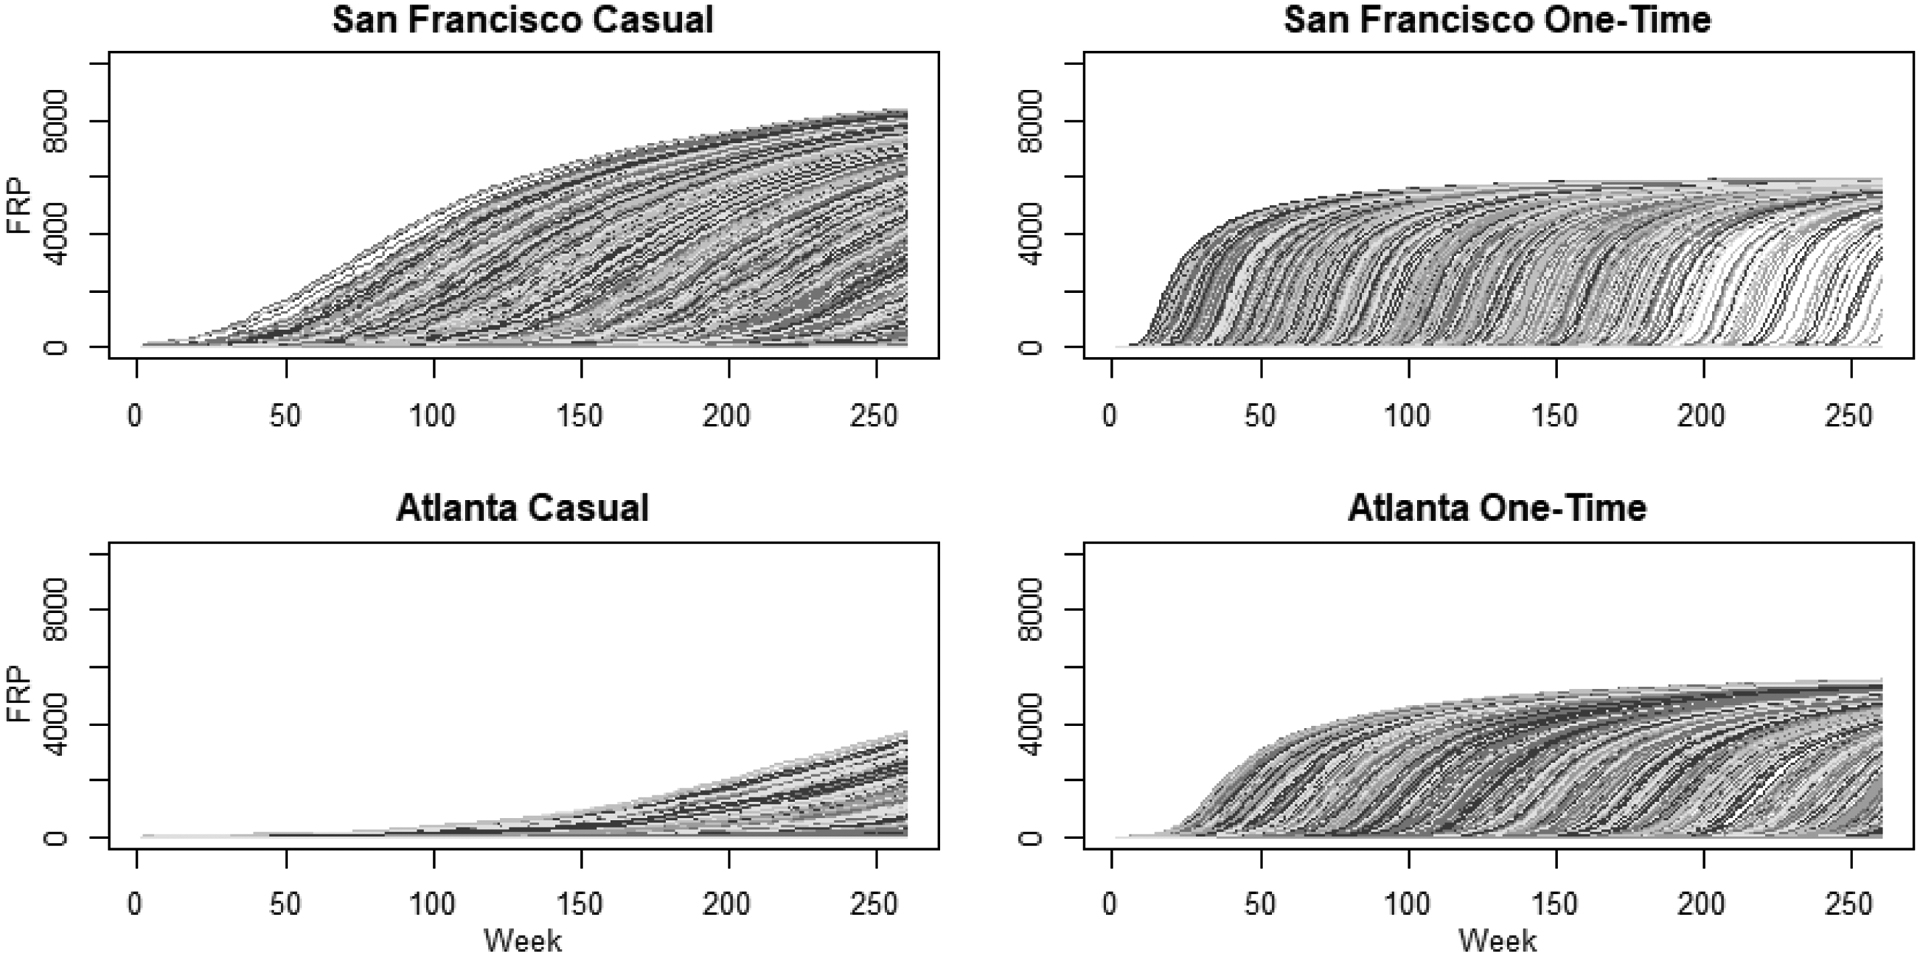
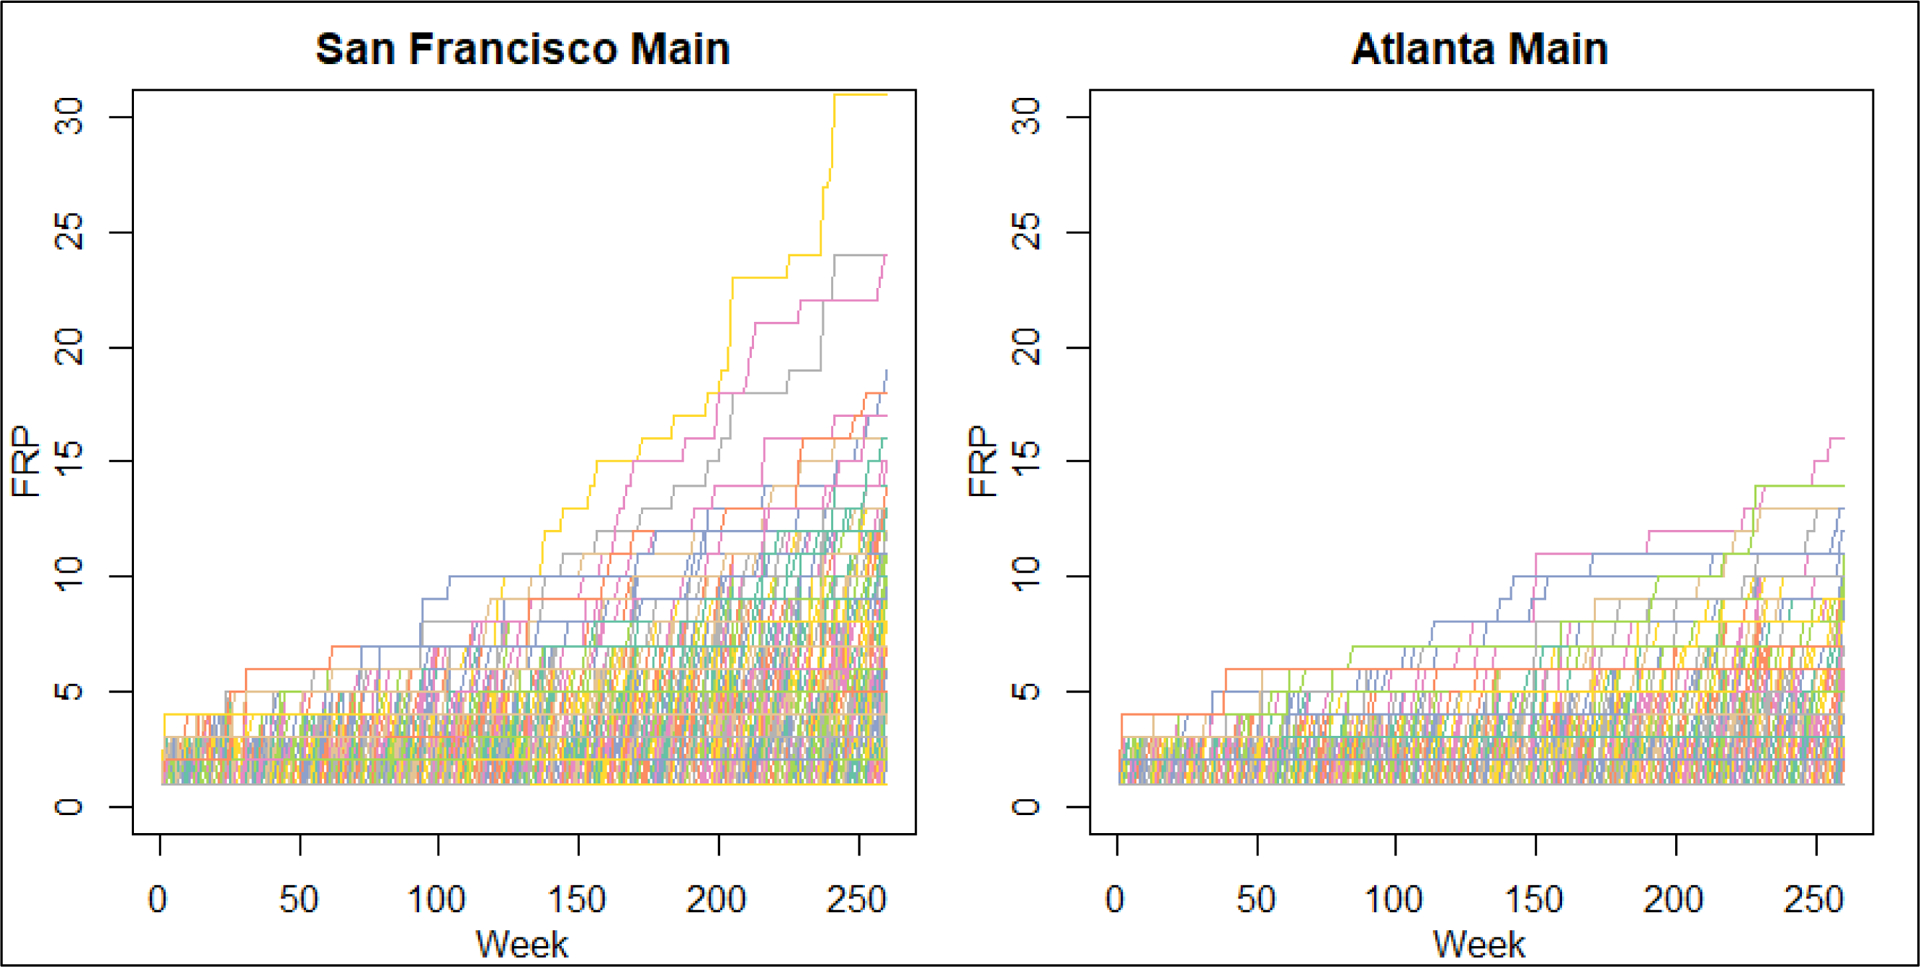
Methods: We used temporal exponential random graph models to estimate the generative parameters for each city's dynamic sexual network from survey data. We then simulated stochastic dynamic networks from the fitted models and calculated the FRP for each realization, overall, and stratified by partnership type and demographics.
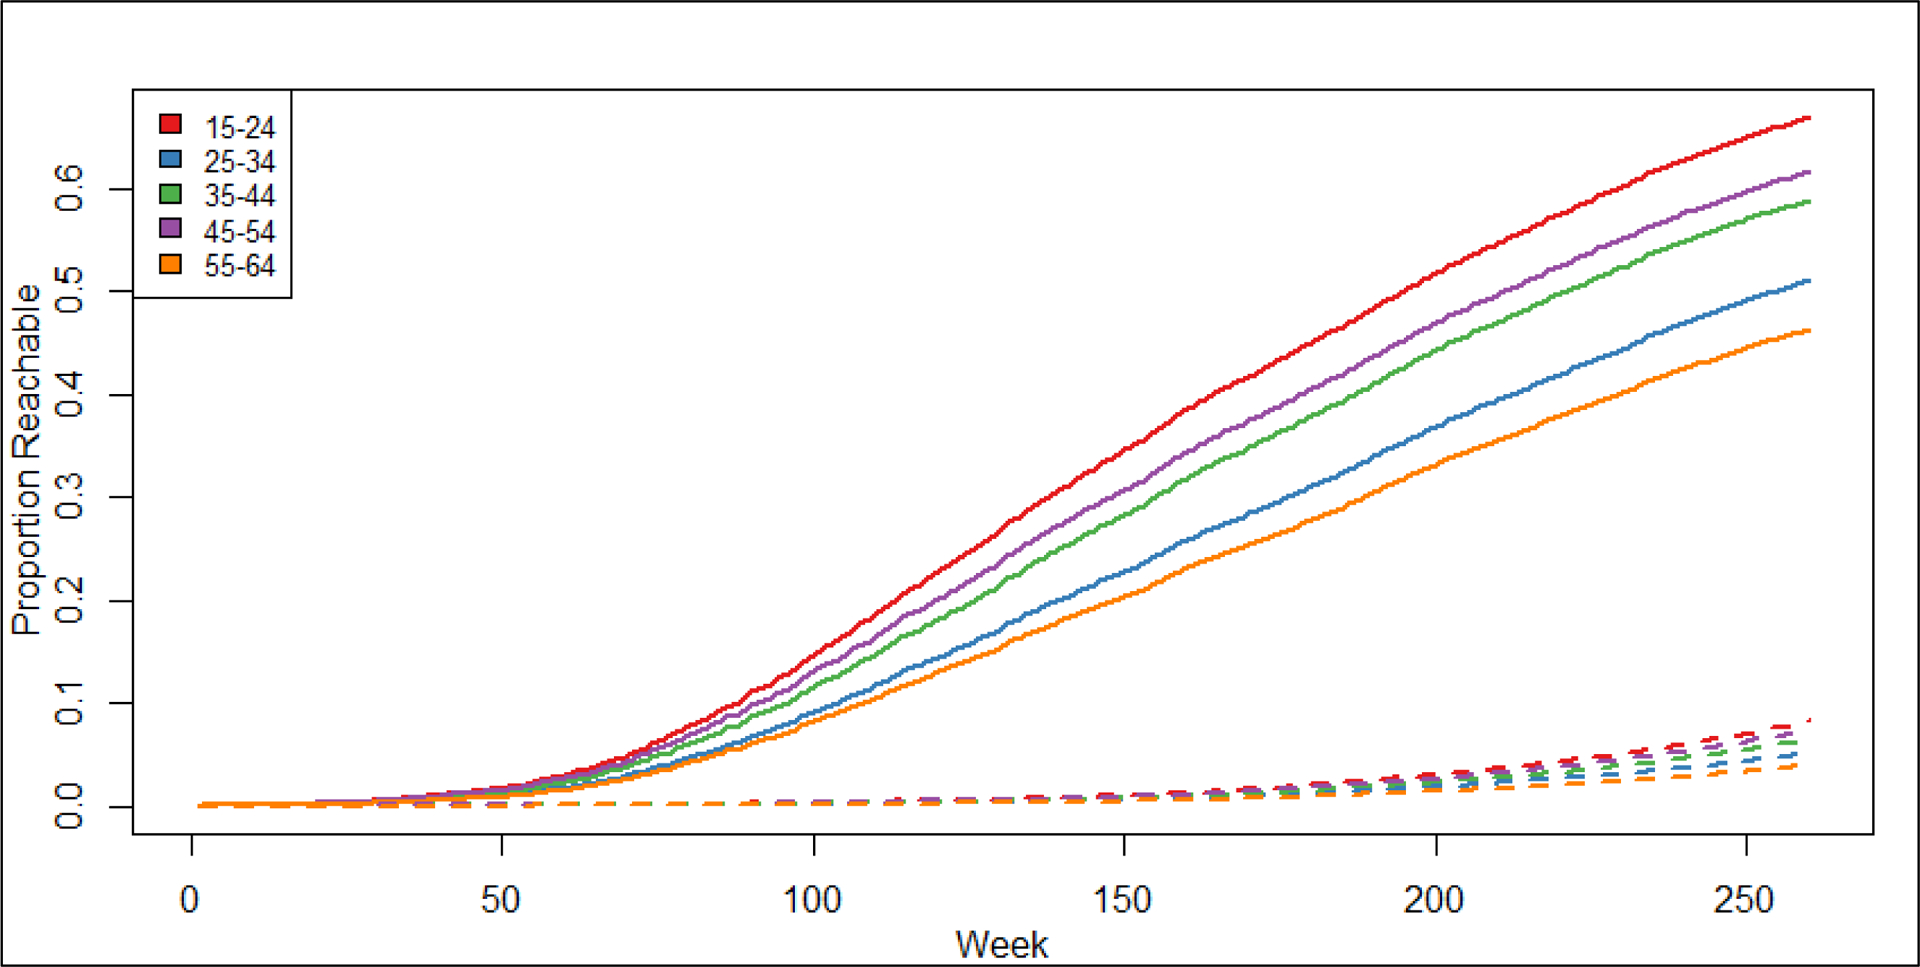
Results: The overall mean and median paths were higher in San Francisco than in Atlanta. The overall paths for each city were greater than the sum of the paths in each individual partnership network. In the casual partnership network, the mean path was highest in the youngest age group and lowest in the oldest age group, despite the fact that the youngest group had the lowest mean momentary degree and past-year partner counts.
Conclusions: The FRP by age group revealed the additional utility of the measure beyond the temporal and cross-sectional network connectivity measures. Other nonnetwork factors are still necessary to infer total epidemic potential for any specific pathogen.
Copyright © 2021 Wolters Kluwer Health, Inc. All rights reserved.
Conflict of interest statement
The authors report no conflicts of interest.
Figures
Similar articles
-
Social and Behavioral Correlates of Sexually Transmitted Infections among Men who Have Sex with Men who Use Alcohol in the San Francisco Bay Area.Am J Mens Health. 2021 May-Jun;15(3):15579883211026830. doi: 10.1177/15579883211026830. Am J Mens Health. 2021. PMID: 34134567 Free PMC article.
-
Comparing Sexual Network Mean Active Degree Measurement Metrics Among Men Who Have Sex With Men.Sex Transm Dis. 2022 Dec 1;49(12):808-814. doi: 10.1097/OLQ.0000000000001708. Epub 2022 Sep 14. Sex Transm Dis. 2022. PMID: 36112005 Free PMC article.
-
Risky sexual networks and concentrated HIV epidemics among men who have sex with men in Wenzhou, China: a respondent-driven sampling study.BMC Public Health. 2015 Dec 16;15:1246. doi: 10.1186/s12889-015-2591-7. BMC Public Health. 2015. PMID: 26673429 Free PMC article.
-
Sexual health norms and communication patterns within the close social networks of men who have sex with men and transgender women in Lima, Peru: a 2017 cross-sectional study.BMC Public Health. 2021 Jun 7;21(1):1090. doi: 10.1186/s12889-021-11091-2. BMC Public Health. 2021. PMID: 34098916 Free PMC article.
-
Online Sex Partner Meeting Venues as a Risk Factor for Testing HIV Positive Among a Community-Based Sample of Black Men Who Have Sex With Men.Sex Transm Dis. 2016 Jun;43(6):360-4. doi: 10.1097/OLQ.0000000000000454. Sex Transm Dis. 2016. PMID: 27200520
Cited by
-
Doxycycline Postexposure Prophylaxis and Sexually Transmitted Infection Trends.JAMA Intern Med. 2025 Mar 1;185(3):266-272. doi: 10.1001/jamainternmed.2024.7178. JAMA Intern Med. 2025. PMID: 39761052
-
Dynamic Contact Networks of Residents of an Urban Jail in the Era of SARS-CoV-2.medRxiv [Preprint]. 2023 Oct 2:2023.09.29.23296359. doi: 10.1101/2023.09.29.23296359. medRxiv. 2023. Update in: Epidemics. 2024 Jun;47:100772. doi: 10.1016/j.epidem.2024.100772. PMID: 37873313 Free PMC article. Updated. Preprint.
-
The global landscape of smallpox vaccination history and implications for current and future orthopoxvirus susceptibility: a modelling study.Lancet Infect Dis. 2023 Apr;23(4):454-462. doi: 10.1016/S1473-3099(22)00664-8. Epub 2022 Nov 28. Lancet Infect Dis. 2023. PMID: 36455590 Free PMC article.
-
Improving and Extending STERGM Approximations Based on Cross-Sectional Data and Tie Durations.J Comput Graph Stat. 2024;33(1):166-180. doi: 10.1080/10618600.2023.2233593. Epub 2023 Aug 29. J Comput Graph Stat. 2024. PMID: 38455738 Free PMC article.
-
Dynamic contact networks of residents of an urban jail in the era of SARS-CoV-2.Epidemics. 2024 Jun;47:100772. doi: 10.1016/j.epidem.2024.100772. Epub 2024 May 15. Epidemics. 2024. PMID: 38776713 Free PMC article.
References
Publication types
MeSH terms
Grants and funding
LinkOut - more resources
Full Text Sources
Medical
Miscellaneous
