. 2021 Jun 25;12(7):649.
doi: 10.1038/s41419-021-03920-4.

TNF-α induces endothelial-mesenchymal transition promoting stromal development of pancreatic adenocarcinoma

Affiliations

TNF-α induces endothelial-mesenchymal transition promoting stromal development of pancreatic adenocarcinoma

Marjorie Adjuto-Saccone et al. Cell Death Dis. .

Abstract

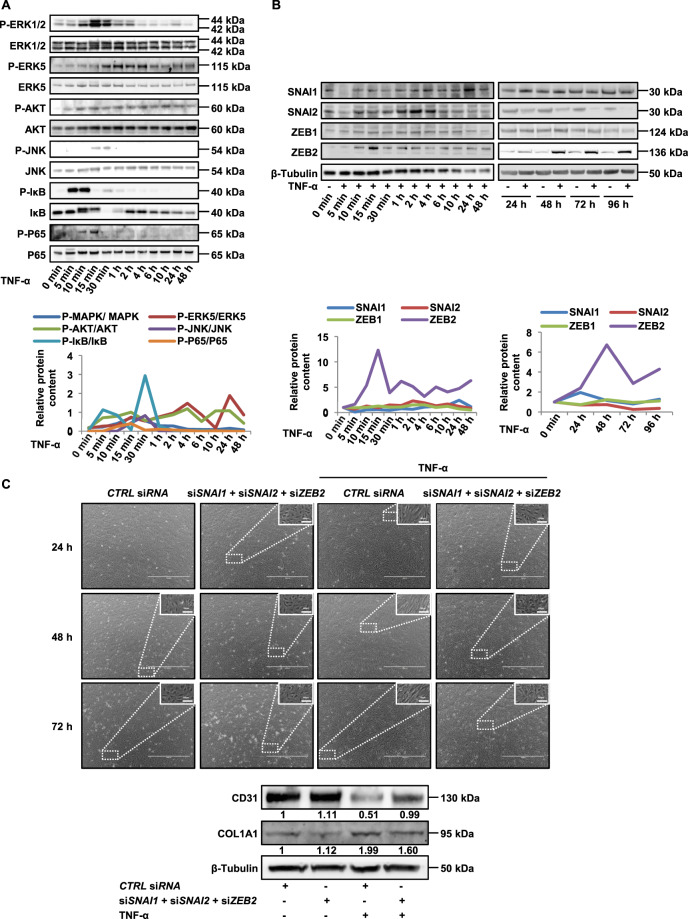
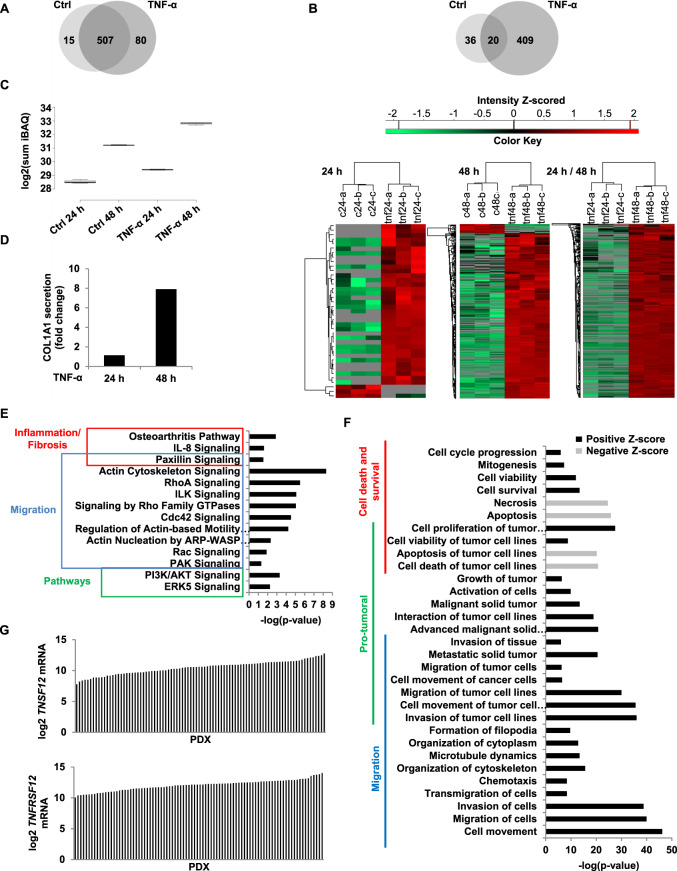
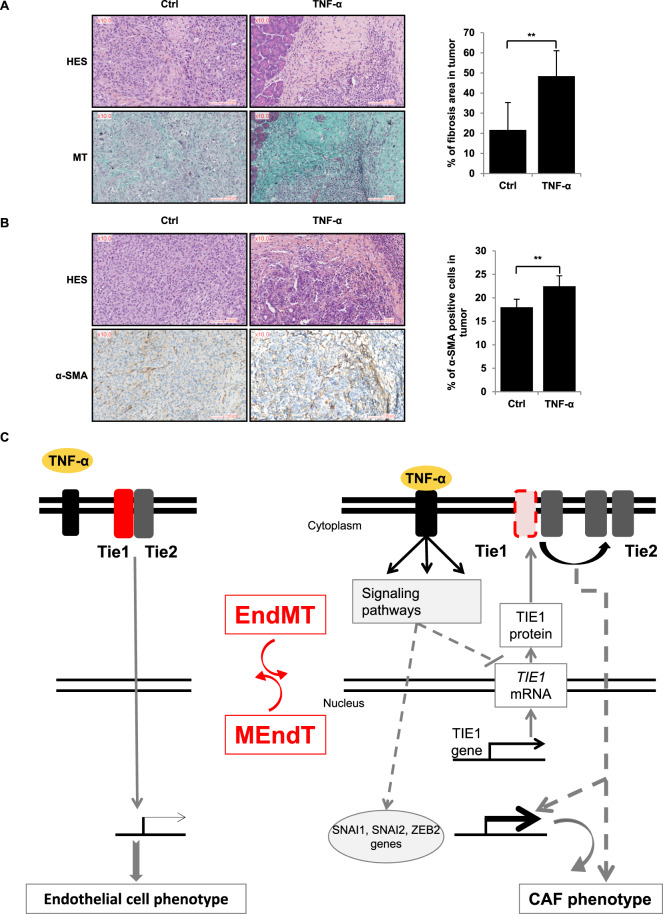
Endothelial-mesenchymal transition (EndMT) is an important source of cancer-associated fibroblasts (CAFs), which facilitates tumour progression. PDAC is characterised by abundant CAFs and tumour necrosis factor-α (TNF-α). Here, we show that TNF-α strongly induces human endothelial cells to undergo EndMT. Interestingly, TNF-α strongly downregulates the expression of the endothelial receptor TIE1, and reciprocally TIE1 overexpression partially prevents TNF-α-induced EndMT, suggesting that TNF-α acts, at least partially, through TIE1 regulation in this process. We also show that TNF-α-induced EndMT is reversible. Furthermore, TNF-α treatment of orthotopic mice resulted in an important increase in the stroma, including CAFs. Finally, secretome analysis identified TNFSF12, as a regulator that is also present in PDAC patients. With the aim of restoring normal angiogenesis and better access to drugs, our results support the development of therapies targeting CAFs or inducing the EndMT reversion process in PDAC.


Conflict of interest statement

The authors declare no competing interests.

Figures

Fig. 1
Fig. 1. TNF-α induces endothelial–mesenchymal transition.
A TNF-α decreases the protein expression of vascular endothelial marker (CD31) and increases the protein expression of mesenchymal markers (S100A4, α-SMA). HMVECs were treated for 96 h with 0, 20, 50 or 100 ng/ml of TNF-α. Protein expressions were analysed by western blot. B Morphological changes induced by a 100 ng/ml TNF-α treatment (photographs). The histogram shows ImageJ software analysis of cell morphology by calculating the elliptical form factor EFF (the major axis divided by minor axis). Results are the average of 100 cells. C TNF-α decreases the mRNA (left panel) and protein (right panel) expression of vascular endothelial markers (CD31, CD34, VE-cadherin) and increases the mRNA (left panel) and protein (right panel) expression of mesenchymal markers (COL1A1, N-cadherin, S100A4, α-SMA, SM22-α). mRNA levels were quantified by RT-qPCR. TBP for RT-qPCR and β-tubulin for western blot analysis were used as controls. RT-qPCR histograms show the mean of three independent biological experiments and western blots are representative of three independent biological experiments. Significant differences are indicated by solid lines (*P < 0.1, **P < 0.05, ***P < 0.005 by t test). Scale bars, 100 µm (inset) or 2000 µm. HMVEC human microvascular endothelial cell, TNF-α tumour necrosis factor-α, α-SMA α-smooth muscle actin, VE-cad VE-cadherin, COL1A1 collagen type I α1, N-Cad N-cadherin, Ctrl control, mRNA messenger RNA, TBP TATA-box binding protein.
Fig. 2
Fig. 2. Effects of TNF-α on cellular migration and angiogenesis.
A TNF-α increases HMVECs migration. HMVECs were treated or not for 96 h with 100 ng/ml of TNF-α and were allowed to migrate in a modified Boyden chamber assay for an additional 3 h30. B TNF-α decreases the number of Ac-LDL-labelled endothelial cells. C TNF-α induces a reduction in tubules formation in a matrigel-based tube-formation assay. Tube formation and Ac-LDL scores were measured for three fields. Scale bars, 1000 µm. Migration was measured for six fields. Similar results were obtained in three different experiments. Significant differences are indicated by solid lines (**P < 0.05, ***P < 0.005 by t test). HMVEC human microvascular endothelial cell, Ctrl control, TNF-α tumour necrosis factor-α.
Fig. 3
Fig. 3. Effects of TNF-α on signal transduction.
A, B TNF-α increases Erk1/2, Erk5, Akt, JNK, IkB and P65 phosphorylations (A) and protein expression of SNAI1, SNAI2 and ZEB2 (B) analysed by western blot. HMVECs were treated for various times with 100 ng/ml of TNF-α. Western blot quantifications are plotted on the graphs below. C SNAI1, SNAI2 and ZEB2 deficiencies partially prevented the morphological changes induced by TNF-α (upper panel) and abrogated or partially reverted the modifications induced by TNF-α on the expression of vascular endothelial marker (CD31) and mesenchymal markers (COL1A1) (lower panel). HMVECs were transfected with SNAI1, SNAI2 and ZEB2 or CTRL siRNA and treated for various times with 100 ng/ml of TNF-α. Total ERK1/2, ERK5, Akt, JNK, IkB, P65 and β-tubulin were used as controls for western blots. Data are representative of three independent experiments. Scale bars, 100 µm (inset) or 1000 µm. HMVEC human microvascular endothelial cell, TNF-α tumour necrosis factor-α, Erk1/2, 5 extracellular signal-regulated kinase 1/2, 5, COL1A1 collagen type I α1, Ctrl control, siRNA short-interfering RNA.
Fig. 4
Fig. 4. Effects of TNF-α on TIE1 and TIE2 receptors.
A TNF-α decreases the mRNA and protein expression of TIE1 and had no effect on TIE2 expression. HMVECs were treated various times with 100 ng/ml of TNF-α. mRNA and protein levels were quantified by RT-qPCR and western blot, respectively; graphs represent protein quantifications. RT-qPCR histograms show the mean of three independent biological experiments, and western blots are representative of three independent biological experiments. B, C The overexpression of TIE1 induces a delay of TNF-α-induced EndMT (B) and increases TIE1/TIE2 interactions (C). Control HMVECs and TIE1-encoding lentivirus infected clone (ST1) were treated various times with 100 ng/ml of TNF-α. Scale bars, 100 µm (inset) or 2000 µm. The graph represents the variation rate of proteins in presence of TNF-α. Lysates from control HMVECs and overexpressing TIE1 ST1 cells were subjected to immunoprecipitation with an anti-TIE2 or anti-MYC antibody, and TIE1 was detected by western blot. The arrow shows an aspecific band. TBP for RT-qPCR and β-tubulin for western blot analysis were used as controls. Data are representative of three independent experiments. Significant differences are indicated by solid lines (***P < 0.005 by t test). HMVEC human microvascular endothelial cell, EndMT endothelial–mesenchymal transition, TNF-α tumour necrosis factor-α, ST1 cells overexpressing TIE1, N-Cad N-cadherin, Ctrl control, mRNA messenger RNA, TBP TATA-box binding protein.
Fig. 5
Fig. 5. TNF-α-induced EndMT is reversible.
A, B TNF-α removal reverses the spindle-shaped phenotype induces by TNF-α (A) and TNF-α removal reverses the CD31 marker downregulation induced by TNF-α, restoring CD31 levels present in untreated controls (B). Reciprocal reversion is observed for the expression of the mesenchymal marker α-SMA. HMVECs were treated or not (−) for 72 h with 100 ng/ml of TNF-α then, cells were washed (+/−TNF-α) or not (+TNF-α) and cultured for various times. Scale bars, 50 µm (inset) or 400 µm. Protein expressions were analysed by western blot. C TNF-α induces a reduction in the formation of tubules in a matrigel-based tube-formation assay (+TNF-α), and a tubule restoration is observed from 168 h after removal of TNF-α (+/−TNF-α). Scale bars, 1000 µm. β-tubulin was used as loading Ctrl for western blot analysis. Tube-formation scores were measured for three fields. Similar results were obtained in three different experiments. Significant differences are indicated by solid lines (**P < 0.05, ***P < 0.005 by t test). HMVEC human microvascular endothelial cell, TNF-α tumour necrosis factor-α, α-SMA α-smooth muscle actin, Ctrl control.
Fig. 6
Fig. 6. Analysis of HMVECs secretome induced by TNF-α.
HMVECs were treated for 24 h and 48 h with 100 ng/ml of TNF-α and supernatants were analysed by mass spectrometry. A The Venn diagram presents proteins detected in HMVECs secretome treated or not with TNF-α. In total, 602 proteins were detected whose 15 only in HMVECs secretome, 80 only in HMVEC’s secretome treated with TNF-α and 507 were common to both. B The Venn diagram depicting total protein distribution, 20 proteins were not significantly different between subpopulations, 36 and 409 were significantly elevated in the endothelial and mesenchymal subpopulations, respectively, using a 1.5 cut-off for significant differences. Heatmap of proteins differentially expressed between Ctrl and TNF-α at 24 h and 48 h and between TNF-α 24 h and TNF-α 48 h. Results were obtained with three technical replicates. C, D TNF-α induces an increase of secretory capacity of HMVECs as revealed by the sum of abundance intensity (iBAQ) for all identified proteins (C) and an increase of COL1A1 secretion (D). E, F All proteins detected at 48 h of TNF-α treatment were analysed with IPA. Pathways (E) and functions (F) significantly affected are represented by the graphs. G mRNA expression levels of TNSF12 and TNFRSF12 in PDXs. HMVECs human microvascular endothelial cells, TNF-α tumour necrosis factor-α, Ctrl control, COL1A1 collagen type I α1, TNFSF12 tumour necrosis factor ligand superfamily member 12, TNFRSF12 tumour necrosis factor receptor superfamily member 12, PDXs patient-derived xenografts.
Fig. 7
Fig. 7. In vivo effect of TNF-α and schematic model of its action.
TNF-α increases CAFs in pancreatic tumour in vivo (A, B) and schematic model of the reversible TNF-α-induced EndMT involving Tie1 downregulation (C). A, B. TNF-α induces an increase of fibrosis (A) and an increase of CAFs α-SMA positives (B). PK4A tumoral cells were orthotopically injected in mice which were treated daily for 27 days with injections of NaCl (Ctrl) or TNF-α (n = 6 for each condition). Then, pancreases were collected and sections of tissue were subjected to HES staining, Masson’s trichrome (MT) staining and α-SMA staining. Fibrosis and α-SMA staining were analysed and quantified by calopix. Significant differences are indicated by solid lines (**P < 0.05, by t test). Scale bars, 100 µm. CAF cancer-associated fibroblast, TNF-α tumour necrosis factor-α, Ctrl control, HES haematoxylin eosin saffron, MT Masson’s trichrome MT, α-SMA α-smooth muscle actin.

References

    1. Siegel RL, Miller KD, Jemal A. Cancer statistics, 2018. CA Cancer J Clin. 2018;68:7–30. doi: 10.3322/caac.21442. - DOI - PubMed
    1. Kleeff J, Korc M, Apte M, La Vecchia C, Johnson CD, Biankin AV, et al. Pancreatic cancer. Nat Rev Dis Prim. 2016;2:16022. doi: 10.1038/nrdp.2016.22. - DOI - PubMed
    1. Bray F, Ferlay J, Soerjomataram I, Siegel RL, Torre LA, Jemal A. Global cancer statistics 2018: GLOBOCAN estimates of incidence and mortality worldwide for 36 cancers in 185 countries. CA Cancer J Clin. 2018;68:394–424. doi: 10.3322/caac.21492. - DOI - PubMed
    1. Erkan M, Hausmann S, Michalski CW, Fingerle AA, Dobritz M, Kleeff J, et al. The role of stroma in pancreatic cancer: diagnostic and therapeutic implications. Nat Rev Gastroenterol Hepatol. 2012;9:454–67. doi: 10.1038/nrgastro.2012.115. - DOI - PubMed
    1. Ducreux M, Seufferlein T, Van Laethem JL, Laurent-Puig P, Smolenschi C, Malka D, et al. Systemic treatment of pancreatic cancer revisited. Semin Oncol. 2019;46:28–38. doi: 10.1053/j.seminoncol.2018.12.003. - DOI - PubMed

Publication types

MeSH terms