. 2021 Jun 25;12(1):3962.
doi: 10.1038/s41467-021-23985-1.

Protein mimetic amyloid inhibitor potently abrogates cancer-associated mutant p53 aggregation and restores tumor suppressor function

Affiliations

Protein mimetic amyloid inhibitor potently abrogates cancer-associated mutant p53 aggregation and restores tumor suppressor function

L Palanikumar et al. Nat Commun. .

Abstract

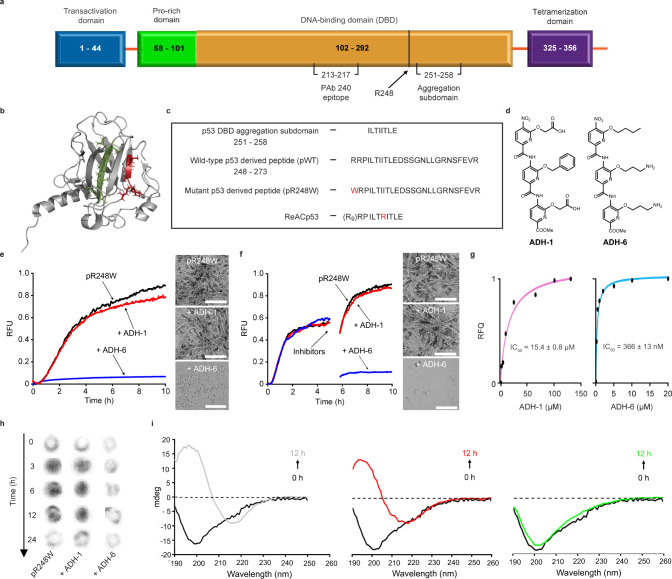
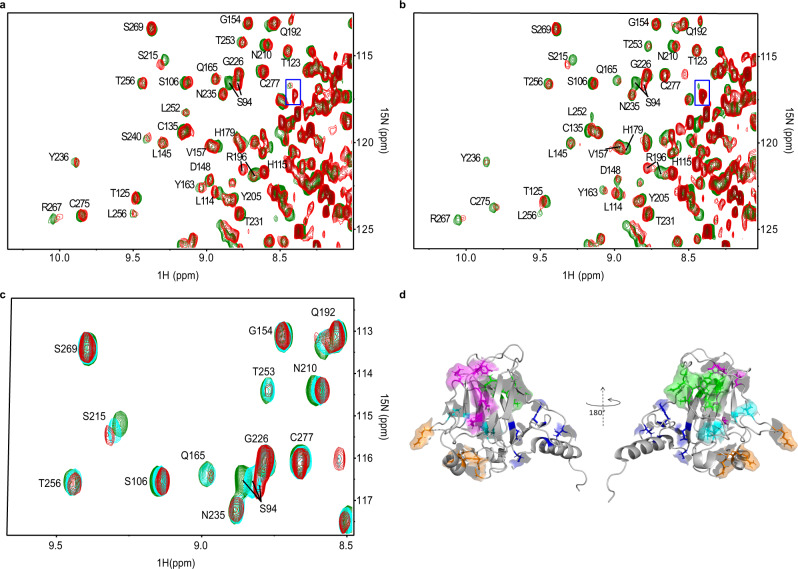
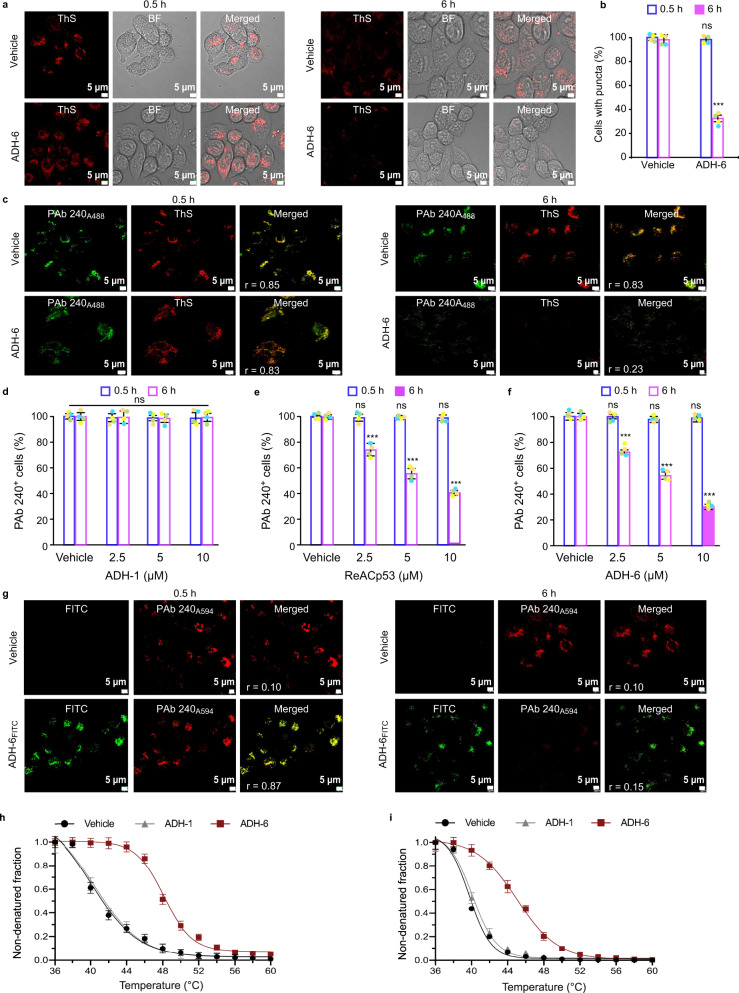
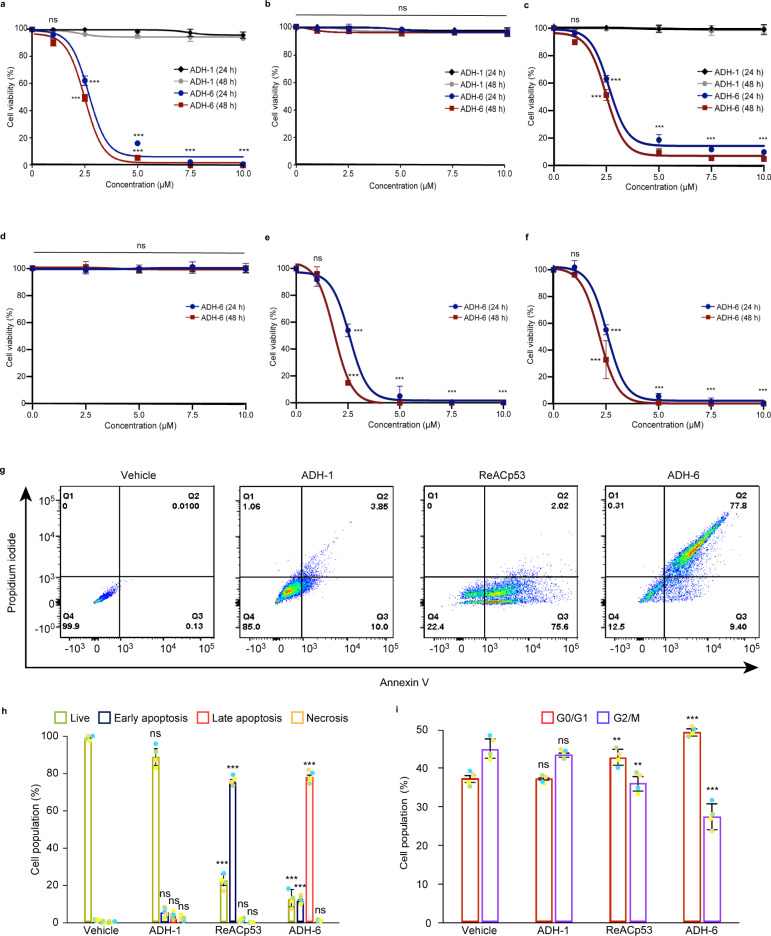
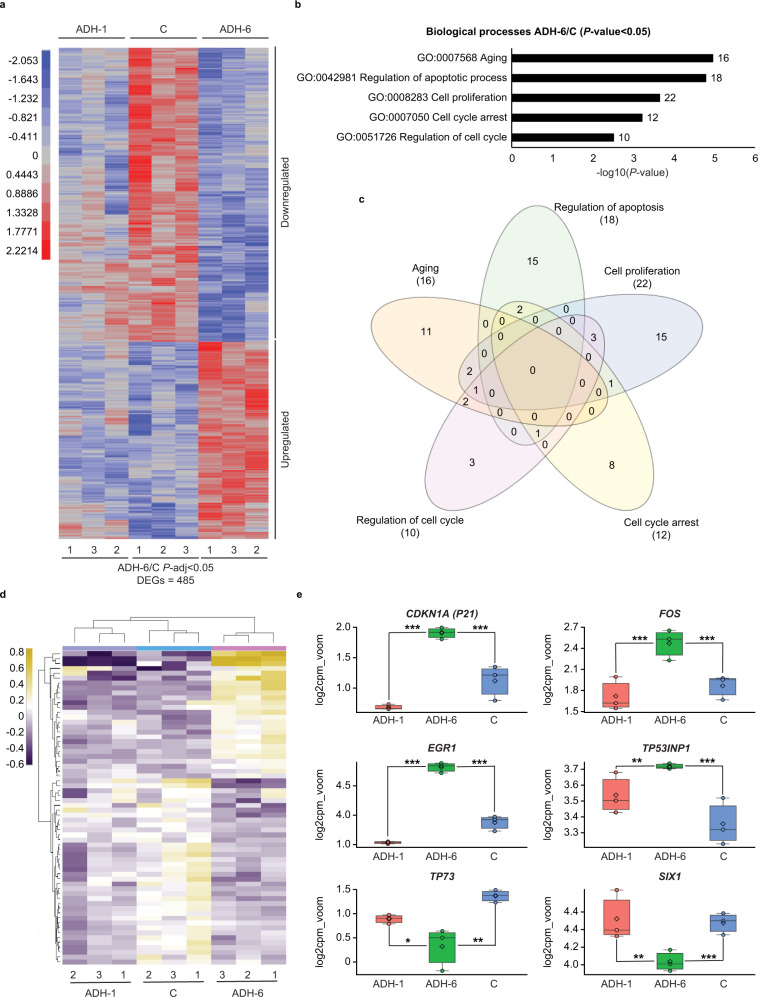
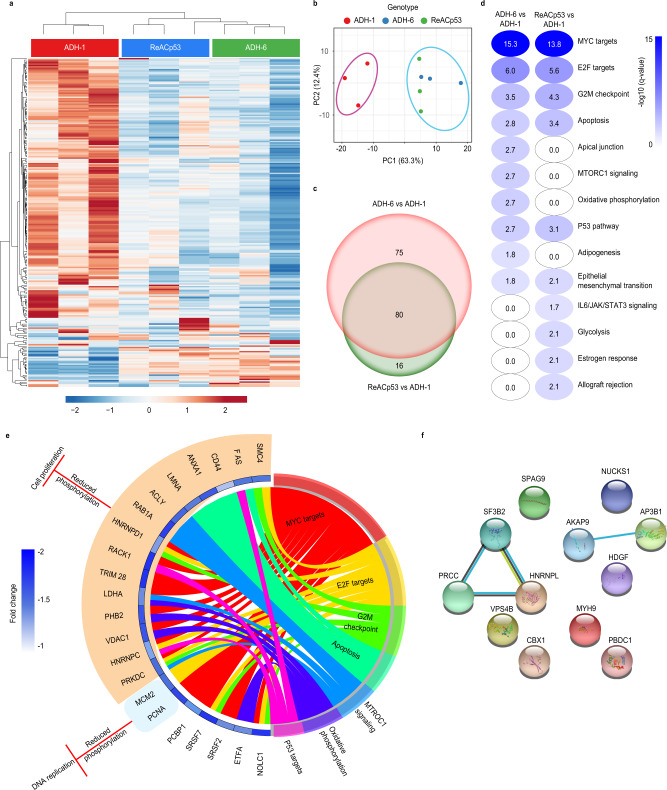
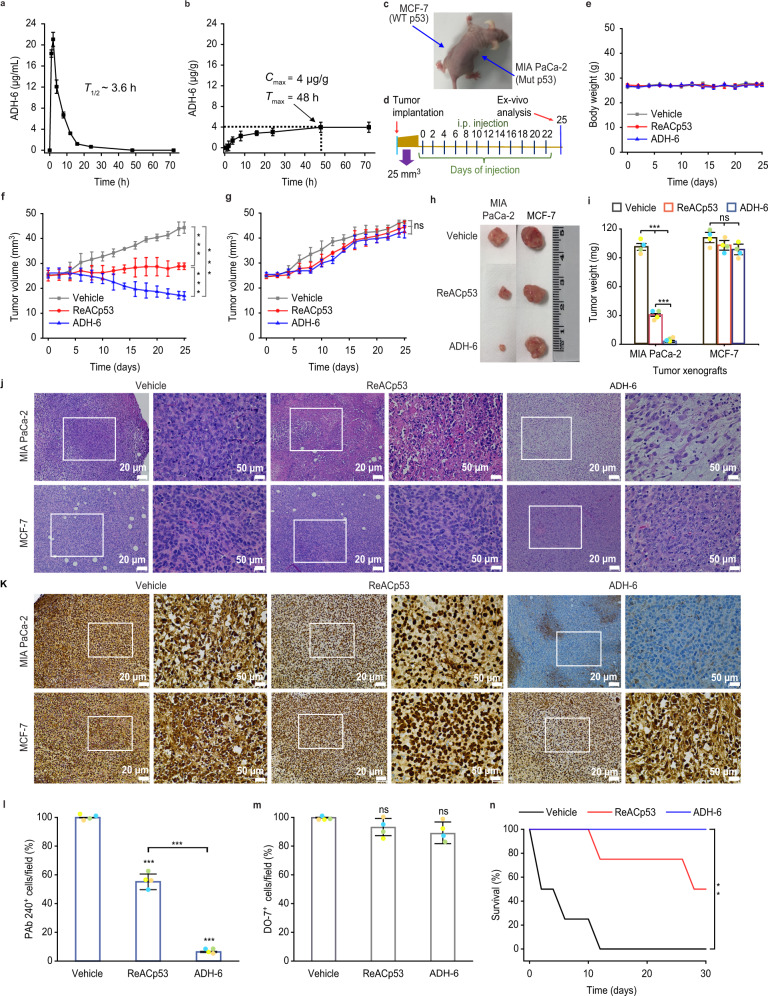
Missense mutations in p53 are severely deleterious and occur in over 50% of all human cancers. The majority of these mutations are located in the inherently unstable DNA-binding domain (DBD), many of which destabilize the domain further and expose its aggregation-prone hydrophobic core, prompting self-assembly of mutant p53 into inactive cytosolic amyloid-like aggregates. Screening an oligopyridylamide library, previously shown to inhibit amyloid formation associated with Alzheimer's disease and type II diabetes, identified a tripyridylamide, ADH-6, that abrogates self-assembly of the aggregation-nucleating subdomain of mutant p53 DBD. Moreover, ADH-6 targets and dissociates mutant p53 aggregates in human cancer cells, which restores p53's transcriptional activity, leading to cell cycle arrest and apoptosis. Notably, ADH-6 treatment effectively shrinks xenografts harboring mutant p53, while exhibiting no toxicity to healthy tissue, thereby substantially prolonging survival. This study demonstrates the successful application of a bona fide small-molecule amyloid inhibitor as a potent anticancer agent.


Conflict of interest statement

New York University and New York University Abu Dhabi hold a patent for the use of oligopyridylamides to inhibit mutant p53 amyloid formation, with S. Kumar, A.D.H., M.M. and S.H. listed as inventors (US10500197B2).

Figures

Fig. 1
Fig. 1. ADH-6 abrogates amyloid formation of aggregation-prone region of p53 DBD.
a Schematic representation of the different domains of p53. The DBD (residues 102–292) contains an aggregation-nucleating subdomain (residues 251–258) that is necessary and sufficient to drive p53 aggregation,,. Another segment of interest comprises residues 213–217, which is the antigen recognized by the PAb 240 antibody that binds to partially unfolded p53. Also highlighted in the DBD is R248, one of the most common mutation hotspots in p53 (IARC TP53 database; https://p53.iarc.fr). b Structure of p53 DBD. Highlighted are the aggregation-nucleating subdomain (green) and the epitope recognized by PAb 240 (red). Both segments are buried in the fully folded p53 structure. The 3D image was generated using PyMOL 2.3.5 (Schrödinger, New York, NY). c Primary sequences of the studied WT and mutant R248W p53 DBD-derived peptides, denoted pWT and pR248W, respectively, which span residues 248–273. The peptides include the aggregation-prone 252–258 sequence, as well as R248 and another of the most common mutation hotspots in p53 and R273 (IARC TP53 database; https://p53.iarc.fr). d Chemical structures of the oligopyridylamides ADH-1 and ADH-6. e, f Effects of the oligopyridylamides on pR248W amyloid formation. Kinetic profiles (left panel) and representative transmission electron microscopy (TEM) images (right panel) for aggregation of 25 μM pR248W in the absence or presence of an equimolar amount of ADH-1 or ADH-6 co-mixed at the start of the reaction (e) or added during the growth phase (i.e. 5 h after the start of the reaction) (f). Kinetic aggregation profiles were acquired by measuring the fluorescence of the thioflavin T (ThT) reporter (λex/em = 440/480 nm) at 5-min intervals at 37 °C (n = 4). TEM images were acquired at 10 h after the start of the aggregation reaction. Scale bar = 100 nm. g Characterization of the binding interaction of the oligopyridylamides and pR248W measured using steady-state intrinsic tryptophan fluorescence quenching. A 5 µM solution of pR248W was titrated with increasing concentrations of ADH-1 (left panel) or ADH-6 (right panel) and the tryptophan fluorescence after each addition was normalized to account for the dilution (total dilution during the titration was <1%) and plotted against the ligand concentration. The equilibrium dissociation constants (Kd) were then determined using a one-site-specific binding equation (Eq. 1). h Effects of the oligopyridylamides on pR248W oligomerization monitored using the dot blot assay. Samples of 10 μM pR248W were incubated with or without an equimolar amount of ADH-1 or ADH-6 for 0–24 h, and the presence of oligomers was detected using an amyloid oligomer-specific polyclonal antibody (A11). i Effects of the oligopyridylamides on the self-assembly driven structural transition of pR248W. Time-dependent circular dichroism (CD) spectra of 10 µM pR248W alone (left panel) or in the presence of an equimolar amount of ADH-1 (middle panel) or ADH-6 (right panel).
Fig. 2
Fig. 2. NMR-based determination of p53 DBD–ADH-6 interaction interface.
a, b Overlay of 15N-1H HSQC maps of 19 μM WT (a) and 24 μM R248W (b) p53 DBD in H2O/D2O (96/4) with 16.7 mM DTT, without (green contours) or with (red contours) ADH-6 addition (protein:ligand 1:11 in a and 1:15 in b). The assignments are reported only outside the rightmost regions. These regions are crowded because of the presence of partially unfolded species that also interact with ADH-6 as highlighted by the boxed peak in each panel. c HSQC contour maps overlay of mutant R248W p53 DBD at different protein:ADH-6 ratios (1:0 green, 1:8 cyan, and 1:15 red) showing the increment of cumulated chemical shift perturbation (CSP) with ligand concentration (Eq. 2). d The five clusters of the two p53 DBD variants (WT and mutant R248W) that show high (>0.025) or medium (>0.015) CSP values. Cluster 1 (highlighted in blue) includes residues T118, Y126, E271, C275, and G279; cluster 2 (highlighted in magenta) includes residues R196, E198, G199, L201, Y220, and E221; cluster 3 (green) includes T102, Y103, Q104, G105, L257, L264, and R267; cluster 4 (orange) includes E171, R174, H179, R209, and G244; and cluster 5 (cyan) includes S94, A161, I162, L206, and S215. Clusters 1 and 2 are at the front in the cartoon on the left; clusters 3–5 are at the front in the cartoon on the right. The 3D image was generated using PyMOL 2.3.5 (Schrödinger, New York, NY).
Fig. 3
Fig. 3. ADH-6 dissociates mutant p53 aggregates in cancer cells.
a Confocal fluorescence microscopy images showing thioflavin S (ThS) staining of mutant p53 (R248W) aggregates in MIA PaCa-2 cells treated with vehicle (0.02% DMSO) or ADH-6 (5 µM) for 0.5 or 6 h. Imaging experiments were performed in quadruplicate and representative images are shown. b Quantification of ThS-positive MIA PaCa-2 cells after treatment with vehicle or ADH-6. The number of positively stained cells in 3–5 different fields of view are expressed as % of the total number of cells (n = 4 biologically independent samples). Data presented are mean ± SD. Statistical analysis was performed using two-tailed unpaired t-test. P < 0.0001 for ADH-6 vs vehicle at 6 h. c Confocal fluorescence microscopy images of ThS and PAb 240 antibody staining of R248W aggregates in MIA PaCa-2 cells treated with vehicle or 5 µM ADH-6 for 0.5 or 6 h. Images shown are representative of four independent experiments. df Quantification of PAb 240-positive MIA PaCa-2 cells after treatment with the indicated concentrations of ADH-1, ReACp53, or ADH-6 for 0.5 or 6 h relative to controls (vehicle-treated cells). The number of positively stained cells in 3–5 different fields of view are expressed as % of the total number of cells (mean ± SD; n = 4). Statistical analysis was performed using repeated measures two-way ANOVA followed by Holm-Sidak’s post hoc test. P < 0.0001 for ReACp53 (2.5–10 µM) vs vehicle at 6 h (e); P < 0.0001 for ADH-6 (2.5–10 µM) vs vehicle at 6 h (f). g Colocalization of FITC-labeled ADH-6 (ADH-6FITC) with PAb 240-stained R248W aggregates following incubation with the oligopyridylamide (5 µM) for 0.5 or 6 h. Colocalization was quantified using directional Pearson correlation coefficient, r, which measures pixel-by-pixel covariance in the signal level of two images. Scale bar = 5 µm. h, i Cellular thermal shift assay (CETSA) analysis of intracellular target engagement. Melting curves for p53 mutants R248W (h) and R175H (i) in MIA PaCa-2 and SK-BR-3 cells, respectively, in the absence or presence of the oligopyridylamides (mean ± SD; n = 3). ***P < 0.001 or non-significant (n.s., P > 0.05) for comparisons with vehicle-treated controls.
Fig. 4
Fig. 4. ADH-6 causes death of cancer cells bearing mutant, but not WT, p53.
ac Effects of ADH-6 on viability of cancer cells bearing WT or mutant p53. MIA PaCa-2 (mutant R248W p53) (a), MCF-7 (WT p53) (b), and SK-BR-3 (mutant R175H p53) (c), cells treated with increasing oligopyridylamide concentrations for 24 or 48 h. (df) p53 null Saos-2 cells before (d) and after transfection with p53 mutants, R248W (e) or R175H (f), treated with increasing concentrations of ADH-6 for 24 or 48 h. Cell viability in af was assessed using the MTS assay, with the % viability determined form the ratio of the absorbance of the treated cells to the control cells (n = 3 biologically independent samples). Data presented are mean ± SD. Statistical analysis in af was performed using two-tailed unpaired t-test. P < 0.0001 for ADH-6 vs ADH-1 at the same compound concentration (2.5–10 µM) and incubation time (24 or 48 h) (a, c); P < 0.0001 for ADH-6 treatment of Saos-2/R248W compared with untransfected cells (data shown in d) at the same compound concentration (2.5–10 µM) and incubation time (24 or 48 h) (e); P < 0.0001 for ADH-6 treatment of Saos-2/R175H compared with untransfected cells (data shown in d) at the same compound concentration (2.5–10 µM) and incubation time (24 or 48 h) (f). g, h Flow cytometry analysis of annexin V/propidium iodide (PI) staining of MIA PaCa-2 cells that were treated with vehicle (control), or 5 µM ADH-1, ReACp53, or ADH-6, for 24 h. The bottom left quadrant (annexin V−/PI−) represents live cells; bottom right (annexin V+/PI−), early apoptotic cells; top right (annexin V+/PI+), late apoptotic cells; and top left (annexin V−/PI+), necrotic cells (g). A summary of the incidence of early/late apoptosis and necrosis in the different treatment groups determined from the flow cytometry analysis of annexin V/PI staining (mean ± SD; n = 4) (h). Statistical analysis in h was performed using one-way ANOVA followed by Dunnett’s post hoc test. P < 0.0001 for ReACp53 vs vehicle (live and early apoptosis); P < 0.0001 for ADH-6 vs vehicle (live, early apoptosis, and late apoptosis). i Cell cycle distribution of MIA PaCa-2 cells treated with vehicle (control), or 5 µM ADH-1, ReACp53 or ADH-6, for 6 h as determined by measurement of DNA content using flow cytometry (mean ± SD; n = 4). Two-tailed unpaired t-test: P = 0.0071 and 0.0037 for ReACp53 vs vehicle (G0/G1 and G2/M, respectively); P < 0.0001 and P = 0.0004 for ADH-6 vs vehicle (G0/G1 and G2/M, respectively). **P < 0.01, ***P < 0.001 or non-significant (n.s., P > 0.05) for comparisons with vehicle-treated controls.
Fig. 5
Fig. 5. Transcriptome analysis of oligopyridylamide-treated MIA PaCa-2 cells.
a Variance-stabilized count data heatmap showing clustering patterns of differentially expressed genes (DEGs) identified based on statistical significance of P-adj < 0.05 from the ADH-6 treatment group relative to vehicle-treated controls (C) (denoted ADH-6/C). Significance was assessed by false discovery rate (FDR) adjusted P-value (P-adj or q-value), which was obtained from the hypergeometric P-value that was corrected for multiple hypothesis testing using the Benjamin and Hochberg procedure. The ADH-1 treatment group is included for comparison. The adjacent legend indicates the scale of expression, with red signifying upregulation, and blue downregulation, in ADH-6/C. b Gene ontology (GO) analysis of ADH-6/C showing the top five “biological process” term enrichments based on a cut-off of P-value <0.05 (normalized to −log10). Statistical analysis was performed using two-tailed unpaired t-test. c Venn diagram delineating overlap of DEGs between the processes in b. d Heatmap (scaled to log2 counts per million reads (log2cpm_voom)) displaying a finalized list of DEGs based on the Venn diagram. e Gene expression boxplots of DEGs selected from the heatmap in d (n = 3 biologically independent samples). The boxplots display the five-number summary of median (center line), lower and upper quartiles (box limits), and minimum and maximum values (whiskers). Statistical analysis was performed using two-tailed unpaired t-test. P < 0.0001 for Cdkn1a, FOS, EGR1, and SIX1, P = 0.0002 for Tp53inp1, and P = 0.0026 for TP73 (ADH-6/C); P < 0.0001 for Cdkn1a, FOS, and EGR1, P = 0.0072 for Tp53inp1, P = 0.0471 for TP73, and P = 0.0019 for SIX1 (ADH-6/ADH-1). *P < 0.05, **P < 0.01, ***P < 0.001 or non-significant (n.s., P > 0.05) for comparisons with vehicle-treated controls and between the different treatment groups.
Fig. 6
Fig. 6. Quantitative proteomic analysis of phosphoprotein expression in oligopyridylamide-treated MIA PaCa-2 cells.
a Heatmap showing differentially expressed phosphoproteins in ADH-1, ReACp53, and ADH-6 treated samples. Unsupervised hierarchical clustering reveals distinct segregation of ADH-1 vs ReACp53 and ADH-6. b Results from principal component analysis (PCA) showing that the main source of variation in the indicated groups was the compound/peptide treatment. c Venn diagram showing phosphoproteins that were differentially expressed in the ADH-6 vs ADH-1 and ReACp53 vs ADH-1 comparisons. The number of phosphoproteins that were unique or common in both comparisons are highlighted. d Gene set enrichment overlap analysis (GSEA) of hallmark signatures for the differentially expressed and downregulated phosphoproteins. Significance was assessed by q-value, or false discovery rate (FDR)-adjusted P-value, which was obtained from the hypergeometric P-value that was corrected for multiple hypothesis testing using the Benjamin and Hochberg procedure. The hallmark signatures were ranked based on the −log10(q-value) of overlap. Only gene signatures that were significantly different (q-value <0.05 or −log10(q-value) >1.3) were further analyzed. e GOChord plot of phosphoproteins that belong to top dysregulated hallmark signatures (shown in d). The plot also depicts overlap of phosphoproteins between indicated gene signatures. Fold change of phosphoproteins (ADH-6 vs ADH-1) is represented by the blue track with the color spectrum depicting the level of reduction in phosphoprotein expression in the ADH-6 group. The biological roles of the downregulated phosphoproteins in ADH-6 were inferred from published data. The outer layer of the GOChord plot links the downregulation of phosphoproteins with the inhibition of DNA repair/replication and cell proliferation on the basis of previous reports (Supplementary Table 2a). f Protein–protein interaction (PPI) network map of upregulated phosphoproteins in ADH-6 vs ADH-1 treatments (biological roles of upregulated phosphoproteins are summarized in Supplementary Table 2b).
Fig. 7
Fig. 7. ADH-6 causes regression of tumors bearing mutant, but not WT, p53.
a, b In vivo pharmacokinetics of ADH-6. Concentration of ADH-6 in plasma (a) and in MIA PaCa-2 xenografts (b) of mice (n = 5–6 per group), after an intraperitoneal injection of the oligopyridylamide (15 mg kg-1), was quantified using LC-MS/MS. Shown are the circulation half-life (T1/2) (a) as well as the maximum (or peak) concentration (Cmax) in tumors and the time to achieve Cmax (Tmax) (b). Data presented are mean ± SD. c, d Design of the tumor reduction studies. A representative mouse bearing both MIA PaCa-2 (mutant R248W p53) and MCF-7 (WT p53) xenografts (c) and treatment schedule for the dual xenograft model (d). Once the tumor volume reached ~25 mm3, the mice were randomized into the different treatment groups (n = 8 per group), which were injected intraperitoneally with vehicle (0.02% DMSO), ReACp53 (716.4 µM), or ADH-6 (716.4 µM). Injections were done every 2 days for a total of 12 doses, with the first day of treatment defined as day 0. e Body weight changes of the tumor-bearing mice in the different treatment groups monitored for the duration of the experiment (mean ± SD; n = 8). f, g Tumor volume growth curves for the MIA PaCa-2 (f) and MCF-7 (g) xenografts in the different treatment groups over the duration of the experiment (mean ± SD; n = 8). Tumor volume was calculated using Eq. (3). Statistical analysis was performed using one-way ANOVA followed by Tukey’s post hoc test. P < 0.0001 for ADH-6 vs vehicle, ReACp53 vs vehicle and ADH-6 vs ReACp53 (f). h, i Tumor mass analysis for the different treatment groups. After 25 days of treatment, four mice per treatment group were sacrificed and the tumor tissues were isolated and imaged (h) and subsequently weighed to determine the tumor mass (i). Data presented are mean ± SD, and statistical analysis was performed using one-way ANOVA followed by Tukey’s post hoc test. P < 0.0001 for ADH-6 vs vehicle, ReACp53 vs vehicle and ADH-6 vs ReACp53 (MIA PaCa-2 xenografts; i). j Hematoxylin and eosin (H&E)-stained xenograft sections from the different treatment groups following 25 days of treatment. Images on the right are magnified views of the boxed regions in the images on the left. Scale bar = 20 μm (50 μm for the magnified views). km Immunohistochemistry (IHC) analysis of the residual xenografts. Images of sections of MIA PaCa-2 and MCF-7 xenografts stained using the anti-p53 PAb 240 and DO-7 antibodies, respectively, from the different treatment groups (k). Images on the right are magnified views of the boxed regions in the images on the left. Scale bar = 20 μm (50 μm for the magnified views). Quantification of PAb 240 (l) and DO-7 (m) positive cells in 3–5 different fields of view expressed as % of the total number of cells (mean ± SD; n = 4). One-way ANOVA followed by Tukey’s post hoc test: P < 0.0001 for ADH-6 vs vehicle, ReACp53 vs vehicle and ADH-6 vs ReACp53 (l). n Survival curves for the vehicle, ReACp53 and ADH-6 treatment groups over 30 days (n = 4 per group). Statistical analysis was performed using log-rank (Mantel-Cox) test. P = 0.0062 for ADH-6 vs vehicle. **P < 0.01, ***P < 0.001 or non-significant (n.s., P > 0.05) for comparisons with vehicle-treated controls and between the different treatment groups.

References

    1. Lane DP. p53, guardian of the genome. Nature. 1992;358:15–16. doi: 10.1038/358015a0. - DOI - PubMed
    1. Hafner A, Bulyk ML, Jambhekar A, Lahav G. The multiple mechanisms that regulate p53 activity and cell fate. Nat. Rev. Mol. Cell Biol. 2019;20:199–210. doi: 10.1038/s41580-019-0110-x. - DOI - PubMed
    1. Bieging KT, Mello SS, Attardi LD. Unravelling mechanisms of p53-mediated tumour suppression. Nat. Rev. Cancer. 2014;14:359–370. doi: 10.1038/nrc3711. - DOI - PMC - PubMed
    1. Bykov VJN, Eriksson SE, Bianchi J, Wiman KG. Targeting mutant p53 for efficient cancer therapy. Nat. Rev. Cancer. 2018;18:89–102. doi: 10.1038/nrc.2017.109. - DOI - PubMed
    1. Zilfou, J.T. & Lowe, S.W. Tumor suppressive functions of p53. Cold Spring Harb. Perspect. Biol. 1, a001883 (2009). - PMC - PubMed

Publication types

MeSH terms