. 2021 Jun 25;12(1):3968.
doi: 10.1038/s41467-021-24243-0.

Neuronal and glial 3D chromatin architecture informs the cellular etiology of brain disorders

Collaborators, Affiliations

Neuronal and glial 3D chromatin architecture informs the cellular etiology of brain disorders

Benxia Hu et al. Nat Commun. .

Abstract

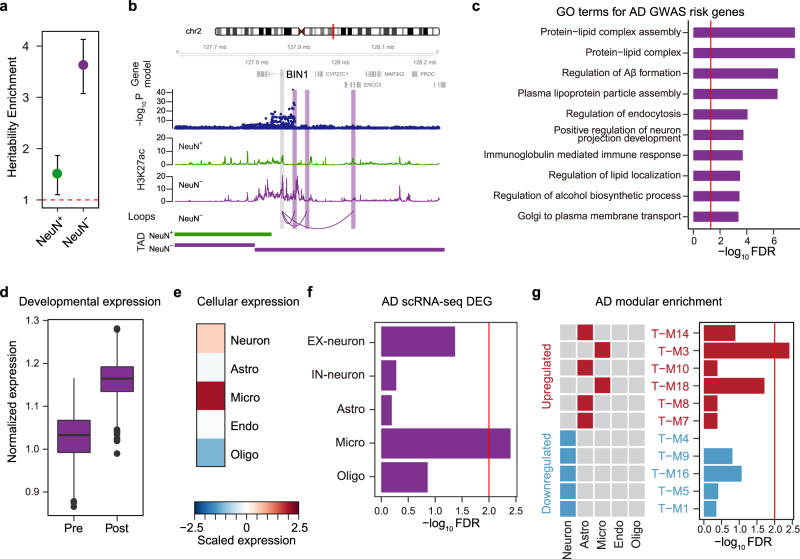
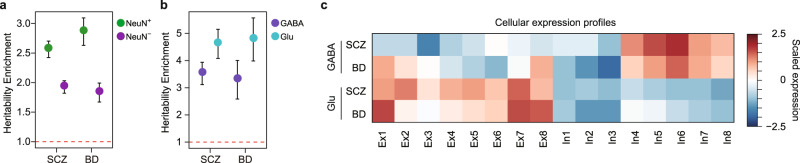
Cellular heterogeneity in the human brain obscures the identification of robust cellular regulatory networks, which is necessary to understand the function of non-coding elements and the impact of non-coding genetic variation. Here we integrate genome-wide chromosome conformation data from purified neurons and glia with transcriptomic and enhancer profiles, to characterize the gene regulatory landscape of two major cell classes in the human brain. We then leverage cell-type-specific regulatory landscapes to gain insight into the cellular etiology of several brain disorders. We find that Alzheimer's disease (AD)-associated epigenetic dysregulation is linked to neurons and oligodendrocytes, whereas genetic risk factors for AD highlighted microglia, suggesting that different cell types may contribute to disease risk, via different mechanisms. Moreover, integration of glutamatergic and GABAergic regulatory maps with genetic risk factors for schizophrenia (SCZ) and bipolar disorder (BD) identifies shared (parvalbumin-expressing interneurons) and distinct cellular etiologies (upper layer neurons for BD, and deeper layer projection neurons for SCZ). Collectively, these findings shed new light on cell-type-specific gene regulatory networks in brain disorders.


Conflict of interest statement

The authors declare no competing interests.

Figures

Fig. 1
Fig. 1. Differential FIREs are associated with cell-type-specific gene regulation.
a The number of FIREs detected in NeuN+ and NeuN− cells. b Differential FIREs were identified in NeuN+ and NeuN− cells. c, d Differential FIREs overlap with differential H3K27ac peaks in the corresponding cell types. A neuronal gene, GRIN2B, is located in NeuN+ specific FIREs (e), while two oligodendrocytic genes, OLIG1 and OLIG2, are located in NeuN− specific FIREs (f). FIREs and significance of FIRE scores in NeuN+ and NeuN− cells are depicted in green and purple, respectively. Boxplots in the right show expression levels of GRIN2B (FDR = 3.71e−12), OLIG1 (FDR = 7.34e−26) and OLIG2 (FDR = 8.06e−23) in NeuN+ (n = 4) and NeuN− (n = 4) cells. FPKM Fragments Per Kilobase of transcript per Million mapped reads. Center, median; box = 1st to 3rd quartiles (Q); minima, Q1 − 1.5 × interquartile range (IQR); maxima, Q3 + 1.5 × IQR. *FDR < 0.05 calculated by DESeq2 (two-sided Wald test). Source data are provided as a Source Data file. Gene ontology (GO) analysis for genes assigned to differential NeuN+ (g) and NeuN− (h) FIREs. The red line denotes FDR = 0.05. i Cellular expression levels of genes assigned to differential NeuN+ and NeuN− FIREs. Center, median; box = Q1−Q3; minima, Q1 − 1.5 × IQR; maxima, Q3 + 1.5 × IQR. Neurons, n = 131; astrocytes (Astro), n = 62; microglia (Micro), n = 16; endothelial (Endo), n = 20; oligodendrocytes (Oligo), n = 38. Source data are provided as a Source Data file. j Genes assigned to differential NeuN+ and NeuN− FIREs are enriched in neurons and glia, respectively. Ex excitatory neurons, In inhibitory neurons.
Fig. 2
Fig. 2. Enhancer–promoter interactions in NeuN+ and NeuN− cells.
a (Left) cell-type-specific regulatory networks were built by linking genes to NeuN+ and NeuN− specific H3K27ac peaks via Hi–C interactions in NeuN+ and NeuN− cells, respectively. (Right) The number of cell-type-specific peaks and their assigned genes in NeuN+ and NeuN− cells is described. A neuronal gene, HOMER1, is engaged with NeuN+ specific H3K27ac peaks via loops in NeuN+ cells (b), while an oligodendrocyte gene, SOX10, is engaged with NeuN− specific H3K27ac peaks via loops in NeuN− cells (c). The regions that interact with the gene promoter (gray) are highlighted in green (NeuN+) and purple (NeuN−), respectively. Boxplots in the right show expression levels of HOMER1 (FDR = 7.26e−32) and SOX10 (FDR = 1.88e−49) in NeuN+ (n = 4) and NeuN− (n = 4) cells, respectively. FPKM Fragments Per Kilobase of transcript per Million mapped reads. Center, median; box = Q1–Q3; minima, Q1 − 1.5 × IQR; maxima, Q3 + 1.5 × IQR. *FDR < 0.05 calculated by DESeq2 (two-sided Wald test). Source data are provided as a Source Data file. d Genes assigned to NeuN+ specific peaks are enriched for synaptic co-expression modules, while genes assigned to NeuN− specific peaks are enriched for co-expression modules involved in transcriptional regulation and immune response during neurodevelopment. Significant enrichment (Sig.), FDR < 0.05. Fisher’s exact test was used for statistics analysis. OR, odds ratio. e Genes assigned to NeuN+ specific peaks are more highly enriched for synaptic functions such as exocytosis, intracellular signal transduction, protein cluster and structural plasticity than genes assigned to NeuN− specific peaks. Sig., FDR < 0.05. Fisher’s exact test was used for statistics analysis. f Genes assigned to NeuN+ specific peaks are highly expressed in neurons, while genes assigned to NeuN− specific peaks are highly expressed in oligodendrocytes and astrocytes. Astro astrocytes, Micro microglia, Endo Endothelial, Oligo oligodendrocytes.
Fig. 3
Fig. 3. Cell-type-specific nature of epigenetic dysregulation in AD.
a We built AD-associated gene regulatory networks by linking genes to hypoacetylated (hypo) and hyperacetylated (hyper) peaks in AD via Hi–C interactions in NeuN+ and NeuN− cells. b AD-associated hyperacetylated peaks were largely active in NeuN− cells, while AD-associated hypoacetylated peaks are largely active in NeuN+ cells in neurotypical controls. c The number of genes mapped to AD-associated hyperacetylated (top) and hypoacetylated (bottom) peaks via Hi–C interactions in NeuN+ and NeuN− cells. CACNG3 is linked to an AD-associated hypoacetylated peak (marked in yellow) in NeuN+ cells (d), while EHD1 is linked to an AD-associated hyperacetylated peak (marked in yellow) in NeuN− cells (e). CACNG3/EHD1 promoter is highlighted in gray and its interacting regions are highlighted in green and purple for NeuN+ and NeuN− cells, respectively. Boxplots in the right show expression levels of CACNG3/EHD1 in NeuN+ (n = 4) and NeuN− (n = 4) cells. FPKM Fragments Per Kilobase of transcript per Million mapped reads. Center, median; box = Q1–Q3; minima, Q1 − 1.5 × IQR; maxima, Q3 + 1.5 × IQR. *FDR < 0.05 (FDR = 2.81e−9 for CACNG3 and FDR = 0.004 for EHD1), calculated by DESeq2 (two-sided Wald test). Source data are provided as a Source Data file. f NeuN+ hypoacetylated genes are highly expressed in neurons, while NeuN− hyperacetylated genes are highly expressed in glia. g NeuN− hyperacetylated genes are enriched in astrocyte-specific co-expression modules (T-M14 and T-M8) that are upregulated in AD. NeuN+ hypoacetylated genes are enriched in neuronal co-expression modules (T-M1, T-M16) that are downregulated in AD. Fisher’s exact test was used for statistical analysis. The red line denotes FDR = 0.01. Astro astrocytes, Micro microglia, Endo endothelial, Oligo oligodendrocytes.
Fig. 4
Fig. 4. Identification and characterization of putative target genes of AD genetic risk factors by incorporating NeuN− chromatin interaction.
a The SNP-based heritability enrichment of AD GWAS in differential NeuN+ and NeuN− peaks suggests glial enrichment. Enrichment ± standard error is depicted. The red broken line indicates heritability enrichment = 1. Source data are provided as a Source Data file. b BIN1 promoter physically interacts with an AD GWS locus in a NeuN− specific manner. The regions that interact with BIN1 promoter (marked in gray) are highlighted in purple. c GO analysis for GWAS-guided AD risk genes identified by NeuN− H-MAGMA. The red line denotes FDR = 0.05. d AD risk genes are highly expressed in postnatal brain samples compared with prenatal samples. Pre prenatal (n = 410); Post, postnatal (n = 453). p = 6.93e−193, calculated by Wilcoxon Rank Sum test. Center, median; box = Q1–Q3; minima, Q1 − 1.5 × IQR; maxima, Q3 + 1.5 × IQR. Source data are provided as a Source Data file. e AD risk genes are highly expressed in microglia. f AD risk genes are significantly enriched for genes differentially regulated in AD microglia. Fisher’s exact test was used for statistics analysis. The red line denotes FDR = 0.01. g AD risk genes are enriched in a microglial co-expression module that is upregulated in AD. Fisher’s exact test was used for statistical analysis. The red line denotes FDR = 0.01. Astro astrocytes, Micro microglia, Endo endothelial, Oligo oligodendrocytes.
Fig. 5
Fig. 5. Comparison of SCZ and BD risk genes.
a The SNP-based heritability enrichment of SCZ and BD GWAS in differential NeuN+ and NeuN− peaks demonstrates neuronal enrichment (SCZ NeuN+, FDR = 9.33e-24; SCZ NeuN−, FDR = 2.14e-16; BD NeuN+, FDR=3.94e-15; BD NeuN−, FDR=6.09e-07). Enrichment ± standard error is depicted. The red broken line indicates heritability enrichment = 1. Source data are provided as a Source Data file. b The SNP-based heritability enrichment of SCZ and BD GWAS in differential Glu and GABA peaks suggests that both Glu and GABA neurons are associated with the psychiatric disorders (SCZ GABA, FDR = 4.54e−9; SCZ Glu, FDR = 3.49e−10; BD GABA, FDR=1.10e−03; BD Glu, FDR = 3.63e−06). Enrichment ± standard error is depicted. The red broken line indicates heritability enrichment = 1. Source data are provided as a Source Data file. c Neuronal subtype expression profiles of SCZ and BD risk genes detected by GABA and Glu H-MAGMA.

References

    1. Pardiñas AF, et al. Common schizophrenia alleles are enriched in mutation-intolerant genes and in regions under strong background selection. Nat. Genet. 2018;50:381–389. - PMC - PubMed
    1. Rada-Iglesias A. Genetic variation within transcriptional regulatory elements and its implications for human disease. Biol. Chem. 2014;395:1453–1460. - PubMed
    1. Wang, D. et al. Comprehensive functional genomic resource and integrative model for the human brain. Science362, eaat8464 (2018). - PMC - PubMed
    1. Won H, et al. Chromosome conformation elucidates regulatory relationships in developing human brain. Nature. 2016;538:523–527. - PMC - PubMed
    1. de la Torre-Ubieta, L. et al. The dynamic landscape of open chromatin during human cortical neurogenesis. Cell172, 289–304 (2018). - PMC - PubMed

Publication types

MeSH terms