

Coral distribution and bleaching vulnerability areas in Southwestern Atlantic under ocean warming
- PMID: 34172760
- PMCID: PMC8233347
- DOI: 10.1038/s41598-021-92202-2
Coral distribution and bleaching vulnerability areas in Southwestern Atlantic under ocean warming
Abstract
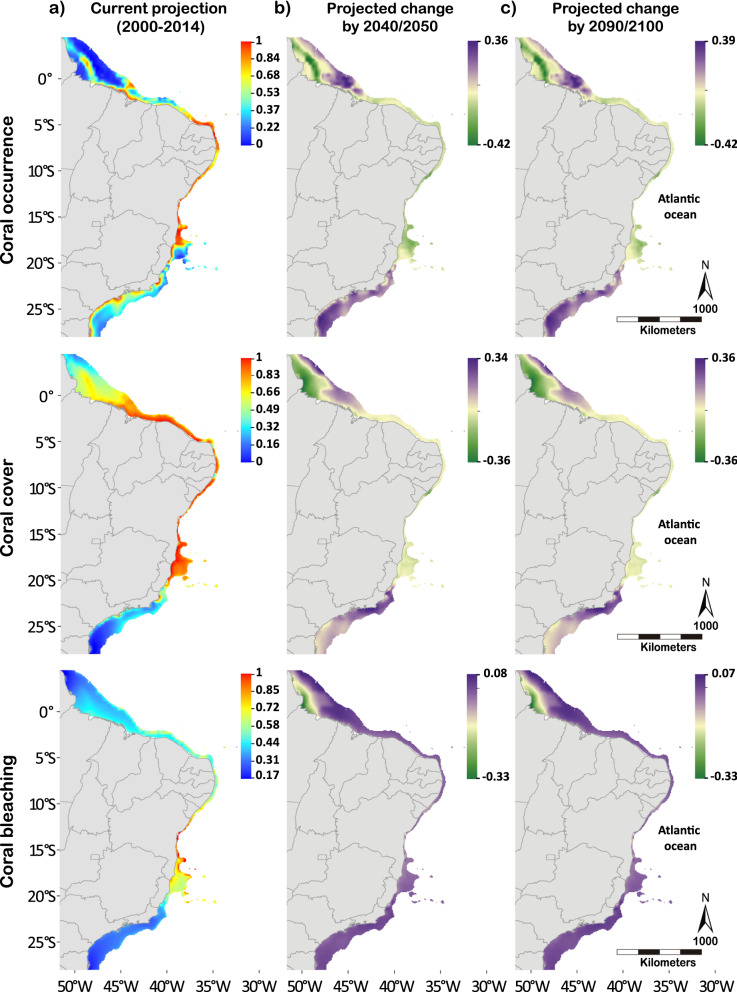
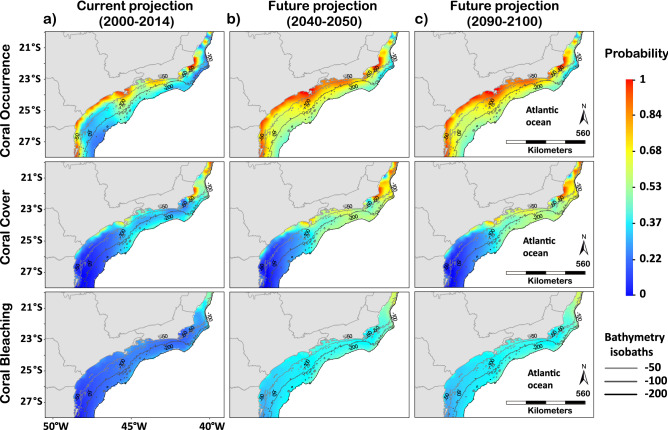
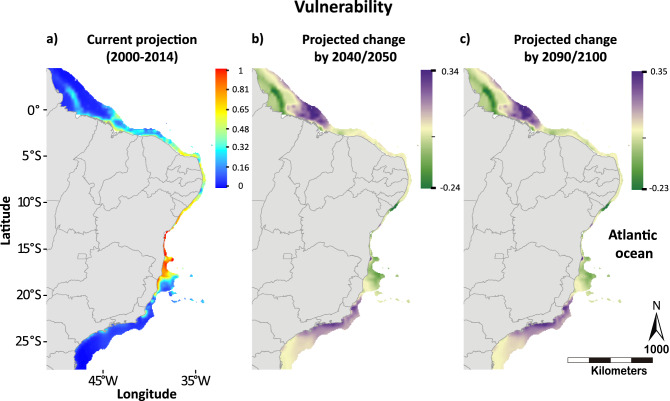
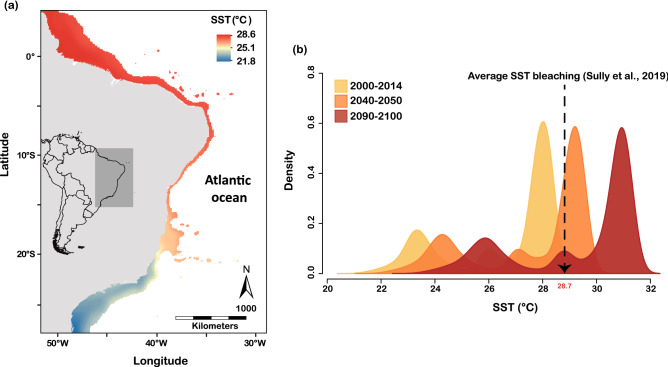
Global climate change is a major threat to reefs by increasing the frequency and severity of coral bleaching events over time, reducing coral cover and diversity. Ocean warming may cause shifts in coral communities by increasing temperatures above coral's upper thermal limits in tropical regions, and by making extratropical regions (marginal reefs) more suitable and potential refugia. We used Bayesian models to project coral occurrence, cover and bleaching probabilities in Southwestern Atlantic and predicted how these probabilities will change under a high-emission scenario (RCP8.5). By overlapping these projections, we categorized areas that combine high probabilities of coral occurrence, cover and bleaching as vulnerability-hotspots. Current coral occurrence and cover probabilities were higher in the tropics (1°S-20°S) but both will decrease and shift to new suitable extratropical reefs (20°S-27°S; tropicalization) with ocean warming. Over 90% of the area present low and mild vulnerability, while the vulnerability-hotspots represent ~ 3% under current and future scenarios, but include the most biodiverse reef complex in South Atlantic (13°S-18°S; Abrolhos Bank). As bleaching probabilities increase with warming, the least vulnerable areas that could act as potential refugia are predicted to reduce by 50%. Predicting potential refugia and highly vulnerable areas can inform conservation actions to face climate change.
Conflict of interest statement
The authors declare no competing interests.
Figures
Similar articles
-
The Thermal Stress History of South Atlantic Reefs Reveals Increasing Intensity, Duration, Frequency, and Likely Undocumented Bleaching Episodes.Glob Chang Biol. 2025 Apr;31(4):e70162. doi: 10.1111/gcb.70162. Glob Chang Biol. 2025. PMID: 40183138
-
Predicting climate-driven regime shifts versus rebound potential in coral reefs.Nature. 2015 Feb 5;518(7537):94-7. doi: 10.1038/nature14140. Epub 2015 Jan 14. Nature. 2015. PMID: 25607371
-
Climate warming, marine protected areas and the ocean-scale integrity of coral reef ecosystems.PLoS One. 2008 Aug 27;3(8):e3039. doi: 10.1371/journal.pone.0003039. PLoS One. 2008. PMID: 18728776 Free PMC article.
-
Diversification of refugia types needed to secure the future of coral reefs subject to climate change.Conserv Biol. 2024 Feb;38(1):e14108. doi: 10.1111/cobi.14108. Epub 2023 Jun 6. Conserv Biol. 2024. PMID: 37144480 Review.
-
Warm-water coral reefs and climate change.Science. 2015 Nov 13;350(6262):769-71. doi: 10.1126/science.aad0349. Science. 2015. PMID: 26564846 Review.
Cited by
-
Systematic review of the uncertainty of coral reef futures under climate change.Nat Commun. 2024 Mar 12;15(1):2224. doi: 10.1038/s41467-024-46255-2. Nat Commun. 2024. PMID: 38472196 Free PMC article.
-
Low functional vulnerability of fish assemblages to coral loss in Southwestern Atlantic marginal reefs.Sci Rep. 2022 Oct 13;12(1):17164. doi: 10.1038/s41598-022-20919-9. Sci Rep. 2022. PMID: 36229468 Free PMC article.
-
What is the evidence for the impact of ocean warming on subtropical and temperate corals and coral reefs? A systematic map.Environ Evid. 2024 Nov 21;13(1):25. doi: 10.1186/s13750-024-00349-y. Environ Evid. 2024. PMID: 39568058 Free PMC article.
-
Exploring depth-related patterns of sponge diversity and abundance in marginal reefs.Ecol Evol. 2024 Jul 2;14(7):e11643. doi: 10.1002/ece3.11643. eCollection 2024 Jul. Ecol Evol. 2024. PMID: 38957700 Free PMC article.
-
Bacterial Community Shifts during Polyp Bail-Out Induction in Pocillopora Corals.Microbiol Spectr. 2023 Aug 17;11(4):e0025723. doi: 10.1128/spectrum.00257-23. Epub 2023 Jun 28. Microbiol Spectr. 2023. PMID: 37378544 Free PMC article.
References
-
- Oliver ECJ, et al. Projected marine heatwaves in the 21st century and the potential for ecological impact. Front. Mar. Sci. 2019;6:1–12. doi: 10.3389/fmars.2019.00734. - DOI
-
- Hoegh-Guldberg, O. Climate change, coral bleaching and the future of the world’ s coral reefs. Ove Hoegh-Guldberg (1998).
Publication types
MeSH terms
LinkOut - more resources
Full Text Sources
Medical
Research Materials
