

Genome-wide association analyses identify genotype-by-environment interactions of growth traits in Simmental cattle
- PMID: 34172761
- PMCID: PMC8233360
- DOI: 10.1038/s41598-021-92455-x
Genome-wide association analyses identify genotype-by-environment interactions of growth traits in Simmental cattle
Abstract
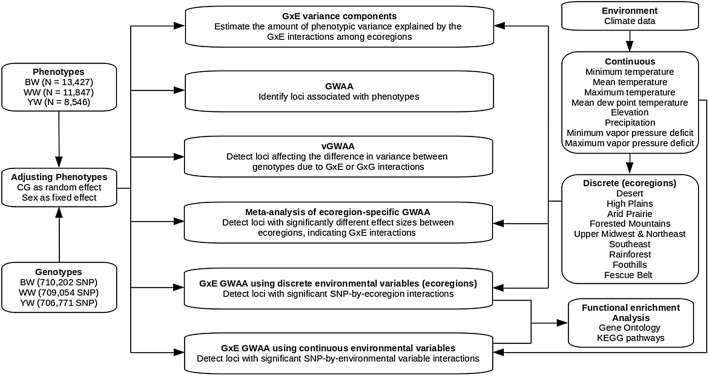
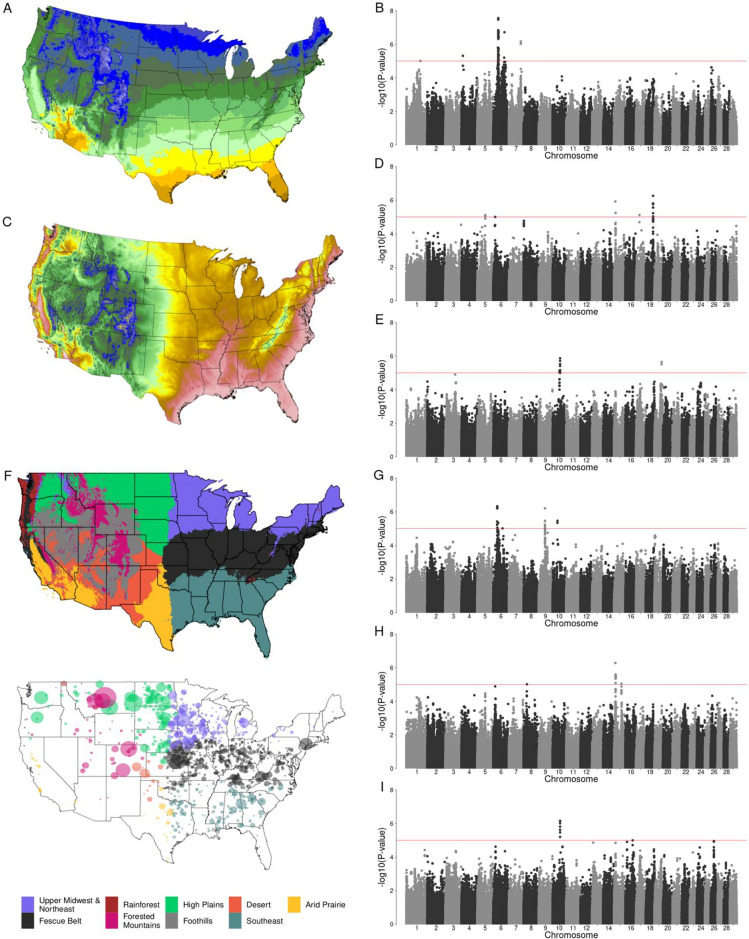
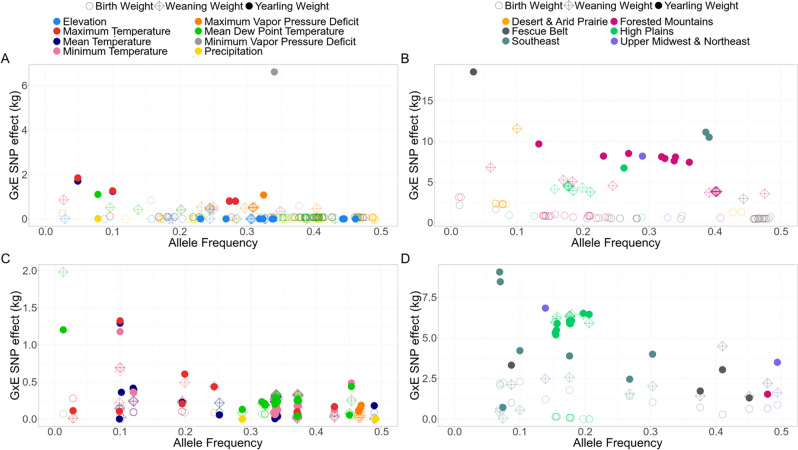
Understanding genotype-by-environment interactions (G × E) is crucial to understand environmental adaptation in mammals and improve the sustainability of agricultural production. Here, we present an extensive study investigating the interaction of genome-wide SNP markers with a vast assortment of environmental variables and searching for SNPs controlling phenotypic variance (vQTL) using a large beef cattle dataset. We showed that G × E contribute 10.1%, 3.8%, and 2.8% of the phenotypic variance of birth weight, weaning weight, and yearling weight, respectively. G × E genome-wide association analysis (GWAA) detected a large number of G × E loci affecting growth traits, which the traditional GWAA did not detect, showing that functional loci may have non-additive genetic effects regardless of differences in genotypic means. Further, variance-heterogeneity GWAA detected loci enriched with G × E effects without requiring prior knowledge of the interacting environmental factors. Functional annotation and pathway analysis of G × E genes revealed biological mechanisms by which cattle respond to changes in their environment, such as neurotransmitter activity, hypoxia-induced processes, keratinization, hormone, thermogenic and immune pathways. We unraveled the relevance and complexity of the genetic basis of G × E underlying growth traits, providing new insights into how different environmental conditions interact with specific genes influencing adaptation and productivity in beef cattle and potentially across mammals.
Conflict of interest statement
The authors declare no competing interests.
Figures
Similar articles
-
Genome-wide association and genotype by environment interactions for growth traits in U.S. Red Angus cattle.BMC Genomics. 2022 Jul 16;23(1):517. doi: 10.1186/s12864-022-08667-6. BMC Genomics. 2022. PMID: 35842584 Free PMC article.
-
Genome-wide association and genotype by environment interactions for growth traits in U.S. Gelbvieh cattle.BMC Genomics. 2019 Dec 4;20(1):926. doi: 10.1186/s12864-019-6231-y. BMC Genomics. 2019. PMID: 31801456 Free PMC article.
-
Genome-wide association study of growth in crossbred beef cattle.J Anim Sci. 2010 Mar;88(3):837-48. doi: 10.2527/jas.2009-2257. Epub 2009 Dec 4. J Anim Sci. 2010. PMID: 19966163
-
Underlying genetic architecture of resistance to mastitis in dairy cattle: A systematic review and gene prioritization analysis of genome-wide association studies.J Dairy Sci. 2023 Jan;106(1):323-351. doi: 10.3168/jds.2022-21923. Epub 2022 Nov 1. J Dairy Sci. 2023. PMID: 36333139
-
Importance of adaptation and genotype × environment interactions in tropical beef breeding systems.Animal. 2012 May;6(5):729-40. doi: 10.1017/S175173111200002X. Animal. 2012. PMID: 22558921 Review.
Cited by
-
The Quest for Genes Involved in Adaptation to Climate Change in Ruminant Livestock.Animals (Basel). 2021 Sep 28;11(10):2833. doi: 10.3390/ani11102833. Animals (Basel). 2021. PMID: 34679854 Free PMC article. Review.
-
Genome-wide association and genotype by environment interactions for growth traits in U.S. Red Angus cattle.BMC Genomics. 2022 Jul 16;23(1):517. doi: 10.1186/s12864-022-08667-6. BMC Genomics. 2022. PMID: 35842584 Free PMC article.
-
Genome-Wide Association Study Using Whole-Genome Sequence Data for Fertility, Health Indicator, and Endoparasite Infection Traits in German Black Pied Cattle.Genes (Basel). 2021 Jul 28;12(8):1163. doi: 10.3390/genes12081163. Genes (Basel). 2021. PMID: 34440337 Free PMC article.
-
Detecting genetic effects on phenotype variability to capture gene-by-environment interactions: a systematic method comparison.G3 (Bethesda). 2024 Apr 3;14(4):jkae022. doi: 10.1093/g3journal/jkae022. G3 (Bethesda). 2024. PMID: 38289865 Free PMC article. Review.
-
Genomic Inbreeding and Runs of Homozygosity Analysis of Cashmere Goat.Animals (Basel). 2024 Apr 22;14(8):1246. doi: 10.3390/ani14081246. Animals (Basel). 2024. PMID: 38672394 Free PMC article.
References
-
- Kolmodin R, Strandberg E, Madsen P, Jensen J, Jorjani H. Genotype by environment interaction in Nordic dairy cattle studied using reaction norms. Acta Agric. Scand. Sect. A Anim. Sci. 2002;52:11–24.
-
- Falconer DS, Mackay TFC. Introduction to Quantitative Genetics. 4. Longmans Green; 1996.
Publication types
MeSH terms
LinkOut - more resources
Full Text Sources
