. 2021 Jun 25;11(1):13330.
doi: 10.1038/s41598-021-92583-4.

Simultaneous multi-nuclide imaging via double-photon coincidence method with parallel hole collimators

Affiliations

Simultaneous multi-nuclide imaging via double-photon coincidence method with parallel hole collimators

Mizuki Uenomachi et al. Sci Rep. .

Abstract

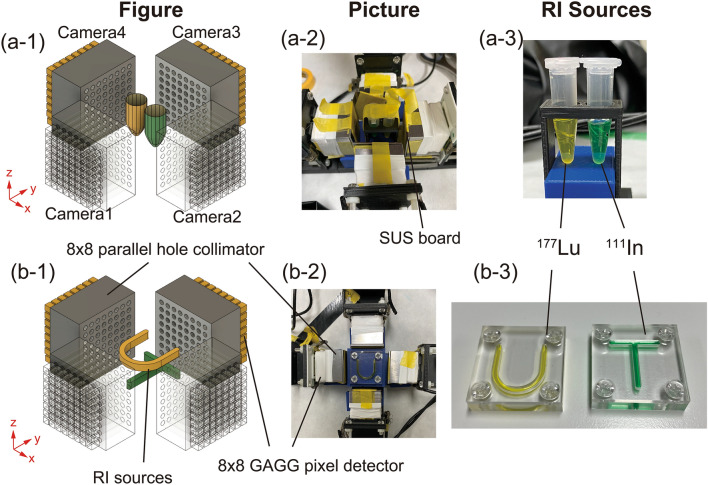
Multi-tracer imaging can provide useful information in the definitive diagnosis and research of medical, biological, and pharmaceutical sciences. Single-photon emission computed tomography (SPECT) is one of the nuclear medicine imaging modalities widely used for diagnosis or medical research and has a multi-tracer imaging capability. One of the drawbacks of multi-tracer imaging is crosstalk from other gamma rays, which affects the reconstructed image. Scattering correction methods, such as the dual- and triple-energy window methods, are used for conventional SPECT imaging to reduce the background caused by the crosstalk. This study proposes another crosstalk reduction method. Some nuclides emit two or more gamma rays through intermediate levels. Thus, detecting these gamma rays with the coincidence method allows us to distinguish a true gamma ray signal and a background signal. The nuclide position can be estimated at the intersection of two gamma rays using collimators. We demonstrate herein simultaneous 111In and 177Lu imaging via the double-photon coincidence method using GAGG detectors and parallel hole collimators. The double-photon coincidence method greatly reduces the background caused by other gamma rays and offers higher-quality images than does conventional imaging.


Conflict of interest statement

The authors declare no competing interests.

Figures

Figure 1
Figure 1
Principle of the double photon coincidence imaging and decay scheme of 111In and 177Lu. (a) The conceptual schematic of the double photon coincidence imaging. (b) 111In decay scheme. Two gamma rays with 171 and 245 keV energies are emitted through the intermediate level with 85 ns duration after electron capture. (c) 177Lu decay scheme. 177Lu emits beta rays and some gamma rays. Gamma rays with 208 and 113 keV energies are mainly emitted through the intermediate level with 0.506 ns duration. Figure (a) was created using the software (Wondershare EdrawMax, v.10.1.5, https://www.edrawsoft.com).
Figure 2
Figure 2
2D imaging results for 111In and 177Lu in the microtubes in one direction. (a-1) Single-photon imaging using 171 keV gamma rays. (a-2) Single-photon imaging using 245 keV gamma rays. The overlaps in the photopeak spectra of 208 and 245 keV mainly contribute to the background (BG) events that make the artifacts in the image. (a-3) Double-photon coincidence imaging. (a-4) 1D plot at the z-pixel = 5. The background in the 177Lu position is reduced by the coincidence method. (b-1) Single-photon imaging using 113 keV gamma rays. The scattering events of 111In mainly contribute to the BG events that make the artifacts in the image. (b-2) Single-photon imaging using 208 keV gamma rays. (b-3) Double-photon coincidence imaging. (b-4) 1D plot at the z-pixel = 5. The background in the 111In position is reduced by the coincidence method.
Figure 3
Figure 3
3D imaging results for 111In and 177Lu in the microtubes. (a-1) 2D slice images of 111In by double-photon imaging in the xz plane (y-slice = 4). (a-2) yz plane (x-slice = 3). (a-3) xy plane (z-slice = 4). (a-4) 2D slice images of 111In by 171 keV single-photon imaging in the xz plane (y-slice = 4). (a-5) 2D slice images of 111In by 245 keV single-photon imaging in the xz plane (y-slice = 4). (a-6) 1D slice on the x-axis of the xy plane (y-pixel = 4). (a-7) 1D plot in the y-axis of the xy plane (x-pixel = 5). The dot lines denote the background value. (b-1) 2D slice images of 177Lu by double-photon imaging in the xz plane (y-slice = 4). (b-2) yz plane (x-slice = 3). (b-3) xy plane (z-slice = 4). (b-4) 2D slice images of 177Lu by 113 keV single-photon imaging in the xz plane (y-slice = 4). (b-5) 2D slice images of 177Lu by 208 keV single-photon imaging in the xz plane (y-slice = 4). (b-6) 1D plot in the x-axis of the xy plane (y pixel = 4). (b-7) 1D slice on the y-axis of the xy plane (x-pixel = 1). The dot lines denote the background value.
Figure 4
Figure 4
3D imaging results of the distribution sources. The RI source of 111InCl3 was in an acrylic case of the alphabetical letter “T,” while the RI source of 177LuCl3 was in an acrylic case of the alphabetical letter “U”. (a-1) 3D image of 111In by single-photon BP imaging using 171 keV gamma rays. (a-2) 3D image of 111In by double-photon coincidence imaging. (b-1) 3D image of 177Lu by single-photon BP imaging using 208 keV gamma rays. (b-2) 3D image of 177Lu by double-photon coincidence imaging.
Figure 5
Figure 5
Experimental setup. (a-1a-3) Experimental setup with the RI sources of 111In and 177Lu in 0.5 mL microtubes ((a-1) experimental setup, (a-2) experiment, and (a-3) RI sources in the microtubes). (b-1b-3) Experimental setup with the RI sources of 111In and 177Lu in the acrylic cases of alphabetical letters “U” and “T” ((b-1) experiment setup, (b-2) experiment, and (b-3) RI sources in the acrylic cases of alphabetical letters “U” and “T”). Figure (a-1,b-2) were created using the software (Autodesk Fusion 360, v.2.0.9719, https://www.autodesk.com).
Figure 6
Figure 6
Spectra, examples of the time width window, and histogram of the time difference. (a) Spectra of 111In and 177Lu measured by 1 px of an HR-GAGG pixel detector. (b) Examples of the time width window for event selection. (c) Histograms of the time difference of 111In and 177Lu. A tail caused by the relatively long duration of 85 ns is shown in the 111In histogram.
Figure 7
Figure 7
Imaging methods. (a) The single-photon 2D imaging method. (b) The double-photon 2D imaging method. The 2D imaging in one direction provides an image in the xz plane with 8 × 8 px. The coincidence events between cameras 1 and 2, 3, or 4 are used for the double-photon coincidence 2D imaging. (c) The single-photon 3D imaging method. The back projection (BP) method is used for single-photon 3D imaging. Eight voxels in the xy plane are incremented by 1/8 from two directions. (d) The double-photon 3D imaging method. The coincidence events of 90° are used for double-photon 3D imaging. A voxel determined by an intersection of the coincidence event directions is increased by 1. This figure was created using the software (Adobe Illustrator, Illustrator CC 24, https://www.adobe.com/products/illustrator.html).

Similar articles

Cited by

References

    1. Eary JF. Nuclear medicine in cancer diagnosis. Lancet. 1999;254:853–857. doi: 10.1016/S0140-6736(99)80041-5. - DOI - PubMed
    1. Ahn BC. Personalized medicine based on theranostic radioiodine molecular imaging for differentiated thyroid cancer. BioMed. Res. Int. 2016 doi: 10.1155/2016/1680464. - DOI - PMC - PubMed
    1. Alexander EK, Larsen PR. High dose 131I therapy for the treatment of hyperthyroidism caused by Graves’ disease. J. Clin. Endocrinol. Metab. 2002;87:1073–1077. doi: 10.1210/jcem.87.3.8333. - DOI - PubMed
    1. Forrer F, Waldherr C, Maecke HR, Mueller-Brand J. Targeted radionuclide therapy with 90Y-DOTATOC in patients with neuroendocrine tumors. Anticancer Res. 2006;26:703–707. - PubMed
    1. Lindén O, et al. Dose-fractionated radioimmunotherapy in non-Hodgkin's lymphoma using DOTA-conjugated, 90Y-radiolabeled, humanized anti-CD22 monoclonal antibody, epratuzumab. Clin. Cancer Res. 2005;11:5215–5222. doi: 10.1158/1078-0432.CCR-05-0172. - DOI - PubMed

Publication types