

Lung adenocarcinoma and lung squamous cell carcinoma cancer classification, biomarker identification, and gene expression analysis using overlapping feature selection methods
- PMID: 34172784
- PMCID: PMC8233431
- DOI: 10.1038/s41598-021-92725-8
Lung adenocarcinoma and lung squamous cell carcinoma cancer classification, biomarker identification, and gene expression analysis using overlapping feature selection methods
Abstract
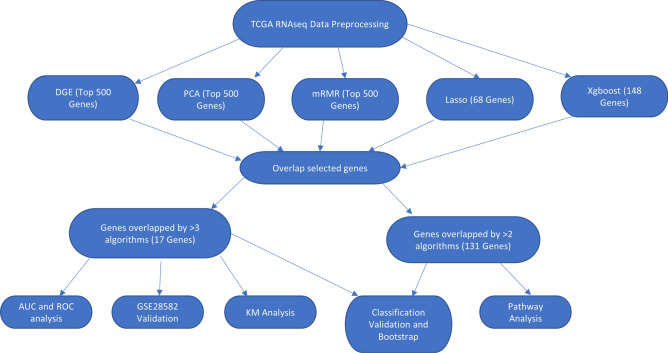
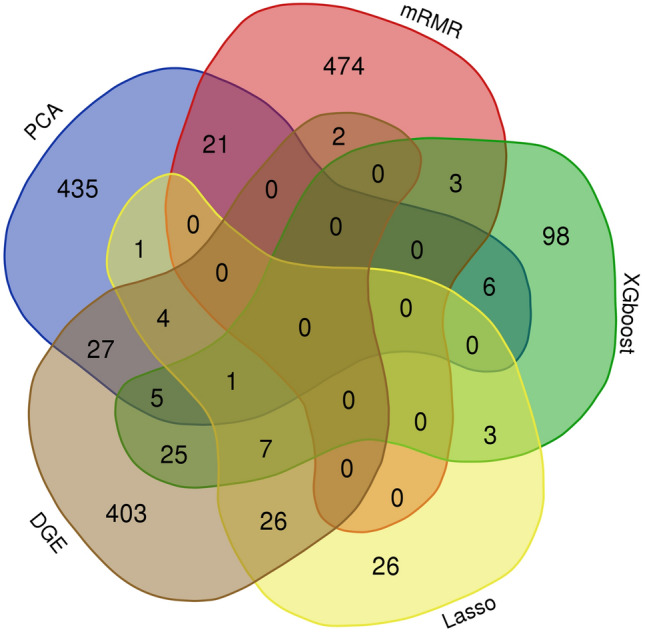
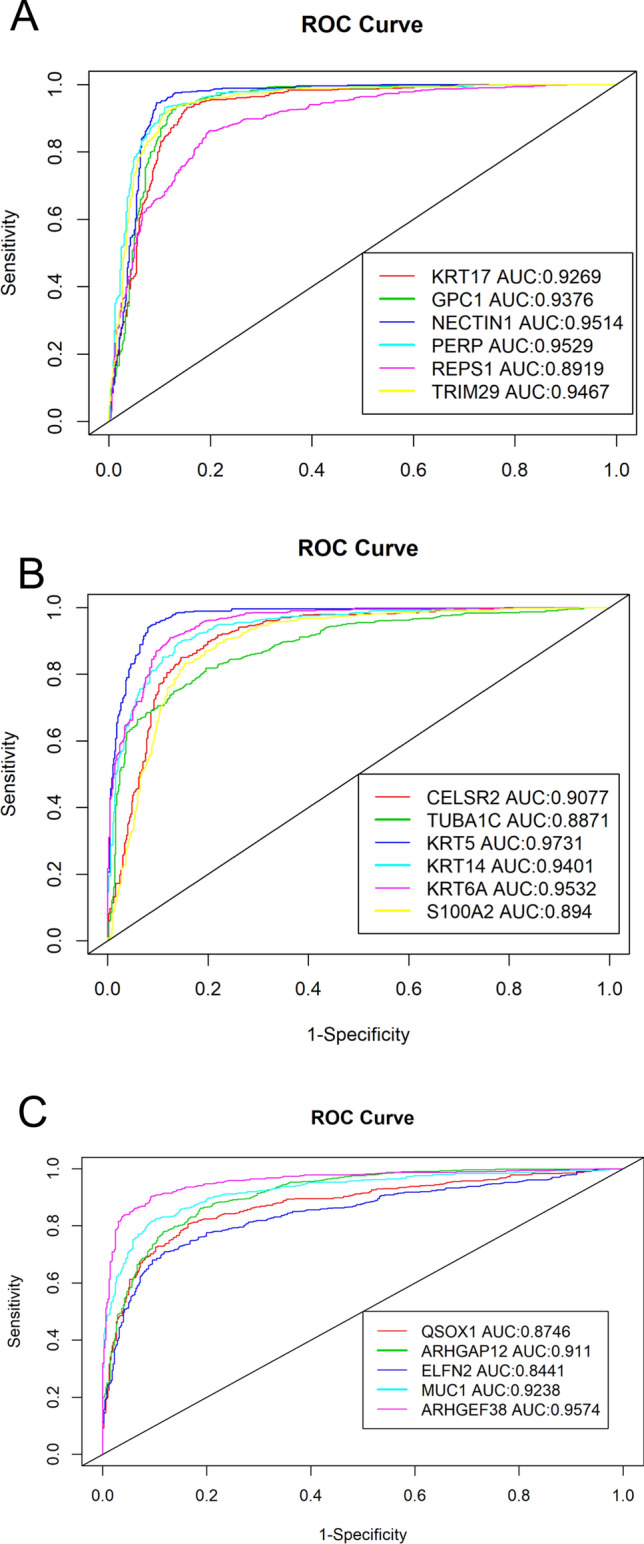
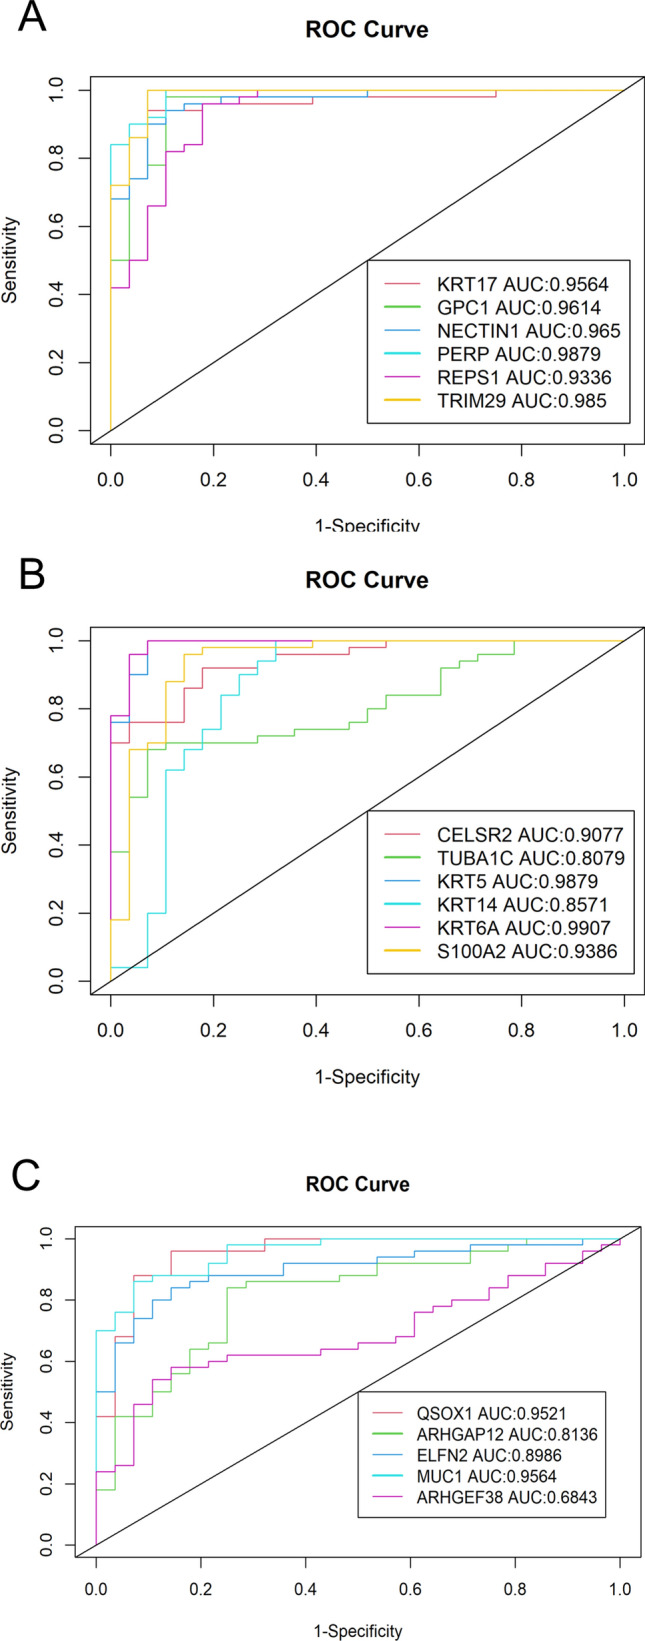
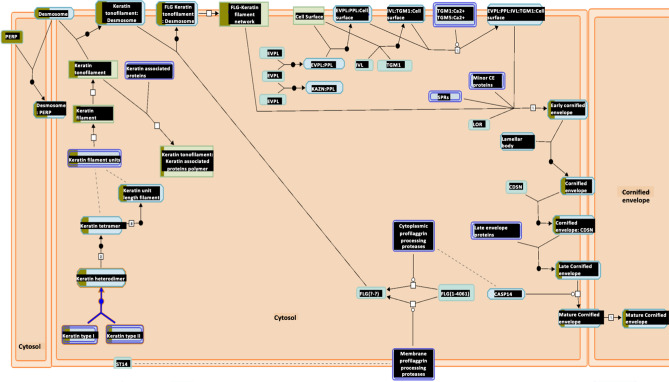
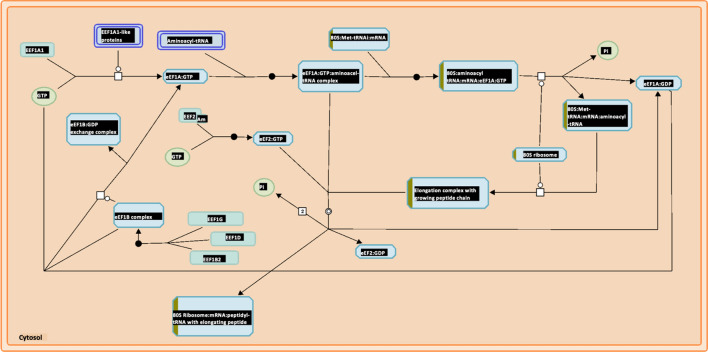
Lung cancer is one of the deadliest cancers in the world. Two of the most common subtypes, lung adenocarcinoma (LUAD) and lung squamous cell carcinoma (LUSC), have drastically different biological signatures, yet they are often treated similarly and classified together as non-small cell lung cancer (NSCLC). LUAD and LUSC biomarkers are scarce, and their distinct biological mechanisms have yet to be elucidated. To detect biologically relevant markers, many studies have attempted to improve traditional machine learning algorithms or develop novel algorithms for biomarker discovery. However, few have used overlapping machine learning or feature selection methods for cancer classification, biomarker identification, or gene expression analysis. This study proposes to use overlapping traditional feature selection or feature reduction techniques for cancer classification and biomarker discovery. The genes selected by the overlapping method were then verified using random forest. The classification statistics of the overlapping method were compared to those of the traditional feature selection methods. The identified biomarkers were validated in an external dataset using AUC and ROC analysis. Gene expression analysis was then performed to further investigate biological differences between LUAD and LUSC. Overall, our method achieved classification results comparable to, if not better than, the traditional algorithms. It also identified multiple known biomarkers, and five potentially novel biomarkers with high discriminating values between LUAD and LUSC. Many of the biomarkers also exhibit significant prognostic potential, particularly in LUAD. Our study also unraveled distinct biological pathways between LUAD and LUSC.
Conflict of interest statement
The authors declare no competing interests.
Figures
Similar articles
-
System analysis of FHIT in LUAD and LUSC: The expression, prognosis, gene regulation network, and regulation targets.Int J Biol Markers. 2022 Jun;37(2):158-169. doi: 10.1177/03936155221084056. Epub 2022 Mar 7. Int J Biol Markers. 2022. PMID: 35254116
-
Prediction of Responsiveness to PD-L1/PD-1 Inhibitors Using miRNA Profiles Associated With PD-L1 Expression in Lung Adenocarcinoma and Squamous Cell Carcinoma.Anticancer Res. 2024 May;44(5):2081-2089. doi: 10.21873/anticanres.17012. Anticancer Res. 2024. PMID: 38677736
-
Unveiling ficolins: diagnostic and prognostic biomarkers linked to the Tumor Microenvironment in Lung Cancer.World J Surg Oncol. 2024 Oct 10;22(1):273. doi: 10.1186/s12957-024-03558-4. World J Surg Oncol. 2024. PMID: 39390580 Free PMC article.
-
The Effect of GLUT1 on the Survival Rate and Immune Cell Infiltration of Lung Adenocarcinoma and Squamous Cell Carcinoma: A Meta and Bioinformatics Analysis.Anticancer Agents Med Chem. 2022;22(2):223-238. doi: 10.2174/1871520621666210708115406. Anticancer Agents Med Chem. 2022. PMID: 34238200 Review.
-
Differences between lung adenocarcinoma and lung squamous cell carcinoma: Driver genes, therapeutic targets, and clinical efficacy.Genes Dis. 2024 Jul 11;12(3):101374. doi: 10.1016/j.gendis.2024.101374. eCollection 2025 May. Genes Dis. 2024. PMID: 40083325 Free PMC article. Review.
Cited by
-
Stemness genes and miR-1247-3p expression associate with clinicopathological parameters and prognosis in lung adenocarcinoma.PLoS One. 2023 Nov 10;18(11):e0294171. doi: 10.1371/journal.pone.0294171. eCollection 2023. PLoS One. 2023. PMID: 37948380 Free PMC article.
-
Topological embedding and directional feature importance in ensemble classifiers for multi-class classification.Comput Struct Biotechnol J. 2024 Nov 13;23:4108-4123. doi: 10.1016/j.csbj.2024.11.013. eCollection 2024 Dec. Comput Struct Biotechnol J. 2024. PMID: 39624167 Free PMC article.
-
Evaluation of Solubility, Dissolution Rate, and Oral Bioavailability of β-Cyclodextrin and Hydroxypropyl β-Cyclodextrin as Inclusion Complexes of the Tyrosine Kinase Inhibitor, Alectinib.Pharmaceuticals (Basel). 2024 Jun 5;17(6):737. doi: 10.3390/ph17060737. Pharmaceuticals (Basel). 2024. PMID: 38931404 Free PMC article.
-
Dietary factors and the risk of lung cancer by epidermal growth factor receptor mutation status and histological subtypes.Front Public Health. 2022 Dec 2;10:1079543. doi: 10.3389/fpubh.2022.1079543. eCollection 2022. Front Public Health. 2022. PMID: 36530673 Free PMC article.
-
Total mutational load and clinical features as predictors of the metastatic status in lung adenocarcinoma and squamous cell carcinoma patients.J Transl Med. 2022 Aug 18;20(1):373. doi: 10.1186/s12967-022-03572-8. J Transl Med. 2022. PMID: 35982500 Free PMC article.
References
MeSH terms
Substances
LinkOut - more resources
Full Text Sources
Medical
