. 2021 Jun 25;11(1):13325.
doi: 10.1038/s41598-021-92683-1.

Viscoelastic testing reveals normalization of the coagulation profile 12 weeks after severe COVID-19

Affiliations

Viscoelastic testing reveals normalization of the coagulation profile 12 weeks after severe COVID-19

Abakar Magomedov et al. Sci Rep. .

Abstract

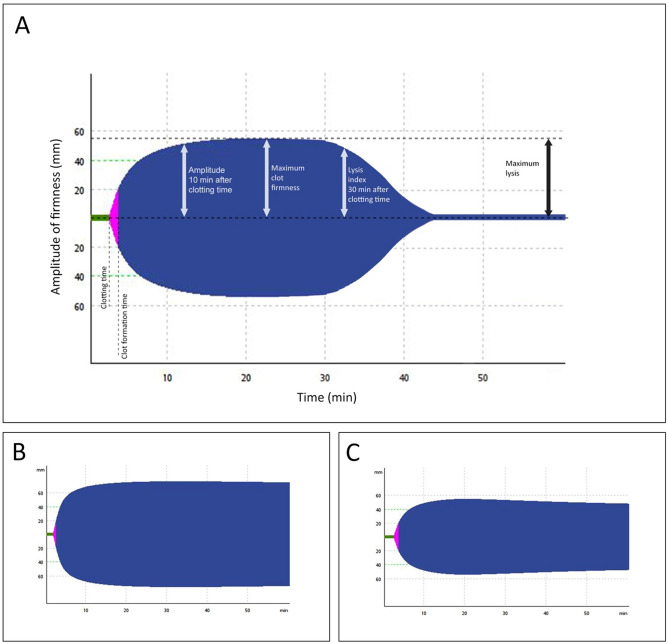
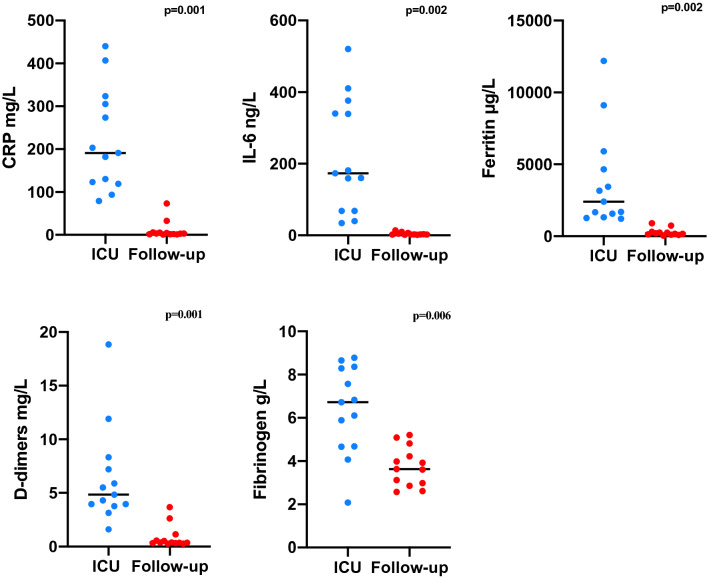
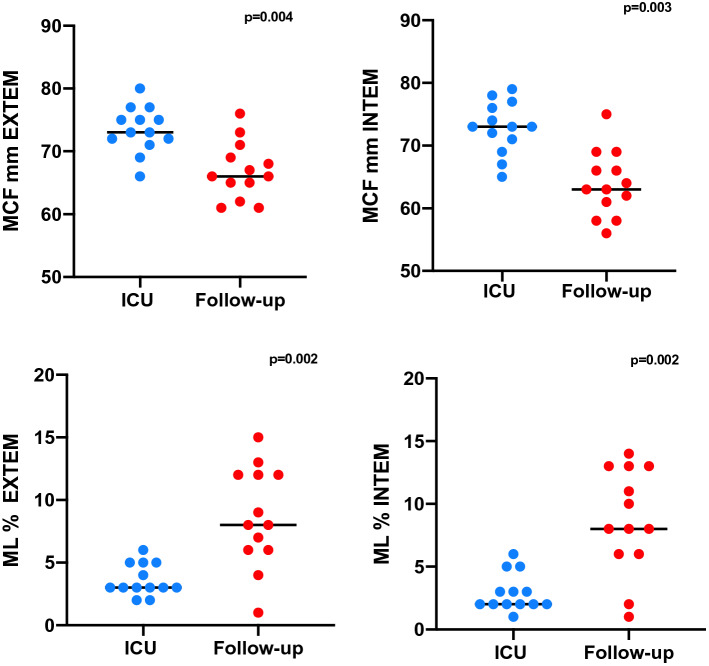
COVID 19 is associated with a hypercoagulable state and frequent thromboembolic complications. For how long this acquired abnormality lasts potentially requiring preventive measures, such as anticoagulation remains to be delineated. We used viscoelastic rotational thrombelastometry (ROTEM) in a single center cohort of 13 critical ill patients and performed follow up examinations three months after discharge from ICU. We found clear signs of a hypercoagulable state due to severe hypofibrinolysis and a high rate of thromboembolic complications during the phase of acute illness. Three month follow up revealed normalization of the initial coagulation abnormality and no evidence of venous thrombosis in all thirteen patients. In our cohort the coagulation profile was completely normalized three months after COVID-19. Based on these findings, discontinuation of anticoagulation can be discussed in patients with complete venous reperfusion.


Conflict of interest statement

The authors declare no competing interests.

Figures

Figure 1
Figure 1
(A) Shows all measured values in ROTEM analysis, including clotting time (CT [s]), clot formation time (CFT [s]), maximum clot firmness (MCF [mm]) and maximum lysis (ML [%(range)]). (B) Describes a fibrinolysis shutdown pattern (increased MCF, low ML) in a COVID-19 patient with a thromboembolic event; the clot amplitude remains unchanged until the end. (C) Shows a clot profile with reduced MCF and increased ML in a patient during the follow-up presentation.
Figure 2
Figure 2
Comparison of inflammatory markers during ICU stay and follow-up visit (n = 13, Wilcoxon signed rank test).
Figure 3
Figure 3
Comparison of coagulation parameters during ICU stay and follow-up visit (n = 13, Wilcoxon signed rank test).

References

    1. Jin Y, Yang H, Ji W, et al. Virology, epidemiology, pathogenesis, and control of COVID-19. Viruses. 2020;12:372. doi: 10.3390/v12040372. - DOI - PMC - PubMed
    1. Dong E, Du H, Gardner L. An interactive web-based dashboard to track COVID-19 in real time. Lancet Infect. Dis. 2020;20:533–534. doi: 10.1016/S1473-3099(20)30120-1. - DOI - PMC - PubMed
    1. Ronco C, Reis T, Husain-Syed F. Management of acute kidney injury in patients with COVID-19. Lancet Respir. Med. 2020;8:738–742. doi: 10.1016/S2213-2600(20)30229-0. - DOI - PMC - PubMed
    1. Chan L, Chaudhary K, Saha A, et al. AKI in hospitalized patients with COVID-19. J. Am. Soc. Nephrol. 2020;32:151–160. doi: 10.1681/ASN.2020050615. - DOI - PMC - PubMed
    1. Akhmerov A, Marban E. COVID-19 and the heart. Circ. Res. 2020;126:1443–1455. doi: 10.1161/CIRCRESAHA.120.317055. - DOI - PMC - PubMed

Publication types