. 2021 Jun 25;4(1):796.
doi: 10.1038/s42003-021-02297-6.

Hepatic resistance to cold ferroptosis in a mammalian hibernator Syrian hamster depends on effective storage of diet-derived α-tocopherol

Affiliations

Hepatic resistance to cold ferroptosis in a mammalian hibernator Syrian hamster depends on effective storage of diet-derived α-tocopherol

Daisuke Anegawa et al. Commun Biol. .

Abstract

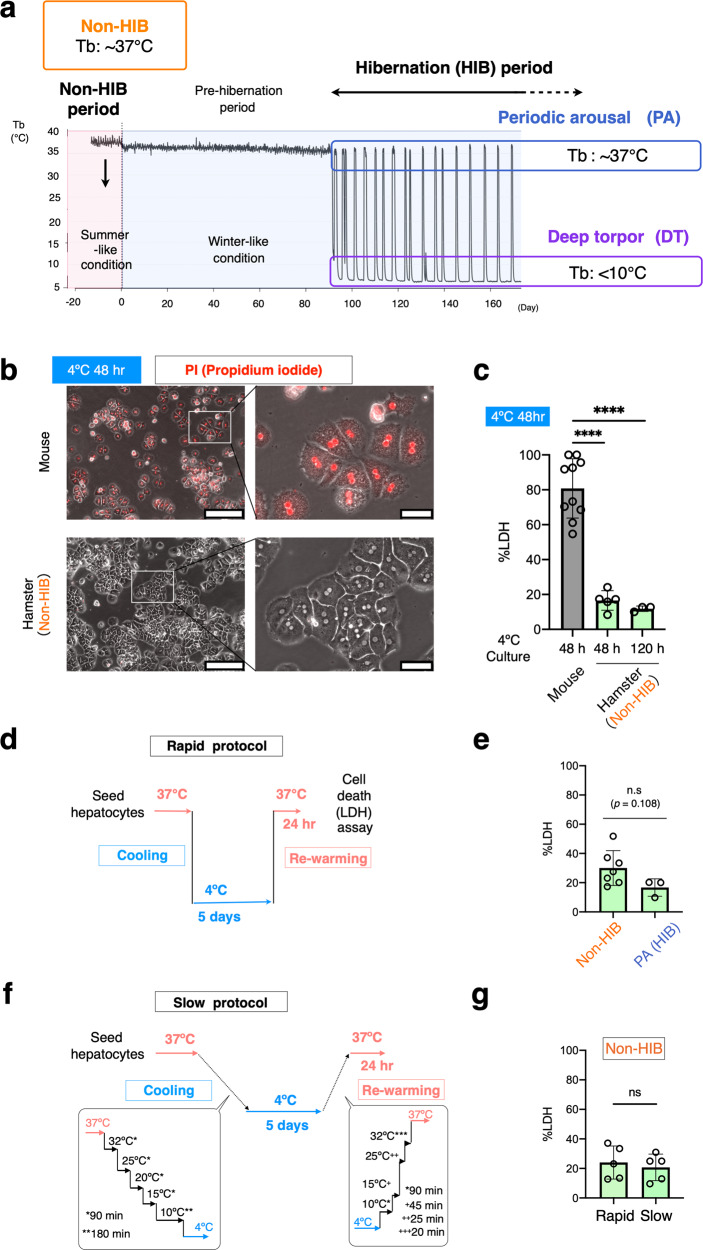
Mammalian hibernators endure severe and prolonged hypothermia that is lethal to non-hibernators, including humans and mice. The mechanisms responsible for the cold resistance remain poorly understood. Here, we found that hepatocytes from a mammalian hibernator, the Syrian hamster, exhibited remarkable resistance to prolonged cold culture, whereas murine hepatocytes underwent cold-induced cell death that fulfills the hallmarks of ferroptosis such as necrotic morphology, lipid peroxidation and prevention by an iron chelator. Unexpectedly, hepatocytes from Syrian hamsters exerted resistance to cold- and drug-induced ferroptosis in a diet-dependent manner, with the aid of their superior ability to retain dietary α-tocopherol (αT), a vitamin E analog, in the liver and blood compared with those of mice. The liver phospholipid composition is less susceptible to peroxidation in Syrian hamsters than in mice. Altogether, the cold resistance of the hibernator's liver is established by the ability to utilize αT effectively to prevent lipid peroxidation and ferroptosis.


Conflict of interest statement

The authors declare no competing interests.

Figures

Fig. 1
Fig. 1. Intrinsic cold resistance in primary cultured hepatocytes of Syrian hamsters.
a Schematic representation of changes in the core body temperature during hibernation in Syrian hamsters. Animals raised in summer-like (warm and long photoperiod) conditions are regarded as animals in non-HIB period. Several months after exposure to winter-like (cold and short photoperiodic) conditions, the animals begin to hibernate; the animals entered into deep torpor (DT) that lasted about 4–5 days. DT was spontaneously interrupted by periodic arousal (PA), which lasted about 12–24 h. Cycles of DT and PA were repeated continuously during HIB period. b Phase-contrast images of cultured hepatocytes from mouse and Syrian hamsters. Dead cells were stained with propidium iodide (PI). Scale bars; left, 250 μm. Right, 50 μm. c The amount of cell death determined by LDH release assay after 48 or 120 h of cold culture. ****p < 0.0001 (Two-tailed Welch’s t-test). dg An experimental procedure to recapitulate the DT-PA (cold-rewarming) process in cultured cells (d, f). No significant difference (ns) in the amount of cell death was found after both rapid and slow cold-rewarming stress, as determined by LDH assay, between summer-like euthermic animals and winter-like periodically aroused hamsters (e, g). Two-tailed unpaired t-test. Data are represented as the mean ± standard deviation (SD) and each data point in (c) and (d) represents an independent sample replicate.
Fig. 2
Fig. 2. Diet-dependent resistance to cold-induced ferroptosis-like cell death in Syrian hamster hepatocytes.
a Cold resistance was observed only in hepatocytes isolated from Syrian hamsters fed with the STD diet (STD), but not those fed with the STC diet (STC). ****p < 0.0001 (Two-tailed Welch’s t-test). b An experimental procedure for mitoB and 18O2 labeling to detect mitochondrial H2O2 production and lipid peroxidation under cold-culture conditions. c Increase in the ratio of 18O-containing mitoP to mitoB under cold culture. Results from two independent samples (1 and 2) have been shown. d Inhibition of cold-induced cell death by ferroptosis inhibitors (100 μM of deferoxamine, 1 μM of ferrostatin-1, or 100 μM of Trolox) in hepatocytes from STC hamsters and mice. ****p < 0.0001, *p < 0.05 versus Control (One-way ANOVA with the Tukey’s multiple comparison test). e Lipid peroxidation (TBARS assay) occurred only in cold-cultured hepatocytes from STC hamsters. TBARS levels were measured immediately after hepatocyte isolation, after pre-culture at 37 °C for 20 h, and after cold culture for 4 or 8 h. n = 3 (STC) or n = 4 (STD) independent sample replicates. *p < 0.05 (One-way ANOVA with the Tukey’s multiple comparison test). f LC–MS identification of oxidized 38:4-PE in cold-cultured hepatocytes. Upper, structure of 38:4-PE and its possible oxidized forms. Lower, comparison of extracted ion chromatogram of oxidized lipid species between STC and STD at different temperature (37 or 4 °C). Multiple peaks for oxidized 38:4-PE species (inside dashed lines) dominantly appeared in STC hepatocytes and those labeled with 18O were detected only in STC hepatocytes at 4 °C. g Relative quantification of PE (38:4) + 18O2, an oxidized PE (38:4) with two 18O atoms. It was detected by LC–MS analysis in hepatocytes from STC hamsters or mice, but not from STD hamsters, after 12-h cold culture. N.D. (not detected). h Ferroptosis was induced by 2-μM RSL3 or 1-mM BSO in hepatocytes from STC hamsters and mice, but not from STD hamsters, under 37 °C culture conditions. **p < 0.01, *p < 0.05 versus Control (One-way ANOVA with the Tukey’s multiple comparison test). i The amount of PE (38:4) in freshly isolated hepatocytes measured by LC–MS analysis. ****p < 0.0001, ns p > 0.05 (One-way ANOVA with the Tukey’s multiple comparison test). Data are represented as the mean ± SD and each data point in (a), (b), (g), (h) and (i) represents an independent sample replicate.
Fig. 3
Fig. 3. Lipidome analysis revealed different phospholipid compositions of hepatocytes between mouse and hamster.
a Principle component analysis (PCA) of PL-PC and PL-PE species in freshly isolated hepatocytes from mouse, STC hamster, and STD hamster. b Pie charts showing the average percentage of lipid species classified by the number of carbon–carbon double bonds. c Hierarchical clustering of the relative amount of PC species among distinct groups of animals. Relative abundance of each lipid species among samples is shown by blue red gradient.
Fig. 4
Fig. 4. Intake of sufficient dietary αT is required for the cold resistance of hamster hepatocytes.
a Schemes for oral administration of αT to hamsters. 20-μg αT/g body mass dissolved in olive oil was administered to STC hamsters once a day for 2 weeks. b The amount of cell death after 48-h cold culture among hamsters administered with PBS, olive oil, or αT. ****p < 0.0001, ***p < 0.001, ns p > 0.05 (One-way ANOVA with Tukey’s multiple comparison test). c αT content in freshly isolated hepatocytes. αT level was normalized to the total protein amount in the hepatocyte lysates. Letters a, b, c refer to the significant differences of αT level from each other—if two columns do not share a letter, they are significantly different (p < 0.05) (One-way ANOVA with the Tukey’s multiple comparison test). d Relationship between the amount of cell death and αT content in (c). e, f αT concentration in plasma of STC hamsters, STD hamsters, and STD mice in summer-like (non-HIB) condition, and of STC hamsters in summer-like, non-HIB, or at periodic arousal during HIB (HIB-PA). ***p < 0.001 (One-way ANOVA with the Tukey’s multiple comparison test), *p < 0.05 (Welch’s t-test). g Inhibition of cold-induced cell death by 4-mM vitamin C or 10-μM idebenone in STC hamster hepatocytes. **p < 0.01 (Two-tailed paired t-test). A scheme for treating hepatocytes with vitamin C or idebenone is shown. Data are represented as the mean ± SD and each data point in (bg) represents an independent sample.

Similar articles

Cited by

References

    1. Andrews, M. T. Molecular interactions underpinning the phenotype of hibernation in mammals. J. Exp. Biol. 222, 10.1242/jeb.160606 (2019). - PubMed
    1. Mohr SM, Bagriantsev SN, Gracheva EO. Cellular, molecular, and physiological adaptations of hibernation: the solution to environmental challenges. Annu. Rev. Cell Dev. Biol. 2020;36:315–338. doi: 10.1146/annurev-cellbio-012820-095945. - DOI - PubMed
    1. Carey HV, Andrews MT, Martin SL. Mammalian hibernation: cellular and molecular responses to depressed metabolism and low temperature. Physiol. Rev. 2003;83:1153–1181. doi: 10.1152/physrev.00008.2003. - DOI - PubMed
    1. Aloia RC, Raison JK. Membrane function in mammalian hibernation. Biochim. Biophys. Acta. 1989;988:123–146. doi: 10.1016/0304-4157(89)90007-5. - DOI - PubMed
    1. Orr AL, Lohse LA, Drew KL, Hermes-Lima M. Physiological oxidative stress after arousal from hibernation in Arctic ground squirrel. Comp. Biochem. Physiol. A Mol. Integr. Physiol. 2009;153:213–221. doi: 10.1016/j.cbpa.2009.02.016. - DOI - PMC - PubMed

Publication types

Substances