. 2021 Jun 25;4(1):801.
doi: 10.1038/s42003-021-02328-2.

Auditory cortical micro-networks show differential connectivity during voice and speech processing in humans

Affiliations

Auditory cortical micro-networks show differential connectivity during voice and speech processing in humans

Florence Steiner et al. Commun Biol. .

Abstract

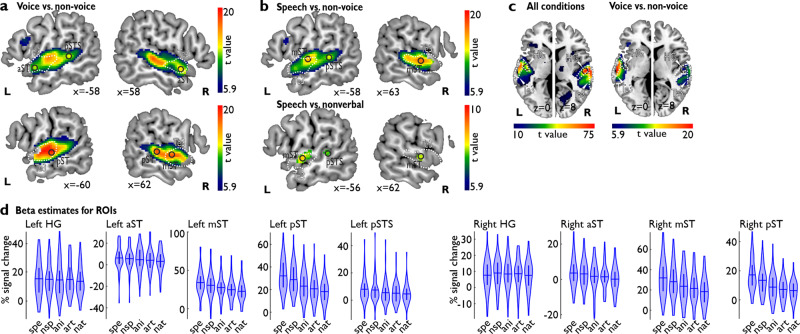
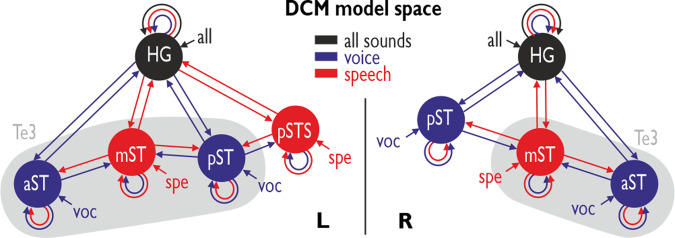
The temporal voice areas (TVAs) in bilateral auditory cortex (AC) appear specialized for voice processing. Previous research assumed a uniform functional profile for the TVAs which are broadly spread along the bilateral AC. Alternatively, the TVAs might comprise separate AC nodes controlling differential neural functions for voice and speech decoding, organized as local micro-circuits. To investigate micro-circuits, we modeled the directional connectivity between TVA nodes during voice processing in humans while acquiring brain activity using neuroimaging. Results show several bilateral AC nodes for general voice decoding (speech and non-speech voices) and for speech decoding in particular. Furthermore, non-hierarchical and differential bilateral AC networks manifest distinct excitatory and inhibitory pathways for voice and speech processing. Finally, while voice and speech processing seem to have distinctive but integrated neural circuits in the left AC, the right AC reveals disintegrated neural circuits for both sounds. Altogether, we demonstrate a functional heterogeneity in the TVAs for voice decoding based on local micro-circuits.


Conflict of interest statement

The authors declare no competing interests.

Figures

Fig. 1
Fig. 1. Neural AC activity for voice and speech processing.
Contrast images were thresholded at p < 0.05 including a voxel-wise FWE correction (n = 52 human participants). White dashed outline represents the auditory region Te3. a TVA in bilateral AC for contrasting voice against non-voice sounds. Four peak locations were found in left AC, with three peaks located within the auditory region Te3 (aST, mST, pST) and one posterior to Te3 in posterior superior temporal sulcus (pSTS). Two peaks in the right AC were located inside Te3 (aST, mST) and one posterior to Te3 in pST. b Contrasting speech against non-voice sounds [Speech vs. non.voice] revealed two left AC peaks (mST, pSTS) and one right peak (mST); these peak activations were confirmed when specifically contrasting speech against nonverbal voices [speech vs. nonverbal]. c AC activity for all five conditions compared against baseline [all conditions], with specific peaks in bilateral HG that were also located inside the TVA [voice vs. non-voice]. d Violin plots for the percent signal change quantified from beta estimates for all five conditions (spe speech, nsp nonspeech/nonverbal, ani animal, art artificial, nat natural sounds) for all ROIs (built as a sphere of a 3 mm radius around peak locations); horizontal bar indicates the mean, the inner vertical indicates the first to third quantile of the data distribution.
Fig. 2
Fig. 2. DCM model space.
Model space for the DCM analysis including three conditions (all sounds, voice sounds, speech sounds). The full model included driving inputs to each node from different conditions (arrows to nodes), intrinsic connections for each node (circular arrows), bidirectional extrinsic connections between neighboring nodes (straight arrows), and modulations of connections by conditions (color of arrows). Gray shading indicates the auditory area Te3. Black regions were defined based on their activity to all sounds, blue regions were defined based on their activity in the [voice>non-voice] contrasts, and red region were defined by their activity in the [speech>nonverbal] contrast.
Fig. 3
Fig. 3. DCM effective neural network modeling.
Significant network effects (posterior probability > 0.99) in bilateral AC after a parametric empirical Bayes (PEB)-based model reduction from the full model; sample of n = 52 human participants. a Neural networks based on the effective connectivity parameters and b modulation of connections. Bold lines for positive effects, dotted lines for negative effects. Gray shading indicates the auditory area Te3.

Similar articles

Cited by

References

    1. Pernet CR, et al. The human voice areas: spatial organization and inter-individual variability in temporal and extra-temporal cortices. Neuroimage. 2015;119:164–174. doi: 10.1016/j.neuroimage.2015.06.050. - DOI - PMC - PubMed
    1. Belin P, Bodin C, Aglieri V. A ‘voice patch’ system in the primate brain for processing vocal information? Hear. Res. 2018;366:65–74. doi: 10.1016/j.heares.2018.04.010. - DOI - PubMed
    1. Agus TR, Paquette S, Suied C, Pressnitzer D, Belin P. Voice selectivity in the temporal voice area despite matched low-level acoustic cues. Sci. Rep. 2017;7:11526. doi: 10.1038/s41598-017-11684-1. - DOI - PMC - PubMed
    1. Perrodin C, Kayser C, Logothetis NK, Petkov CI. Voice cells in the primate temporal lobe. Curr. Biol. 2011;21:1408–1415. doi: 10.1016/j.cub.2011.07.028. - DOI - PMC - PubMed
    1. Aglieri V, Chaminade T, Takerkart S, Belin P. Functional connectivity within the voice perception network and its behavioural relevance. Neuroimage. 2018;183:356–365. doi: 10.1016/j.neuroimage.2018.08.011. - DOI - PMC - PubMed

Publication types