. 2021 Jun 25;4(1):788.
doi: 10.1038/s42003-021-02290-z.

p38-MAPK-mediated translation regulation during early blastocyst development is required for primitive endoderm differentiation in mice

Affiliations

p38-MAPK-mediated translation regulation during early blastocyst development is required for primitive endoderm differentiation in mice

Pablo Bora et al. Commun Biol. .

Abstract

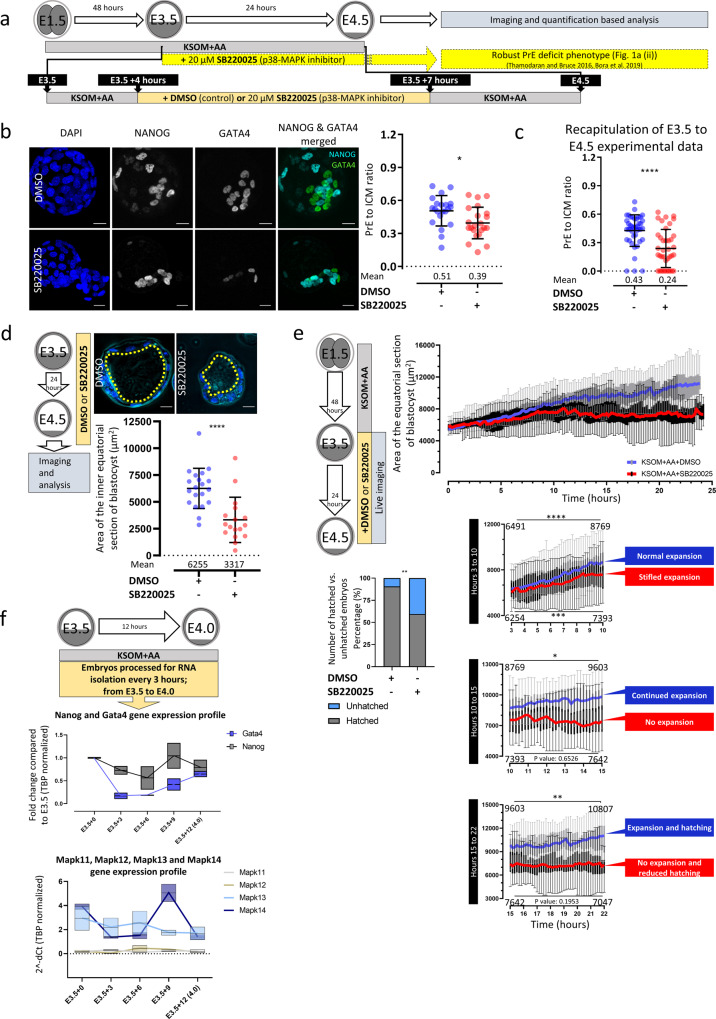
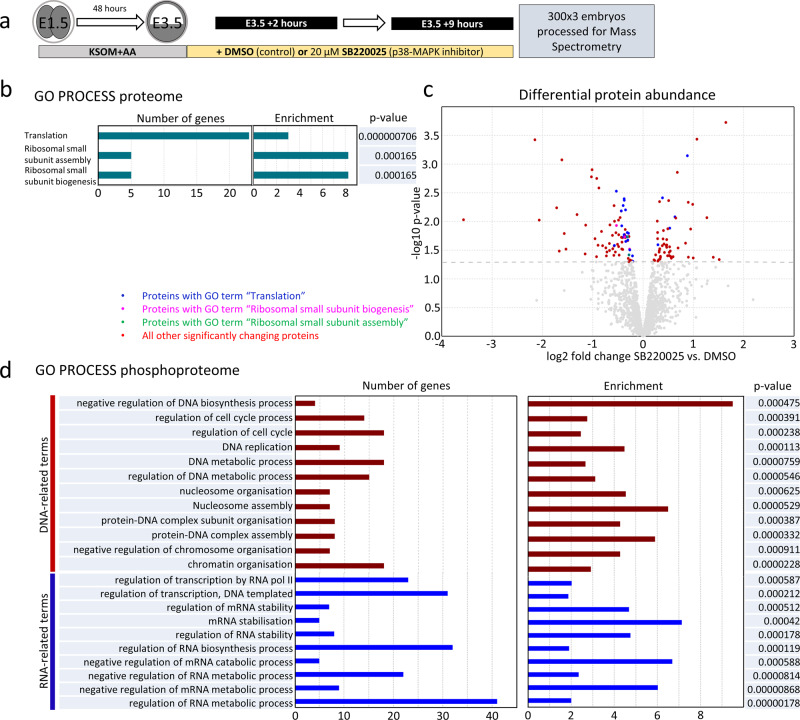
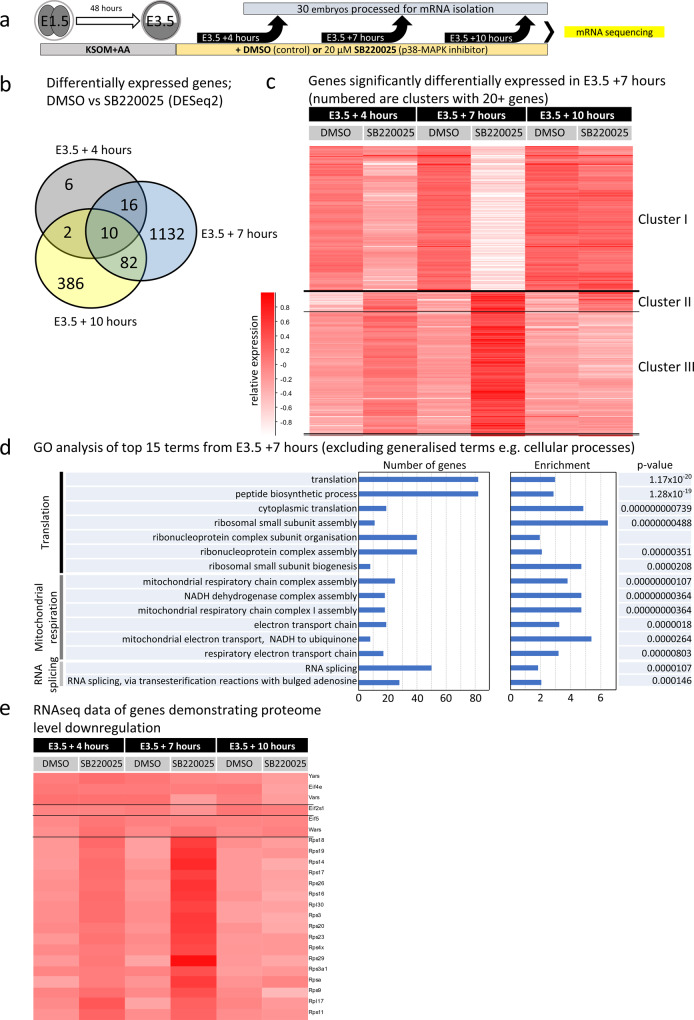
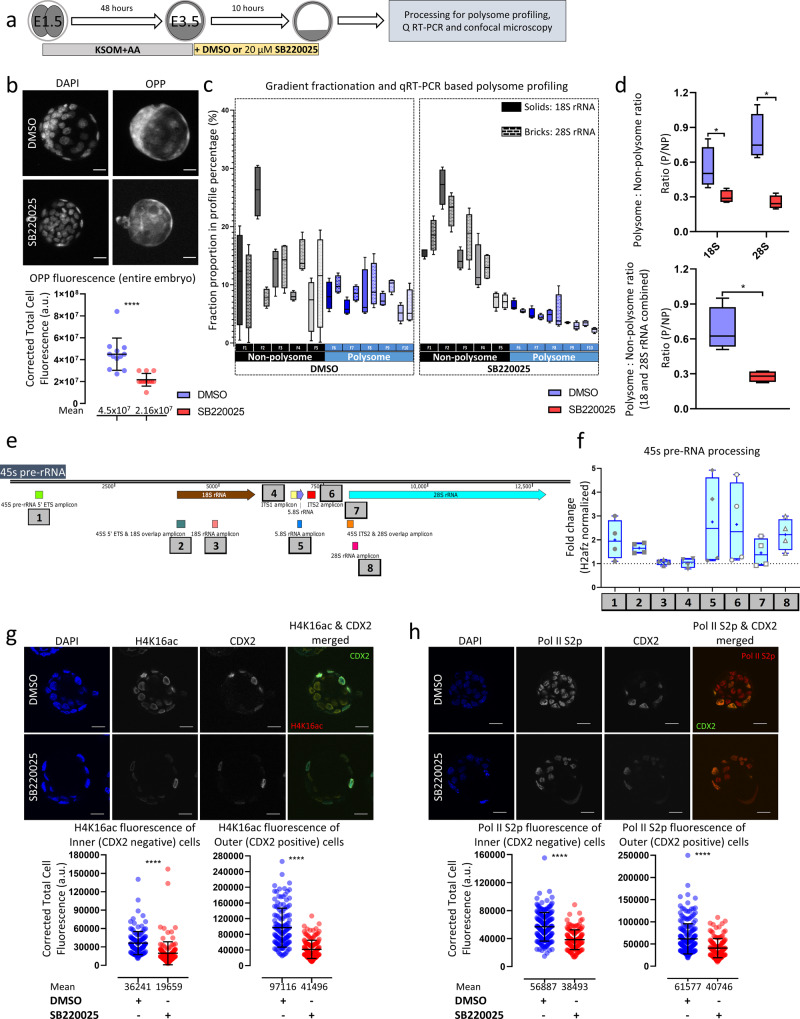
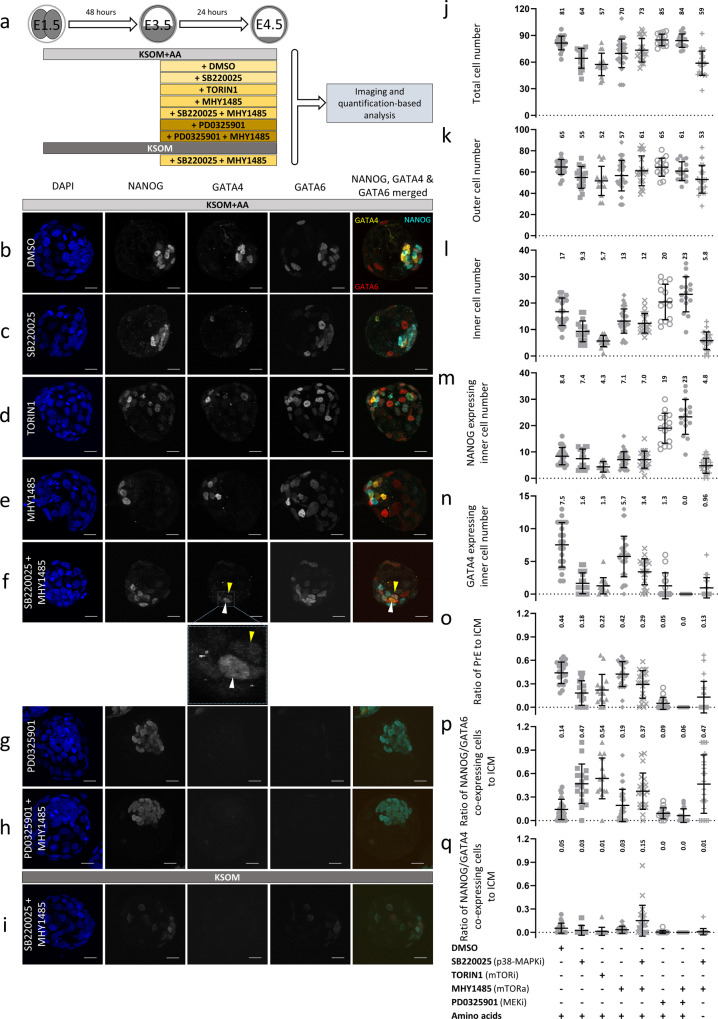
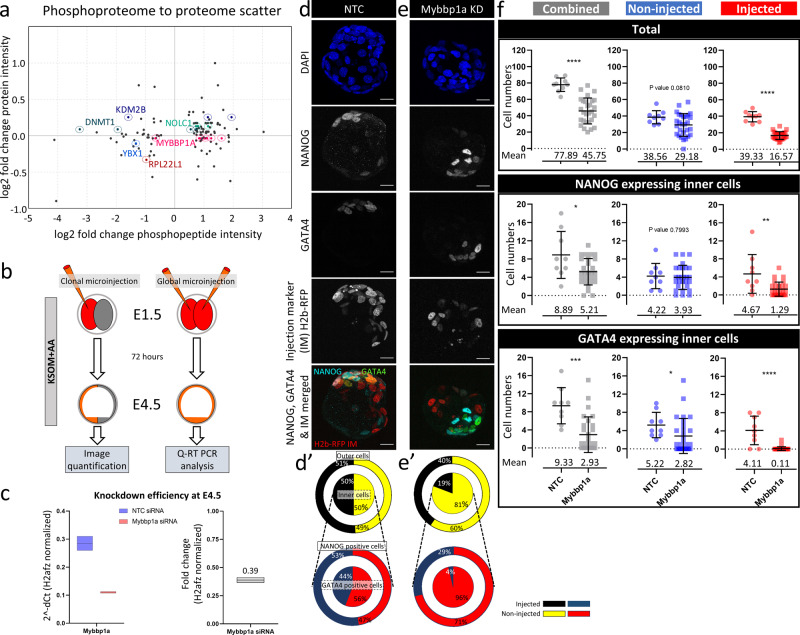
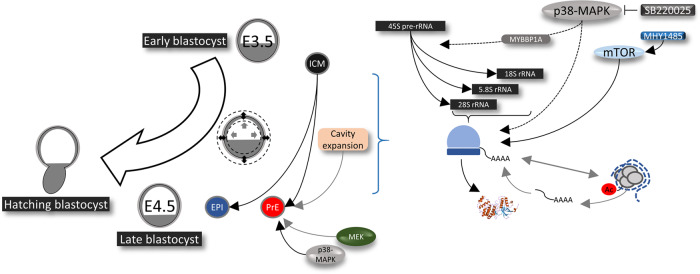
Successful specification of the two mouse blastocyst inner cell mass (ICM) lineages (the primitive endoderm (PrE) and epiblast) is a prerequisite for continued development and requires active fibroblast growth factor 4 (FGF4) signaling. Previously, we identified a role for p38 mitogen-activated protein kinases (p38-MAPKs) during PrE differentiation, but the underlying mechanisms have remained unresolved. Here, we report an early blastocyst window of p38-MAPK activity that is required to regulate ribosome-related gene expression, rRNA precursor processing, polysome formation and protein translation. We show that p38-MAPK inhibition-induced PrE phenotypes can be partially rescued by activating the translational regulator mTOR. However, similar PrE phenotypes associated with extracellular signal-regulated kinase (ERK) pathway inhibition targeting active FGF4 signaling are not affected by mTOR activation. These data indicate a specific role for p38-MAPKs in providing a permissive translational environment during mouse blastocyst PrE differentiation that is distinct from classically reported FGF4-based mechanisms.


Conflict of interest statement

The authors declare no competing interests.

Figures

Fig. 1
Fig. 1. Temporal resolution and morphological effects of inhibiting p38-MAPK signaling in developing blastocysts.
a Scheme illustrating the experimental protocol used to resolve the temporal nature of p38-MAPKi in the PrE deficit phenotype. The lineage markers NANOG and GATA4 denote EPI and PrE cells, respectively. b Quantification of the ratio of GATA4-positive PrE cells to total ICM cells in control (n = 21) and p38-MAPKi (n = 22) conditions from confocal images of E4.5 embryos transiently cultured with DMSO or SB220025 between E3.5 + 4 h and E3.5 + 7 h (right); the means and standard deviations are highlighted. Representative z-section blastocyst confocal microscopy projections are shown on the left (scale bars = 20 µm). c Quantification of the ratio of GATA4-positive PrE cells to total ICM cells in control (DMSO) (n = 42) and p38-MAPKi (SB220025) (n = 38) conditions for treatment between E3.5 and E4.5 (recapitulation of previously published observations,); the means and standard deviations are highlighted. d Quantification of the equatorial cavity areas (µm2) in fixed blastocysts cultured (E3.5-E4.5) in control (DMSO; n = 20) and p38-MAPKi (SB220025; n = 17) conditions. Representative confocal equatorial z-sections of each embryo group are shown, with the cavity circumference indicated (dashed yellow line) (upper panel scale bars = 20 µm). e Equatorial areas of control (DMSO; n = 32) and p38-MAPKi (SB220025; n = 32) blastocysts imaged in live culture from E3.5-E4.5. The sub-panels show segments of the recordings between 3 and 10 h, 10 and 15 h, and 15 and 22 h. The data are presented as box-and-whisker plots, with lines connecting the median points (blue for DMSO and red for SB220025). The numbers within the sub-panels are the mean equatorial areas. The bar graph denotes the percentages of hatching blastocysts observed at the end of the imaging period (E4.5). f qRT-PCR-derived expression levels (normalized to Tbp) of the ICM lineage markers Nanog and Gata4 (upper) and the p38-MAPK paralogous genes Mapk11-14 (lower) during early blastocyst maturation (at E3.5 + 0 h, E3.5 + 3 h, E3.5 + 6 h, E3.5 + 9 h, and E3.5 + 10 h). Data presented as box plots with the mean expression levels across the timeline expressed as line graphs.
Fig. 2
Fig. 2. Proteomic and phosphoproteomic analyses of the effects of p38-MAPKi in developing blastocysts.
a Experimental design of sample collection for control (DMSO; n = 3 (300 embryos per repeat)) and p38-MAPKi (SB220025; n = 3 (300 embryos per repeat)) blastocysts after 7 h of chemical exposure (at E3.5 + 9 h) prior to mass spectrometric analysis of the (phospho-)proteome (300 blastocysts per condition were tested in biological triplicates). b The most statistically significantly enriched GO terms for the differentially detected proteins between control and p38-MAPKi blastocysts. c Volcano plot of the detected differentially expressed proteins associated with p38-MAPKi. Proteins associated with the indicated enriched GO terms are highlighted in blue (translation), purple (ribosomal small subunit biogenesis), and green (ribosomal small subunit assembly) (note that there is overlap—see Supplementary Data 1); the proteins associated with other terms are in red, while the proteins that were not statistically significantly changed are in gray. d Statistically significantly enriched GO terms for the differentially detected phosphopeptides between control and p38-MAPKi blastocysts.
Fig. 3
Fig. 3. Temporal transcriptomic analysis of the effects of p38-MAPKi during early blastocyst maturation.
a Experimental design for transcriptome sample collection for the control (DMSO) and p38-MAPKi (SB220025) conditions from E3.5 to +4, +7, or +10 h (biological duplicates of 30 blastocysts per condition were tested per time point). b Venn diagram showing the numbers of differentially expressed mRNAs (as determined by DESeq2 analysis) and their overlap between control and p38-MAPKi blastocysts at the three selected time points (i.e., E3.5 + 4 h, +7 h, and +10 h). c Hierarchical clustering heatmap depicting the expression of mRNAs that were significantly changed by p38-MAPKi at the +7 h time point and the transcript levels of those same genes at the +4 and +10 h time points. The mRNAs formed three distinct expression clusters. d Top 15 terms identified in GO enrichment analysis for the p38-MAPK-regulated transcriptome at the +7 h time-point (excluding generalized terms, e.g., cell). e Hierarchical clustering heatmap of genes originally identified as downregulated at the protein level and associated with translation-related GO terms after p38-MAPKi (Fig. 2b, c) at the three assayed early blastocyst ±p38-MAPKi time points.
Fig. 4
Fig. 4. Effects of p38-MAPKi on active translation, rRNA processing, and the transcriptional landscape in developing blastocysts.
a Experimental design for analysis of the roles of p38-MAPK activity in developmental translation and transcription in maturing blastocysts (between E3.5 and E3.5 + 10 h). b Representative confocal z-projection micrographs (upper) of E3.5 + 10 h blastocysts in control (DMSO; n = 12) and p38-MAPKi (SB220025; n = 12) conditions depicting cell nuclear staining (DAPI) and de novo translation (after OPP incorporation); scale bar = 20 µm. The scatterplot shows the corrected total cell fluorescence (CTCFs) of OPP incorporation between the two conditions (lower); the means and standard deviations are highlighted. c qRT-PCR analyses quantifying 18S and 28S rRNA levels in each of ten SSP profiling fractions representative of polysome-associated (F6-F10) and non-polysome-associated (F1-F5) rRNA transcripts obtained from both control and p38-MAPKi blastocysts (E3.5 + 10 h). Box-and-whisker plots represent the proportion of the overall amount of rRNA transcript detected for a given fraction. The data were generated from four sets of 10 embryos each, per condition. d Ratios of polysome- to non-polysome-quantified rRNAs (as derived from the data in c) for 18S and 28S separately (top panel) and combined (bottom panel). The data are presented in interleaved box-and-whisker plots, with the whiskers depicting the minimum and maximum values and the boxes including the medians and the 25th and 75th percentiles. e Schematic representation of 45S pre-rRNA highlighting the qRT-PCR amplicons assayed and quantified to analyze rRNA processing status ±p38-MAPKi (E3.5 + 10 h). f Box-and-whisker plots (25th to 75th percentile in box and minimum and maximum values indicated by whiskers, with median and mean values marked by a horizontal bar and + sign, respectively; n = 4) representing qRT-PCR-quantified fold-changes of the different specific amplicons (normalized against H2afz cDNA) in p38-MAPKi versus control blastocysts (DMSO). g Representative single z-stack confocal micrographs (upper) of E3.5 + 10 h blastocysts under control (DMSO; n = 13 embryos) and p38-MAPKi (SB220025; n = 15 embryos) conditions. Individual channel micrographs for DAPI (blue pan-nuclear stain; shows the total number of cells), H4K16ac (grayscale; a posttranslational histone chromatin mark associated with transcriptional activity), and CDX2 (grayscale; marks outer TE cells) plus a merged H4K16ac (red) and CDX2 (green) image are shown (scale bar = 20 μm). Scatterplots (lower) quantifying the H4K16ac (CTCF) level per nucleus in control (DMSO) and p38-MAPKi (SB220025) blastocysts differentiated between inner (n = 129 for DMSO and n = 143 for SB220025) and outer (n = 136 for DMSO and n = 145 for SB220025) cell populations are also shown; the means and standard deviations are depicted. h Similar to g but describes the expression levels of the RNA pol II S2p protein. Quantification was performed for inner cells (n = 187 for DMSO and n = 135 for SB220025) and outer cells (n = 209 for DMSO and n = 123 for SB220025) from n = 11 embryos in DMSO and n = 14 embryos in SB220025 conditions, with the means and standard deviations shown.
Fig. 5
Fig. 5. Functional interplay between mTOR and p38-MAPK during blastocyst maturation and PrE differentiation.
a Experimental schematic for analysis of the potential functional overlap of mTOR and p38-MAPK with regard to PrE differentiation (via assay of ICM lineage marker protein expression) during blastocyst maturation. E3.5-stage blastocysts were cultured for 24 h in medium (±AAs) containing the indicated pharmacological supplements (vehicle control: DMSO; p38-MAPK inhibitor: SB220025; mTOR inhibitor: TORIN1; mTOR activator: MHY1485; MEK1/2 inhibitor: PD0325901) or combinations thereof. b–i Representative confocal z-series projections of blastocysts cultured under the conditions described in a and stained with DAPI (blue) and for NANOG, GATA4, and GATA6 protein expression (cyan, yellow and red in the provided merged image); scale bar = 20 µm. b DMSO (n = 21), c p38-MAPKi, SB220025 (n = 17), d mTOR inhibition, TORIN1 (n = 15), e mTOR activation, MHY1485 (n = 32), f p38-MAPKi and mTOR activation, SB220025 + MHY1485 (n = 22), g MEK inhibition, PD0325901 (n = 15), h MEK inhibition and mTOR activation, PD0325901 + MHY1485 (n = 16) and i p38-MAPKi and mTOR activation, SB220025 + MHY1485 in KSOM not supplemented with AAs (n = 24). In f and the expanded view, the white arrowheads highlight differentiated PrE cells expressing GATA4 (and GATA6) but not NANOG, whereas the yellow arrowheads show ICM cells coexpressing GATA4 and NANOG (which were comparatively enriched in this condition). jq Scatterplots showing the total, outer and inner blastocyst cell numbers (as indicated by DAPI staining) and the numbers of NANOG-, GATA4- and GATA6-expressing ICM cells under the culture conditions described in a (with the means and standard deviations highlighted). j Total cells; k outer cells; l inner cells; m NANOG-expressing inner cells; n GATA4-expressing inner cells; o the ratio of GATA4-positive, NANOG-negative PrE cells to total ICM cells; p the ratio of NANOG- and GATA6-coexpressing cells to total ICM cells; and q the ratio of NANOG- and GATA4-coexpressing cells to total ICM cells.
Fig. 6
Fig. 6. Analysis of the role of MYBBP1A (a candidate target of p38-MAPK activity) in preimplantation embryonic development and ICM cell fate specification.
a Phosphoproteome-to-proteome scatterplot for MS-detected peptides demonstrating <1.3-fold differences in abundance in the general proteome and >1.5-fold changes in phosphorylation levels. Candidates of interest (based on literature research; e.g., MYBBP1A), are highlighted (and were assayed for PrE phenotypes in clonal siRNA microinjection-mediated loss-of-function assays—cf, Supplementary Fig. 4, and Supplementary Data 2). b Experimental design for analysis of the efficiency of siRNA-mediated Mybbp1a gene mRNA knockdown in microinjected embryos cultured to the equivalent late blastocyst (E4.5) stage (qRT-PCR analysis) and for analysis of the contributions of marked Mybbp1a-knockdown clones to late blastocyst cell lineages (Lineage quantification). c Comparison of qRT-PCR-derived relative Mybbp1a transcript levels (normalized to H2afz mRNA levels) between embryos injected with non-targeting control (NTC) siRNA and embryos injected with siRNA specific for Mybbp1a mRNA. Mybbp1a expression levels between control (blue) and Mybbp1a specific siRNA (red) injected embryos expressed as box plots, alongside fold-change. d Confocal micrograph z-projections of representative late (E4.5)-stage blastocysts initially microinjected (in one blastomere at the 2-cell stage) with NTC siRNA (n = 9) plus recombinant H2b-RFP fluorescent reporter mRNA (identifying the clonal progeny of the injected cell). Individual DAPI (blue pan-nuclear stain; indicates the total number of cells), NANOG (grayscale; EPI cells) and GATA4 (grayscale; PrE cells) channel micrographs, plus merged NANOG (cyan), GATA4 (green), and H2B-RFP (microinjected clone) images, are shown (scale bar = 20 μm). d′ Target diagrams describing the average percentage contributions of NTC siRNA-microinjected and non-microinjected clones to either outer and inner cell populations (black and yellow targets) or mutually exclusive NANOG- and GATA4-expressing ICM cell lineages (red and blue targets). e Similar to d. e′ is similar to d′, but the results were obtained after microinjection of Mybbpa1-specific siRNA (n = 28). f Scatterplots describing the contributions of non-microinjected (blue) and microinjected (red) cell clones (plus the combined number—gray) of NTC/Mybbp1a siRNA-treated embryos to the total cell count, number of inner cells expressing NANOG only, and number of inner cells expressing GATA4 only. The means and standard deviations are highlighted.
Fig. 7
Fig. 7. Working model of the role of p38-MAPK in regulating protein translation to prime PrE differentiation during preimplantation-stage blastocyst maturation.
During the period of blastocyst maturation (E3.5 to E4.5), p38-MAPKs, potentially acting via MYBBP1A, enable pre-rRNA processing and regulates global translational and co-transcriptional events, which is necessary for normal development and PrE specification. p38-MAPKs appear to be acting upstream of mTOR, towards a pathway supporting PrE survival in the maturing blastocyst.

Similar articles

Cited by

References

    1. Chazaud C, Yamanaka Y. Lineage specification in the mouse preimplantation embryo. Development. 2016;143:1063–1074. doi: 10.1242/dev.128314. - DOI - PubMed
    1. Płusa B, Piliszek A. Common principles of early mammalian embryo self-organisation. Development. 2020;147:dev183079. doi: 10.1242/dev.183079. - DOI - PubMed
    1. Shahbazi, M. N. Mechanisms of human embryo development: from cell fate to tissue shape and back. Development147, dev190629 (2020). - PMC - PubMed
    1. Molotkov A, Mazot P, Brewer JR, Cinalli RM, Soriano P. Distinct requirements for FGFR1 and FGFR2 in primitive endoderm development and exit from pluripotency. Dev. Cell. 2017;41:511–526.e4. doi: 10.1016/j.devcel.2017.05.004. - DOI - PMC - PubMed
    1. Kang M, Garg V, Hadjantonakis AK. Lineage establishment and progression within the inner cell mass of the mouse blastocyst requires FGFR1 and FGFR2. Dev. Cell. 2017;41:496–510.e5. doi: 10.1016/j.devcel.2017.05.003. - DOI - PMC - PubMed

Publication types

MeSH terms