. 2022 Jan;36(1):236-247.
doi: 10.1038/s41375-021-01327-w. Epub 2021 Jun 25.

Preclinical evaluation of eltrombopag in a PDX model of myelodysplastic syndromes

Affiliations

Preclinical evaluation of eltrombopag in a PDX model of myelodysplastic syndromes

Nanni Schmitt et al. Leukemia. 2022 Jan.

Abstract

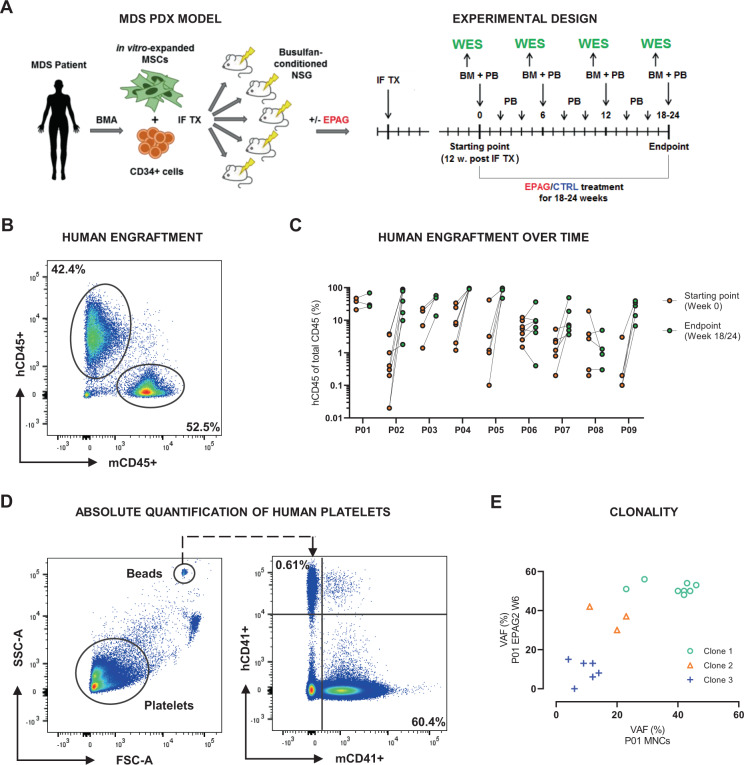
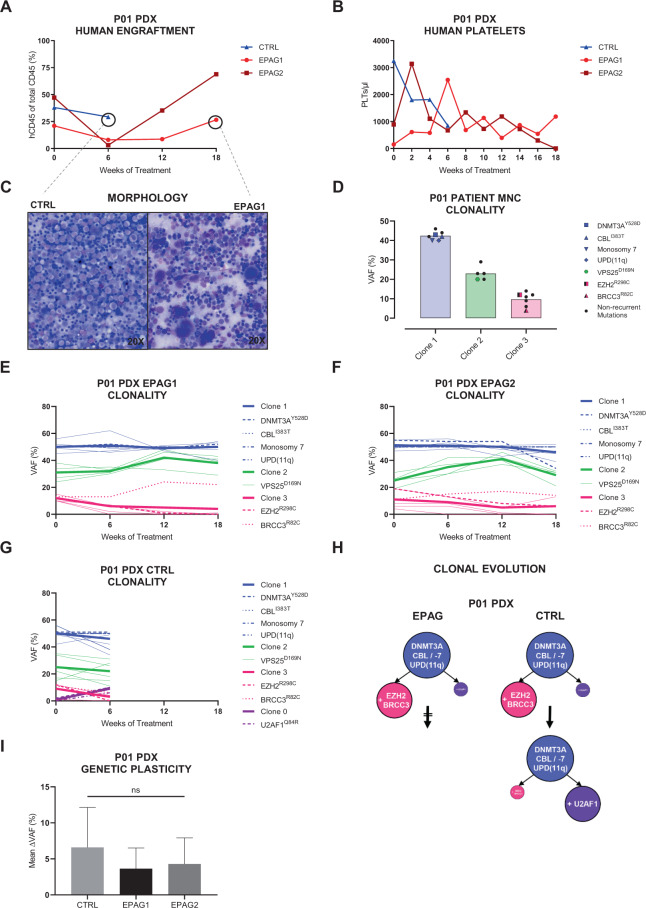
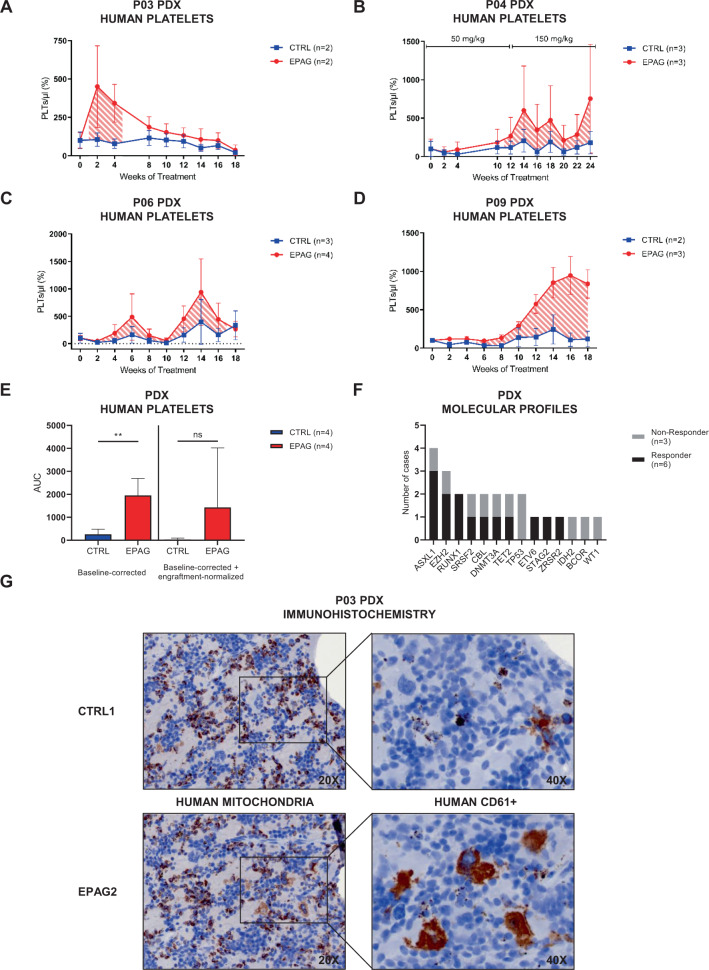
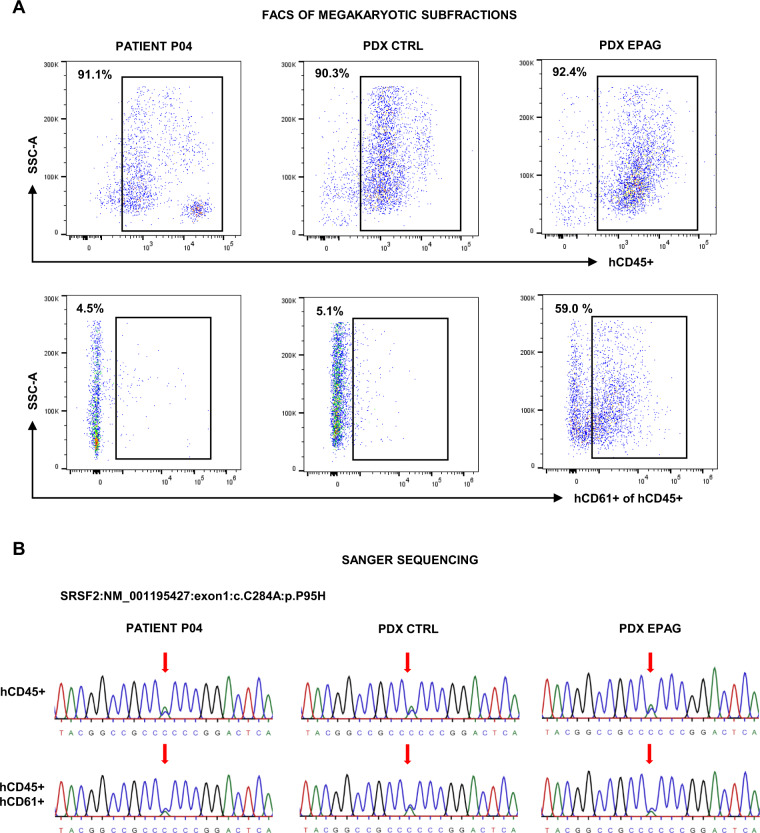
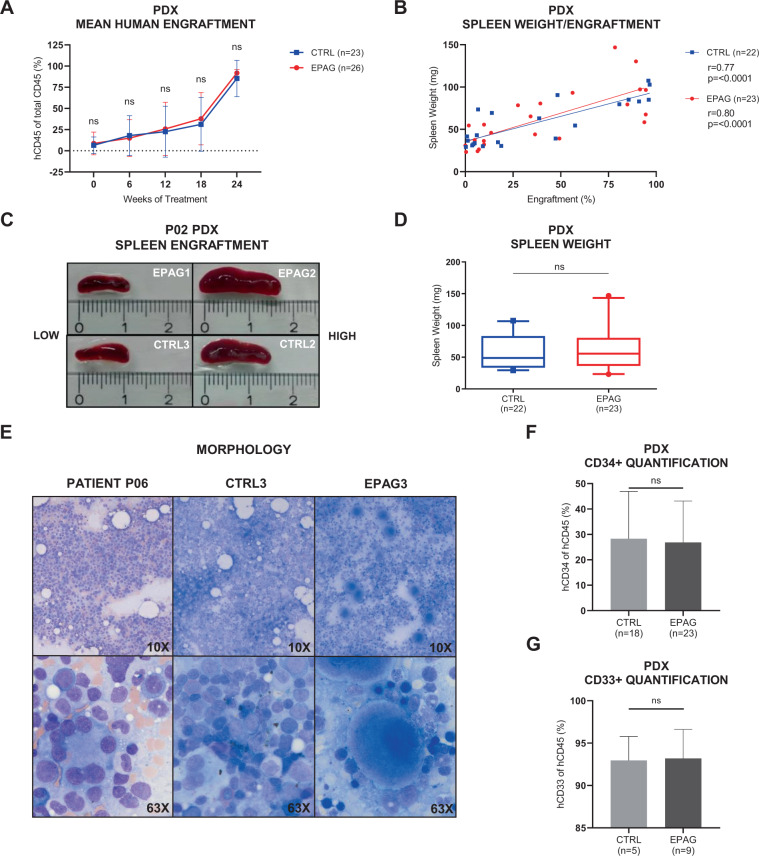
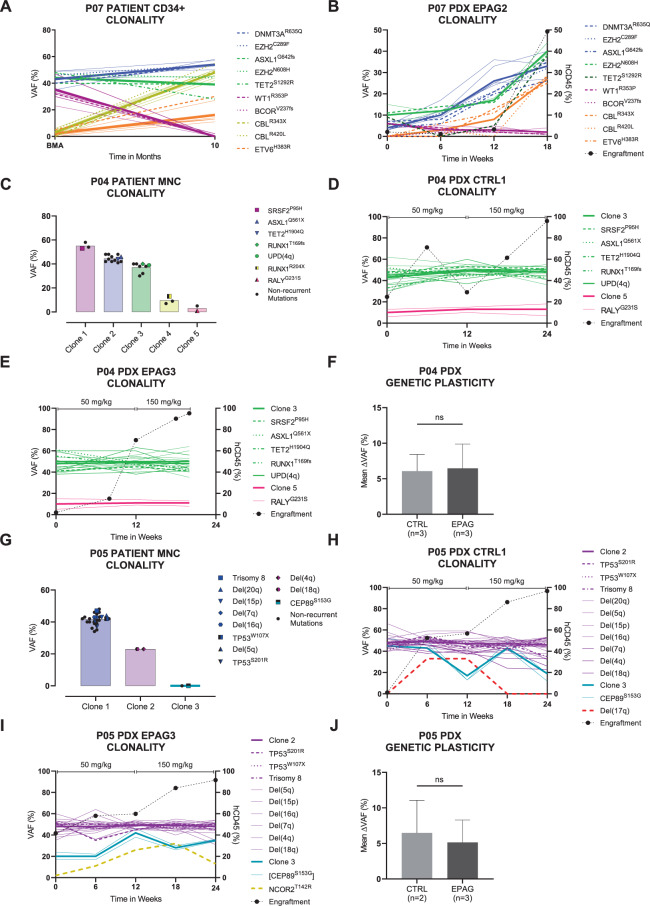
Preclinical research of myelodysplastic syndromes (MDSs) is hampered by a lack of feasible disease models. Previously, we have established a robust patient-derived xenograft (PDX) model for MDS. Here we demonstrate for the first time that this model is applicable as a preclinical platform to address pending clinical questions by interrogating the efficacy and safety of the thrombopoietin receptor agonist eltrombopag. Our preclinical study included n = 49 xenografts generated from n = 9 MDS patient samples. Substance efficacy was evidenced by FACS-based human platelet quantification and clonal bone marrow evolution was reconstructed by serial whole-exome sequencing of the PDX samples. In contrast to clinical trials in humans, this experimental setup allowed vehicle- and replicate-controlled analyses on a patient-individual level deciphering substance-specific effects from natural disease progression. We found that eltrombopag effectively stimulated thrombopoiesis in MDS PDX without adversely affecting the patients' clonal composition. In conclusion, our MDS PDX model is a useful tool for testing new therapeutic concepts in MDS preceding clinical trials.


Conflict of interest statement

D.N. received research funding from Novartis Pharma GmbH. All other authors declare no conflict of interest.

Figures

Fig. 1
Fig. 1. Experimental setup and readouts for preclinical assessment of EPAG using a MDS patient-derived xenograft model.
A Schematic experimental setup. CD34+ cells and mesenchymal stromal cells (MSCs) derived from bone marrow aspirations (BMAs) of MDS patients were injected into Busulfan-conditioned NSG mice by bilateral intrafemoral transplantation (IF TX). Long-term engraftment was determined 12 weeks post transplant. Mice with positive human engraftment subsequently received oral treatment of eltrombopag (EPAG) or vehicle control (CTRL) for 18–24 weeks until endpoint. Starting with treatment, peripheral blood (PB) and BM were sampled every 2 and 6 weeks, respectively. B Representative flow cytometry plot showing percentage of human CD45+ (hCD45+) and mouse CD45+ (mCD45+) cells in the BM of patient-derived xenografts (PDXs). Human engraftment was defined as percentage of hCD45+ of total CD45+ cells. C Comparison of engraftment rates between patients’ PDX at starting (orange) and endpoint (green). On the x-axis, patient IDs are shown. D Representative flow cytometry plots showing gating scheme for platelets (PLTs) and beads (left), and percentage of hCD41+ and mCD41+ PLTs in PB of PDX (right). The absolute number of human PLTs per microliter PB was calculated in relation to the number of beads recorded. E Exemplary clustering of variant allele frequencies (VAFs) of mutations and copy number variations into different subclones using the bioinformatic tool SciClone. FSC-A, forward scatter area; SSC-A, side scatter area.
Fig. 2
Fig. 2. Exemplary complete overview of comprehensive clinical and molecular readouts of patient P01 and its xenografts.
Of n = 3 xenografts, n = 2 were treated with eltrombopag (EPAG1 + 2, red) and n = 1 received vehicle control (CTRL, blue). CTRL mouse had to be killed 6 weeks into treatment phase due to excessive weight loss (see Supplementary Fig. S3). A Percentage of human engraftment in the bone marrow (BM) of xenografts throughout 18 weeks of treatment. Engraftment was assessed every 6 weeks. B Course of human platelets (PLTs) in the peripheral blood of xenografts during treatment phase. PLTs were analyzed every 2 weeks. C BM smears of CTRL (left) and EPAG1 (right) at endpoint stained with May–Grünwald–Giemsa stain (magnification ×20). D Mutational variant allele frequencies (VAFs) of primary mononuclear cell (MNC) sample of patient P01. Each bar represents one individual clone. Non-synonymous mutations are displayed with their superscripted respective amino acid change. EG VAFs of patient-specific mutations in the course of treatment detected in the BM of EPAG1, EPAG2, and CTRL, respectively. Mutations were separated into different subclones using the bioinformatic tool SciClone. MDS-associated molecular lesions are highlighted. Thicker lines represent the mean value of the respective clone. H Reconstruction of differential clonal evolution in the xenografts of P01 for both treatment groups. I Mean deltaVAF of EPAG1, EPAG2, and CTRL determined from all identified somatic mutations for any two consecutive WES time points. Data were analyzed using one-way ANOVA and are represented as mean ± SD. ns, not significant.
Fig. 3
Fig. 3. Increased thrombo- and megakaryopoiesis in EPAG-treated MDS patient-derived xenografts.
AD Mean baseline-corrected number of human platelets (PLTs) in the course of 18–24 weeks of treatment for groups of eltrombopag- (EPAG, red) and vehicle-treated (CTRL, blue) xenografted mice of P03, P04, P06, and P09. Striped areas indicate response to EPAG defined as two-fold change of PLT production. Initial number of PLTs for each mouse was taken as individual baseline. Peripheral blood (PB) was sampled biweekly, unless otherwise indicated. The absolute number of human PLTs per microliter PB was calculated in relation to the number of beads recorded. For P04, dose was escalated after 12 weeks from 50 to 150 mg/kg for additional 12 weeks. See also Supplementary Fig. S4A, B for data on additional cases. E Area under the curve (AUC) values for graphs AD and mean baseline-corrected engraftment-normalized data (not shown). Data were analyzed using unpaired, two-tailed t-test. F Comparison of MDS-related mutations between xenograft non-responder and responder. See also Supplementary Fig. S4H for data on cytogenetic aberrations. G Serial paraffin sections from CTRL1 and EPAG2 of P03 were stained for human mitochondria and CD45+ CD61+ megakaryocytes using immunohistochemistry (magnification ×20 and ×40). Data in AE are represented as mean ± SD. **p < 0.01.
Fig. 4
Fig. 4. EPAG stimulates human CD45+ CD61+ MDS and not residual healthy megakaryopoiesis in patient-derived xenografts.
A FACS plots showing sorting gates and percentage (top left corner) of human CD45+ (hCD45+) and hCD45+ hCD61+ cells in the mononuclear cells of patient P04 and pooled bone marrow samples from n = 3 CTRL and n = 3 EPAG patient-derived xenografts (PDX) at endpoint. B Sanger sequencing results of PCR-amplified DNA from sorted hCD45+ and hCD45+ hCD61+ cells of patient P04, as well as CTRL and EPAG PDX for the patient’s MDS-specific mutation SRSF2P95H. Red arrow indicates the side of mutation where cytosine (C, blue) was replaced by adenine (A, green). Results for the remaining patient–individual mutations are shown in Supplementary Fig. S6A–C. SSC-A, side scatter area.
Fig. 5
Fig. 5. EPAG treatment does not promote progression or transformation in MDS patient-derived xenografts compared to vehicle control.
A Human engraftment in the bone marrow (BM) for groups of n = 26 eltrombopag- (EPAG, red) and n = 23 vehicle-treated (CTRL, blue) patient-derived xenografts (PDX) in the course of 18–24 weeks of treatment. Engraftment was assessed every 6 weeks. Individual results for each patient are shown in Supplementary Fig. S7A–H. B Correlation between engraftment and spleen weight in PDX of CTRL (r = 0.77, p = <0.0001) and EPAG group (r = 0.80, p = <0.0001), respectively. Linear regression analysis was performed using Prism 8 (GraphPad Software) and Spearman’s correlation coefficient was computed. See also Supplementary Fig. S7I for data on correlation between engraftment and spleen size. C Pictures of spleens from patient P02’s PDX with low (EPAG1+CTRL3, left) and high engraftment (EPAG2+CTRL2, right). D Spleen weight of all PDX from all patients for groups of n = 23 EPAG and n = 22 vehicle treatment. Data were analyzed using two-tailed Mann–Whitney U-test. Whiskers indicate 5–95% percentile. See also Supplementary Fig. S7J for data on spleen size. E BM smears of patient P06 (left) and its PDX CTRL3 (middle) and EPAG3 (right) at endpoint stained with May–Grünwald–Giemsa stain (magnification ×10 and ×63). F Percentage of human CD45+ CD34 cells in the BM of n = 23 EPAG- and n = 18 vehicle-treated PDX at endpoint. G Percentage of human CD45+CD33 cells in the BM of n = 9 EPAG- and n = 5 vehicle-treated PDX at endpoint. Data in A, F, and G are represented as mean ± SD. ns, not significant.
Fig. 6
Fig. 6. EPAG treatment does not affect clonal evolution in MDS patient-derived xenografts compared to vehicle control.
Bone marrow clonality of patients and exemplary xenografts during 18–24 weeks of experiment reconstructed by clustering of variant allele frequencies (VAFs) using the bioinformatic tool SciClone. Mutations within the same clone are equally colored. Thicker lines represent the mean clonal VAF. Non-synonymous mutations are displayed with superscripted amino acid change. Dotted black line describes the course of human engraftment. See also Supplementary Fig. S8A–Z for additional data. A, B VAFs of patient P07’s CD34+ cells in the course of 10 months and human CD45+ (hCD45+) cells from EPAG2. CE VAFs of patient P04’s mononuclear cells (MNCs) and hCD45+ cells from CTRL1 and EPAG3. Dose was escalated after 12 weeks from 50 to 150 mg/kg. EPAG3 had to be eliminated after 20 weeks due to excessive weight loss. F Total mean deltaVAF of P04’s n = 3 CTRL and n = 3 EPAG xenografts. GI VAFs of patient P05’s MNCs and hCD45+ cells from CTRL1 and EPAG3. Dose was escalated after 12 weeks from 50 to 150 mg/kg. J Total mean deltaVAF of P05’s n = 2 CTRL and n = 3 EPAG xenografts. Data in F and J were analyzed using unpaired, two-tailed t-test and is represented as mean ± SD. ns, not significant; EPAG, eltrombopag; BMA, bone marrow aspiration.

References

    1. Cazzola M. Myelodysplastic syndromes. N. Engl J Med. 2020;383:1358–74. doi: 10.1056/NEJMra1904794. - DOI - PubMed
    1. Ogawa S. Genetics of MDS. Blood. 2019;133:1049–59. doi: 10.1182/blood-2018-10-844621. - DOI - PMC - PubMed
    1. Medyouf H, Mossner M, Jann J-C, Nolte F, Raffel S, Herrmann C, et al. Myelodysplastic cells in patients reprogram mesenchymal stromal cells to establish a transplantable stem cell niche disease unit. Cell Stem Cell. 2014;14:824–37. doi: 10.1016/j.stem.2014.02.014. - DOI - PubMed
    1. Gbyli R, Song Y, Halene S. Humanized mice as preclinical models for myeloid malignancies. Biochem Pharm. 2020;174:113794. doi: 10.1016/j.bcp.2020.113794. - DOI - PubMed
    1. Côme C, Balhuizen A, Bonnet D, Porse BT. Myelodysplastic syndrome patient-derived xenografts: from no options to many. Haematologica. 2020;105:864–9. doi: 10.3324/haematol.2019.233320. - DOI - PMC - PubMed

Publication types