. 2021 Aug;40(31):4967-4979.
doi: 10.1038/s41388-021-01792-8. Epub 2021 Jun 25.

Innovative dual system approach for selective eradication of cancer cells using viral-based delivery of natural bacterial toxin-antitoxin system

Affiliations

Innovative dual system approach for selective eradication of cancer cells using viral-based delivery of natural bacterial toxin-antitoxin system

Shiran Shapira et al. Oncogene. 2021 Aug.

Abstract

The inactivation of p53, a tumor suppressor, and the activation of the RAS oncogene are the most frequent genetic alterations in cancer. We have shown that a unique E. coli MazF-MazE toxin-antitoxin (TA) system can be used for selective and effective eradication of RAS-mutated cancer cells. This out of the box strategy holds great promise for effective cancer treatment and management. We provide proof of concept for a novel platform to selectively eradicate cancer cells using an adenoviral delivery system based on the adjusted natural bacterial system. We generated adenoviral vectors carrying the mazF toxin (pAdEasy-Py4-SV40mP-mCherry-MazF) and the antitoxin mazE (pAdEasy-RGC-SV40mP-MazE-IRES-GFP) under the regulation of RAS and p53, resp. The control vector carries the toxin without the RAS-responsive element (pAdEasy-ΔPy4-SV40mP-mCherry-MazF). In vitro, the mazF-mazE TA system (Py4-SV40mP-mCherry-MazF+RGC-SV40mP-MazE-IRES-GFP) induced massive, dose-dependent cell death, at 69% compared to 19% for the control vector, in a co-infected HCT116 cell line. In vivo, the system caused significant tumor growth inhibition of HCT116 (KRASmut/p53mut) tumors at 73 and 65% compared to PBS and ΔPY4 control groups, resp. In addition, we demonstrate 65% tumor growth inhibition in HCT116 (KRASmut/p53wt) cells, compared to the other two control groups, indicating a contribution of the antitoxin in blocking system leakage in WT RAS cells. These data provide evidence of the feasibility of using mutations in the p53 and RAS pathway to efficiently kill cancer cells. The platform, through its combination of the antitoxin (mazE) with the toxin (mazF), provides effective protection of normal cells from basal low activity or leakage of mazF.


Conflict of interest statement

The authors declare no competing interests.

Figures

Fig. 1
Fig. 1. Schematic illustration of the toxin–antitoxin system.
A Three adenovirus vectors were engineered: (i) mazF under the regulation of the RRE; (ii) mazE under the regulation of P53-responsive element; and (iii) control vector where the RRE was completely removed. B Model of the dual system-based mode of action in malignant and normal cells.
Fig. 2
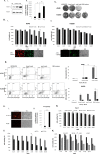
Fig. 2. Eradication of R1 cells by recombinant toxin and antitoxin adenoviruses.
A 1 × 104 cells/well R1 cells were seeded onto 96-well plates and median dilutions of the toxin or the control viruses starting from an MOI of 15 were added to the cells. Cell survival was measured by the enzymatic MTT assay 72 h after infection and average values of triplicates from representative experiments were plotted. B Cells were treated with median dilutions of the mazEF or the ΔPY4-mazF-mazE control viruses as described above, starting from an MOI of 15. Cell survival was measured by the enzymatic MTT assay. C 5 × 104 R1 cells/well were seeded onto six-well plates. On the next day, cells were co-transfected with 1 μg of the PY4-luciferase (i) or RGC-luciferase (ii) and 0.1 μg of Renilla luciferase plasmids. The luciferase levels were measured using the luciferase assay system (Promega) and normalized to the Renilla luciferase activity. D 5 × 104 cells/well R1 cells were seeded onto six-well plates and co-infected mazEF or ΔPY4-mazF-mazE control viruses at an MOI of 7.5. Expression levels of the toxin (represented by the mCherry protein) and the antitoxin (represented by the GFP protein) were validated by western blot analysis. E Light and fluorescence microscopic examination of the infected cells at an MOI of 7.5.
Fig. 3
Fig. 3. Eradication of CRC cells by mazEF-encoded adenoviruses.
A 1 × 104 cells/well HCT116+/+ (i) or HCT116−/− (ii) cells were seeded onto 96-well plates and median dilutions of the mazEF or the ΔPY4-mazF-mazE control viruses were added to the cells, starting from an MOI of 15. Cell survival was measured by the enzymatic MTT assay 72 h after the infection and average values of triplicates, from representative experiment, were plotted. B 1 × 105 cells/well were seeded onto 12-well plates. After 24 h, the cells were co-infected with mazEF or the ΔPY4-mazF-mazE control viruses at a 1:0.1 ratio and at an MOI of 7.5 for 72 h. Cell death was measured by flow cytometry after staining with Annexin V and DAPI dyes. C 5 × 105 cells/well HCT116+/+ (i) or HCT116−/− (ii) cells were seeded onto six-well plates and subsequently were co-infected with mazEF or the ΔPY4-mazF-mazE control viruses at a 1:0.1 ratio and at an MOI of 7.5, or left uninfected. After 7 h, cells were trypsinized, seeded at threefold dilutions, and subsequently incubated for 7 days. Surviving colonies were stained with 0.02% (v/v) crystal violet.
Fig. 4
Fig. 4. Finetuning of toxin–antitoxin dual system.
A 1 × 104 HCT116+/+ (i) or HCT116−/− (ii) cells were seeded onto 96-well plates and median dilutions of the toxin–antitoxin or the control-antitoxin viruses, in three ratios (2:1, 4:1, and 10:1), were added to the cells, starting from 15 MOI on the next day. Cell survival was measured by the enzymatic MTT assay 72 h post infection and average values of three technical and two biological repeats are plotted. B Light and fluorescence microscopic examination of the co-infected HCT116+/+ and HCT116−/− cells with toxin–antitoxin or control-antitoxin viruses at an MOI of 7.5. C 0.5 × 105 cells/well HCT116+/+ (i) or HCT116−/− (ii) cells were seeded onto six-well plates. On the next day, the cells were co-transfected with 1 μg of the RGC-luciferase and 0.1 μg of Renila luciferase plasmids. The luciferase levels were measured using the luciferase assay system and normalized to the Renila luciferase activity.
Fig. 5
Fig. 5. Eradication of lung cancer cells by recombinant toxin and antitoxin adenoviruses.
A (i) 0.5 × 105 cells/well H1299, A549, or T24 cells were seeded onto six-well plates. On the next day, the cells were co-infected with toxin–antitoxin or control-antitoxin constructs, at a 1:0.1 ratio and at an MOI of 7.5. Expression levels of the toxin (represented by the mCherry protein) and the antitoxin (represented by the GFP protein) were validated by western blot analysis. (ii) 0.5 × 105 cells/well H1299, A549, and T24 cells were seeded onto six-well plates. On the next day the cells were co-transfected with 1 μg of the PY4-luciferase and 0.1 μg of Renila luciferase plasmids. The luciferase levels were measured and normalized to the Renila luciferase activity. B 1 × 104 cells/well A549 (i) or H1650 (ii) cells were seeded onto 96-well plates, and median dilutions of the toxin–antitoxin or the control-antitoxin viruses, at a ratio of 1:0.1, were added to the cells, starting from an MOI of 15 on the next day. Cell survival was measured by the enzymatic MTT assay 72 h post infection. C 0.5 × 106 cells/well A549 and H1650 cells were seeded onto six-well plates and subsequently co-infected with the toxin–antitoxin or the control-antitoxin viruses at a 1:0.1 ratio and at an MOI of 7.5, or left uninfected. After 7 h, the cells were trypsinized and seeded at threefold dilutions and incubated for 7 days. Surviving colonies were stained with 0.02% (v/v) crystal violet. D 1 × 105 cells/well A549 or H1650 cells were seeded onto 12-well plates. On the next day the cells were co-infected with the toxin–antitoxin or the control-antitoxin viruses in 1:0.1 ratio at an MOI of 7.5 for 72 h. Cell death was measured by FACS analysis after staining with Annexin V and DAPI dyes. E Microscopic assesments of mazF and mazE expression which are represented by the mCherry and GFP, respectively. F Luciferase levels were measured using the luciferase assay system and normalized to the Renila luciferase activity in HT29 and HCT116 CRC cell lines (as described above). G, H Cells were seeded in 96-well plates and median dilutions of the mazF, CMV-mCherry, mazF-mazE or ΔmazF-mazE viruses, in 10:1 ratio, were added to the cells, starting from an MOI of 30 on the next day. Cell viability was measured by the enzymatic MTT assay 72 hours post infection and 50 μg 5FU exposure. An average value of three technical and two biological repeats (mean ± SD) are plotted. Statistical significance (**p < 0.01) was calculated by two-tailed Student’s t-test.
Fig. 6
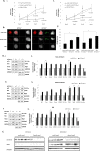
Fig. 6. Inhibition of tumor growth in vivo.
Tumors were formed in male nude mice by subcutaneous injection of 5 × 106 cells/mouse HCT116+/+ or HCT116−/− cells. Animals were treated with two toxin–antitoxin, control-antitoxin (2 × 109–2 × 108 PFU/mouse), or PBS, followed by intraperitoneal injection of 30 mg/kg 5FU. A Tumor size fold change normalized to initial tumor size at four time points in HCT116−/− (i) and HCT116+/+ (ii) cells. The mean fold change values for each group are shown, and the standard deviation is represented by error bars for each measurement. The p values for the toxin–antitoxin group and control-antitoxin group compared to the PBS group are shown. Each bar represents the mean ± SD of a set of data determined from five mice. B Imaging was performed on fixed tumor sections with the Maestro imaging device. The red fluorescence dye represents the expression of the toxin and the green fluorescence dye represents the expression of the antitoxin. C Actual tumor weight was measured. D P53-dependent transcriptional activation following 5FU induction was validated by RT-PCR analysis of canonical target genes. Up- or down-regulation of canonical target genes was compared between HCT116+/+ and HCT116−/− derived tumors in all treatment groups. E Expression levels of the toxin (represented by the mCherry protein) and the antitoxin (represented by the GFP protein) in the tumors were validated by western blot analysis.

Similar articles

Cited by

References

    1. Hanahan D, Weinberg RA. Hallmarks of cancer: the next generation. Cell. 2011;144:646–74. doi: 10.1016/j.cell.2011.02.013. - DOI - PubMed
    1. Lemmon MA, Schlessinger J. Cell signaling by receptor tyrosine kinases. Cell. 2010;141:1117–34. doi: 10.1016/j.cell.2010.06.011. - DOI - PMC - PubMed
    1. Witsch E, Sela M, Yarden Y. Roles for growth factors in cancer progression. Physiology (Bethesda) 2010;25:85–101. - PMC - PubMed
    1. Davis TB, Yang M, Schell MJ, Wang H, Ma L, Pledger WJ, et al. PTPRS regulates colorectal cancer RAS pathway activity by inactivating Erk and preventing its nuclear translocation. Sci Rep. 2018;8:9296. doi: 10.1038/s41598-018-27584-x. - DOI - PMC - PubMed
    1. Tomasini P, Walia P, Labbe C, Jao K, Leighl NB. Targeting the KRAS pathway in non-small cell lung cancer. Oncologist. 2016;21:1450–60. doi: 10.1634/theoncologist.2015-0084. - DOI - PMC - PubMed

MeSH terms

Substances