. 2021 Oct;47(6):812-825.
doi: 10.1111/nan.12744. Epub 2021 Jul 26.

Impaired myelin production due to an intrinsic failure of oligodendrocytes in mTORpathies

Affiliations

Impaired myelin production due to an intrinsic failure of oligodendrocytes in mTORpathies

Victoria-Elisabeth Gruber et al. Neuropathol Appl Neurobiol. 2021 Oct.

Abstract

Aims: We aim to evaluate if the myelin pathology observed in epilepsy-associated focal cortical dysplasia type 2B (FCD2B) and-histologically indistinguishable-cortical tubers of tuberous sclerosis complex (TSC) is primarily related to the underlying malformation or constitutes a secondary phenomenon due to the toxic microenvironment created by epileptic seizures. We also aim to investigate the possible beneficial effect of the mTOR pathway regulator everolimus on white matter pathology.

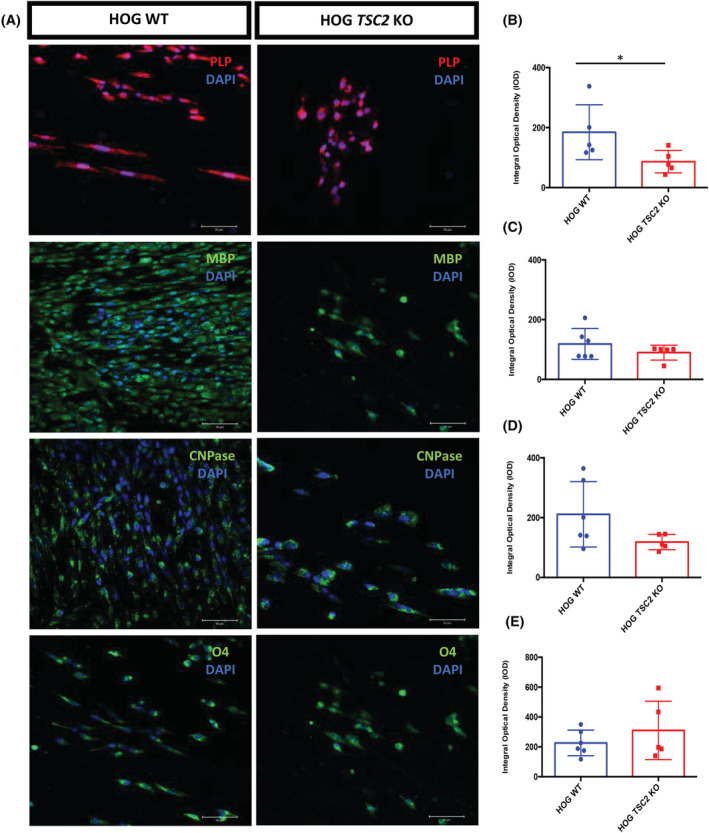
Methods: Primary mixed glial cell cultures derived from epilepsy surgery specimens of one TSC and seven FCD2B patients were grown on polycaprolactone fibre matrices and analysed using immunofluorescence and electron microscopy. Unaffected white matter from three age-matched epilepsy patients with mild malformations of cortical development (mMCD) and one with FCD3D served as controls. Additionally, TSC2 knock-out was performed using an oligodendroglial cell line. Myelination capacities of nanofibre grown cells in an inflammatory environment after mTOR-inhibitor treatment with everolimus were further investigated.

Results: Reduced oligodendroglial turnover, directly related to a lower myelin content was found in the patients' primary cells. In our culture model of myelination dynamics, primary cells grown under 'inflammatory condition' showed decreased myelination, that was repaired by treatment with everolimus.

Conclusions: Results obtained in patient-derived primary oligodendroglial and TSC2 knock-out cells suggest that maturation of oligodendroglia and production of a proper myelin sheath seem to be impaired as a result of mTOR pathway disturbance. Hence, oligodendroglial pathology may reflect a more direct effect of the abnormal genetic programme rather than to be an inactive bystander of chronic epilepsy.

Keywords: focal cortical dysplasia 2B; myelination; nanofibres; oligodendrocyte; tuberous sclerosis complex.


Conflict of interest statement

None of the authors has any conflict of interests to disclose.

Figures

FIGURE 1
FIGURE 1
Cell culture characteristics of patient‐derived primary mixed glial cells and the HOG cell line. 2D‐cell culture of mMCD control (A), FCD2B (B), TSC (C), HOG TSC2 wild‐type (D) and HOG TSC2 knock‐out cells (E) (light microscopy). Scale bar = 6 μm. Representative images of O4 immunolabelling of mMCD control (F), FCD2B (G), TSC (H), HOG TSC2 wild‐type (I) and HOG TSC2 knock‐out (J) cells at day 9 of differentiation on nanofibres. Scale bar = 50 μm. Quantification of the number of cells immunostained for several markers of oligodendrocytes, neurons (Map 2) and astrocytes (GFAP) at day 9 of differentiation of patient‐derived primary mixed glial cells and HOG cells grown on nanofibres (K–O). Mann–Whitney U test was applied for statistical analysis with *p < 0.01. CNPase (green) and pS6 (red) immunolabelling of FCD2B (P); scale bar = 25 μm, TSC (Q); scale bar = 50 μm and HOG TSC2 knock‐out (R); scale bar = 100 μm cells grown on nanofibres. DAPI counterstaining (blue) was used to observe cell nuclei
FIGURE 2
FIGURE 2
Decreased myelin in FCD2B and TSC patients. Representative images of immunolabelling of oligodendroglial lineage markers CNPase, PLP, MBP and O4 in control, FCD2B and TSC patient nanofibre cultures (A). DAPI counterstaining (blue) was used to observe cell nuclei. Scale bar = 50 μm. PLP TSC (scale = 20 μm). The integral optical density (IOD) of CNPase (B), PLP (C), MBP (D) and O4 (E) expression observed in patient nanofibre cultures. Dots represent patient (control (n = 4), FCD2B (n = 7) and TSC (n = 1) median of quantification. Mann–Whitney U test was applied for statistical analysis with *p < 0.01 and **p < 0.001
FIGURE 3
FIGURE 3
Decreased myelin in a TSC2 knock‐out cell line. Representative images of immunolabelling of oligodendrocyte lineage markers PLP, MBP, CNPase and O4 in TSC2 wild‐type and knock‐out cells grown on nanofibres (A). DAPI counterstaining (blue) was used to observe cell nuclei. Scale bar = 50 μm. The integral optical density (IOD) of PLP (B), MBP (C), CNPase (D) and O4 (E) expression observed in TSC2 wild‐type and knock‐out nanofibre cultures. Dots represent single measurements of quantification of HOG TSC2 wild‐type and knock‐out cells. Mann–Whitney U test was applied for statistical analysis with *p < 0.01
FIGURE 4
FIGURE 4
Impaired myelination as a result of depleted oligodendroglial turnover. Representative images of immunolabelling of the oligodendrocyte precursor marker NG2 in control, FCD2B and TSC patient nanofibre cultures (A) and in TSC2 wild‐type and knock‐out cells grown on nanofibres (B). DAPI counterstaining (blue) was used to observe cell nuclei. Scale bar = 50 μm. NG2 control (scale bar = 100 μm). The integral optical density (IOD) of NG2 (C) expression observed in patient nanofibre cultures. Dots represent patient (control (n = 4), FCD2B (n = 7) and TSC (n = 1) median of quantification. The integral optical density (IOD) of NG2 (D) expression observed in TSC2 wild‐type and knock‐out nanofibre cultures. Dots represent single measurements of quantification of HOG TSC2 wild‐type and knock‐out cells. Mann–Whitney U test was applied for statistical analysis with *p < 0.01 and **p < 0.001. Western blot of myelin (MBP, PLP), oligodendrocytes (O4, CNPase) and their precursor cells (NG2) in representative control, FCD2B and TSC patient white matter samples (E). Beta‐actin was used as loading control
FIGURE 5
FIGURE 5
Ultrastructural findings in the white matter and nanofibre cell culture of patients with FCD2B. Representative ultrastructural image of the white matter of a FCD2B case (A). A morphologically normal‐shaped myelinated fibre (*). Conversely, the majority of myelinated fibres showed disruption or formation of onion bulb configuration of the myelin sheath (#). Representative electron micrographs of nanofibre grown mMCD (B, B) and FCD2B (C, C) patient primary cells illustrating ensheathment of polycaprolactone nanofibres (*). Arrows indicate concentric wrapping of membrane around a nanofibre. Scale bar (a, b, c) = 500 nm, (B, C) = 1 μm
FIGURE 6
FIGURE 6
Everolimus treatment of cells grown in an inflammatory environment repairs oligodendroglial lineage progression in HOG TSC2 knock‐out cells and significantly increases CNPase expression in FCD2B patient cells. Representative images of immunolabelling of oligodendroglial lineage markers CNPase (A, A) in FCD2B patient primary nanofibre cultures and MBP (A, B) in TSC2 knock‐out cells grown on nanofibres. The integral optical density (IOD) of CNPase (B) expression observed in treated patient nanofibre cultures. Bars represent patient (control (n = 4), FCD2B (n = 6) and TSC (n = 1) median of quantification. Mann–Whitney U test was applied for statistical analysis with **p < 0.01 and **p < 0.001. The integral optical density (IOD) of CNPase (C), PLP (D) and MBP (E) expression observed in treated TSC2 wild‐type and knock‐out nanofibre cultures. Bars represent single data of quantification of HOG TSC2 wild‐type and knock‐out cells. Mann–Whitney U test was applied for statistical analysis with **p < 0.01 and **p < 0.001. Abbreviations: IL‐1β, interleukin‐1 beta; EV, everolimus
FIGURE 7
FIGURE 7
Increased proliferative activity in FCD2B patient‐derived primary mixed glial cells and HOG TSC2 knock‐out cells normalised after everolimus treatment. FCD2B and control primary mixed glial cells were grown for 5 days under standard conditions, treated with 30 ng/ml IL‐1β and 30 ng/ml IL‐1β + 20 nM everolimus and cell proliferation was determined by the Alamar Blue assay. Experiments were performed in sextuplicate. Patients included in this experiment: control (n = 3), FCD2B (n = 4) and TSC (n = 1). Error bars represent standard deviations of these measurements (A). HOG TSC2 wild‐type and knock‐out cells were grown for 5 days under standard conditions, treated with 30 ng/ml IL‐1β and 30 ng/ml IL‐1β + 20 nM everolimus and cell viability was determined by the Alamar Blue assay. Experiments were performed in sextuplicate of the HOG TSC2 wild‐type and knock‐out cell line. Error bars represent standard deviations of these measurements (B). Abbreviations: IL‐1β, interleukin‐1 beta; EV, everolimus

References

    1. Simons M, Nave K‐A. Oligodendrocytes: myelination and axonal support. Cold Spring Harb Perspect Biol. June 2015;8(1):a020479. - PMC - PubMed
    1. Philips T, Rothstein JD. Oligodendroglia: Metabolic supporters of neurons. Am Soc Clin Invest. 2017;127(9):3271‐3280. - PMC - PubMed
    1. Bedner P, Jabs R, Steinhäuser C. Properties of human astrocytes and NG2 glia. Glia. 2020;68(4):756‐767. - PubMed
    1. Gaesser JM, Fyffe‐Maricich SL. Intracellular signaling pathway regulation of myelination and remyelination in the CNS. Exp Neurol. 2016. - PMC - PubMed
    1. Ishii A, Furusho M, Macklin W, Bansal R. Independent and cooperative roles of the Mek/ERK1/2‐MAPK and PI3K/Akt/mTOR pathways during developmental myelination and in adulthood. Glia. 2019;67(7):1277‐1295. - PMC - PubMed

Publication types

MeSH terms

Substances

LinkOut - more resources