

Impacts of COVID-19 on public transport ridership in Sweden: Analysis of ticket validations, sales and passenger counts
- PMID: 34173478
- PMCID: PMC7575262
- DOI: 10.1016/j.trip.2020.100242
Impacts of COVID-19 on public transport ridership in Sweden: Analysis of ticket validations, sales and passenger counts
Abstract
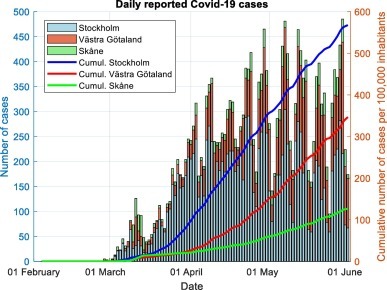
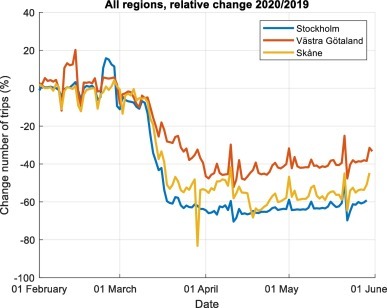
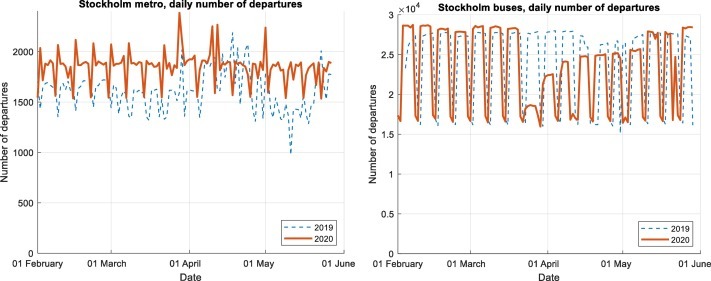
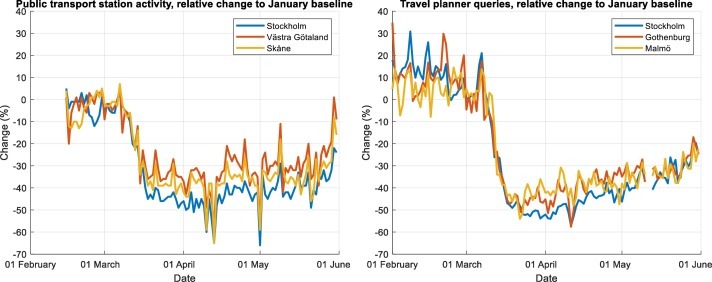
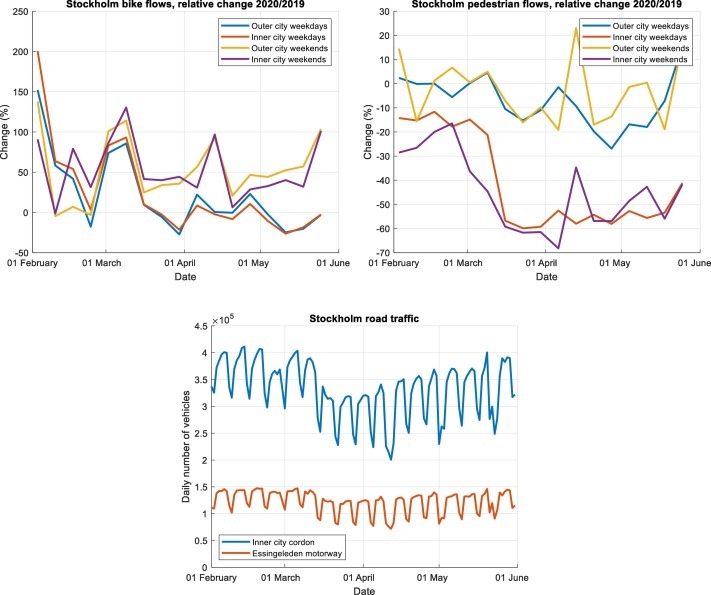
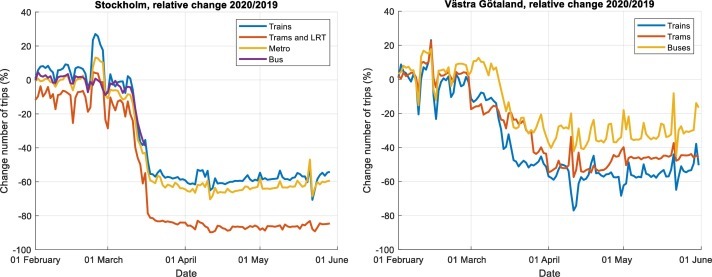
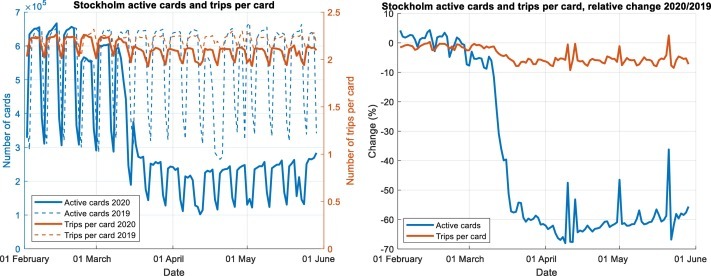
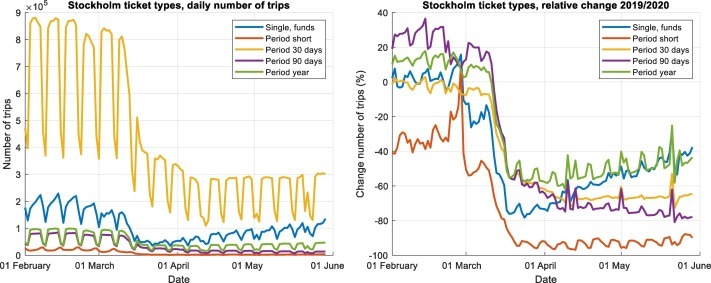
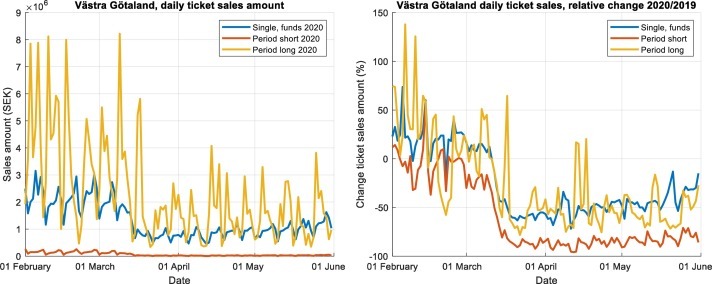
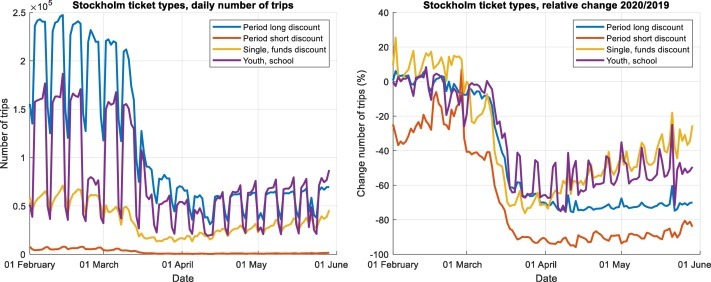
The paper analyses the impacts of COVID-19 on daily public transport ridership in the three most populated regions of Sweden (Stockholm, Västra Götaland and Skåne) during spring 2020. The analysis breaks down the overall ridership with respect to ticket types, youths and seniors, and transport modes based on ticket validations, sales and passenger counts data. By utilizing disaggregate ticket validation data with consistent card ids we further investigate to what extent fewer people travelled, or each person travelled less, during the pandemic. The decrease in public transport ridership (40%-60% across regions) was severe compared with other transport modes. Ridership was not restricted by service levels as supply generally remained unchanged throughout the period. The ridership reduction stems primarily from a lower number of active public transport travellers. Travellers switched from monthly period tickets to single tickets and travel funds, while the use and the sales of short period tickets, used predominantly by tourists, dropped to almost zero. One-year period tickets and school tickets increased from mid-April, which could indicate that the travellers using these tickets are particularly captive to the public transport system. Collaborative effort is required to put the results in the international context.
Keywords: COVID-19; Pandemic; Public transport; Sweden; Ticket validations; Urban mobility.
© 2020 The Author(s).
Figures
Similar articles
-
Data-driven analysis of the impact of COVID-19 on Madrid's public transport during each phase of the pandemic.Cities. 2022 Aug;127:103723. doi: 10.1016/j.cities.2022.103723. Epub 2022 May 2. Cities. 2022. PMID: 35530724 Free PMC article.
-
The impact of COVID-19 and related containment measures on Bangkok's public transport ridership.Transp Res Interdiscip Perspect. 2023 Jan;17:100737. doi: 10.1016/j.trip.2022.100737. Epub 2022 Dec 5. Transp Res Interdiscip Perspect. 2023. PMID: 36504757 Free PMC article.
-
Analysis of Rail Passenger Flow in a Rail Station Concourse Prior to and During the COVID-19 Pandemic Using Event-Based Simulation Models and Scenarios.Urban Rail Transit. 2022;8(2):99-120. doi: 10.1007/s40864-022-00167-w. Epub 2022 May 13. Urban Rail Transit. 2022. PMID: 35582430 Free PMC article.
-
Investigating the potential of aggregated mobility indices for inferring public transport ridership changes.PLoS One. 2024 Jan 5;19(1):e0296686. doi: 10.1371/journal.pone.0296686. eCollection 2024. PLoS One. 2024. PMID: 38180958 Free PMC article.
-
International travel-related control measures to contain the COVID-19 pandemic: a rapid review.Cochrane Database Syst Rev. 2021 Mar 25;3(3):CD013717. doi: 10.1002/14651858.CD013717.pub2. Cochrane Database Syst Rev. 2021. PMID: 33763851 Free PMC article.
Cited by
-
The effects of COVID-19 epidemic on public transport ridership and frequencies. A case study from Tampere, Finland.Transp Res Interdiscip Perspect. 2021 Jun;10:100348. doi: 10.1016/j.trip.2021.100348. Epub 2021 Mar 14. Transp Res Interdiscip Perspect. 2021. PMID: 36844005 Free PMC article.
-
The role of current transport expenditure in mitigating the risk of modal shift during Covid-19 - Lessons from Polish cities.Case Stud Transp Policy. 2022 Jun;10(2):891-904. doi: 10.1016/j.cstp.2022.03.004. Epub 2022 Mar 9. Case Stud Transp Policy. 2022. PMID: 35291373 Free PMC article.
-
Exploring mobility pattern changes between before, during and after COVID-19 lockdown periods for young adults.Cities. 2022 Jun;125:103662. doi: 10.1016/j.cities.2022.103662. Epub 2022 Mar 16. Cities. 2022. PMID: 35309857 Free PMC article.
-
Mobility in pandemic times: Exploring changes and long-term effects of COVID-19 on urban mobility behavior.Transp Res Interdiscip Perspect. 2022 Sep;15:100668. doi: 10.1016/j.trip.2022.100668. Epub 2022 Aug 11. Transp Res Interdiscip Perspect. 2022. PMID: 35971332 Free PMC article.
-
Activities, time-use and mental health during the first COVID-19 pandemic wave: Insight from Greece.Transp Res Interdiscip Perspect. 2021 Sep;11:100442. doi: 10.1016/j.trip.2021.100442. Epub 2021 Aug 6. Transp Res Interdiscip Perspect. 2021. PMID: 34693276 Free PMC article.
References
-
- Aloi A., Alonso B., Benavente J., Cordera R., Echániz E., González F., Ladisa C., Lezama-Romanelli R., López-Parra Á., Mazzei V., Perrucci L., Prieto-Quintana D., Rodríguez A., Sañudo R. Effects of the COVID-19 lockdown on urban mobility: empirical evidence from the city of Santander (Spain) Sustainability. 2020;12
-
- Apple Mobility Trends 2020. https://www.apple.com/covid19/mobility Data available at.
-
- City of Stockholm 2020. http://miljobarometern.stockholm.se/trafik/covid-19/ Data available at.
LinkOut - more resources
Full Text Sources
Miscellaneous