. 2021 Oct;36(10):1990-1998.
doi: 10.1002/tox.23317. Epub 2021 Jun 26.

Erk phosphorylation reduces the thymoquinone toxicity in human hepatocarcinoma

Affiliations

Erk phosphorylation reduces the thymoquinone toxicity in human hepatocarcinoma

Bin Zhang et al. Environ Toxicol. 2021 Oct.

Abstract

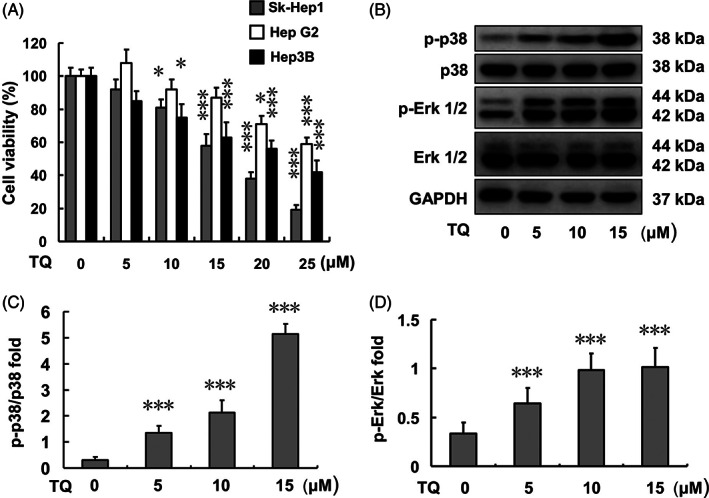
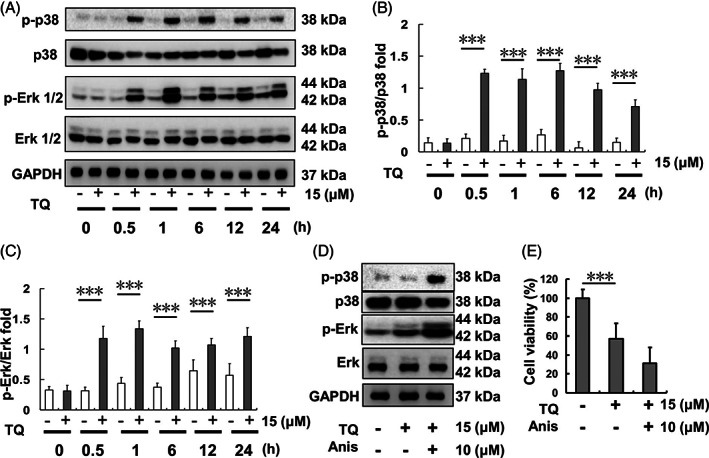
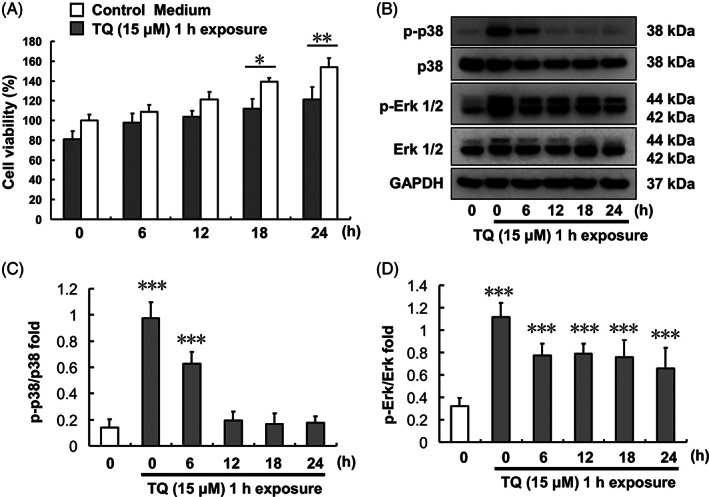
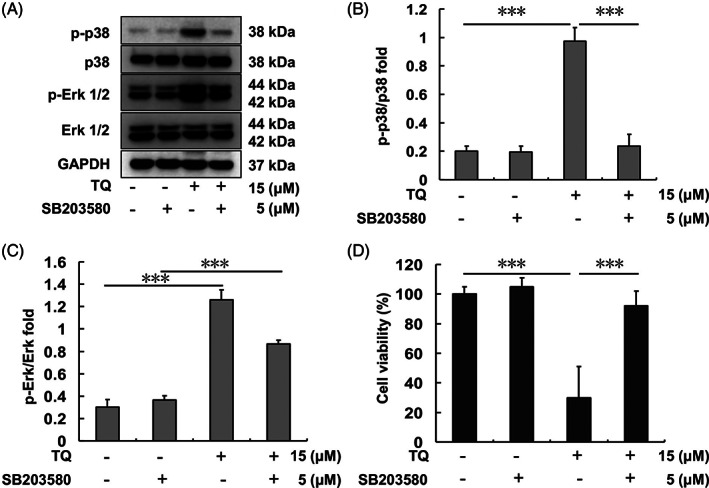
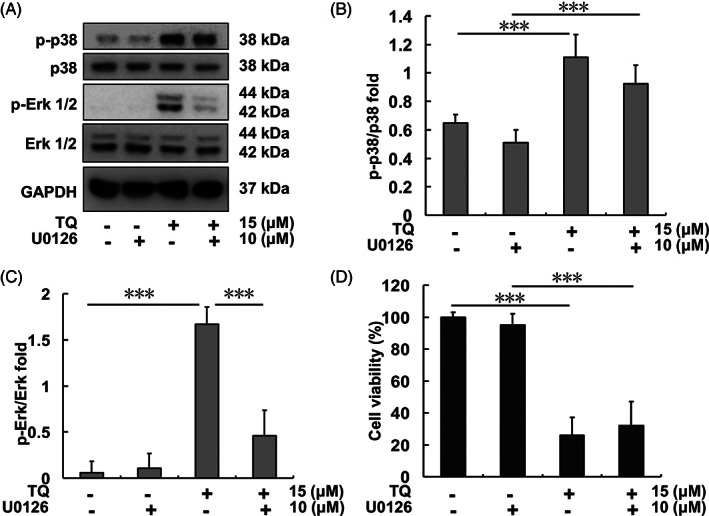
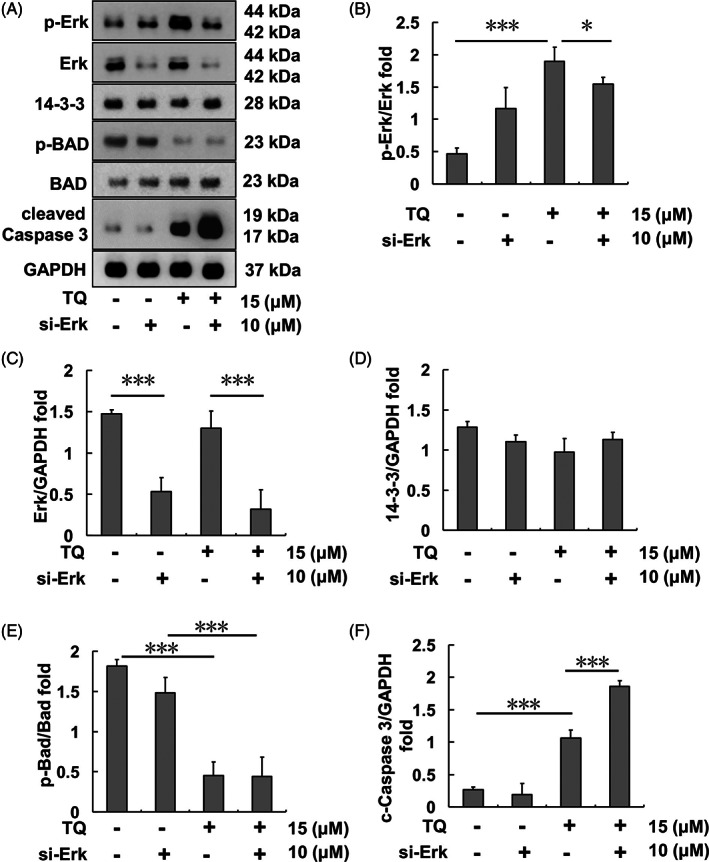
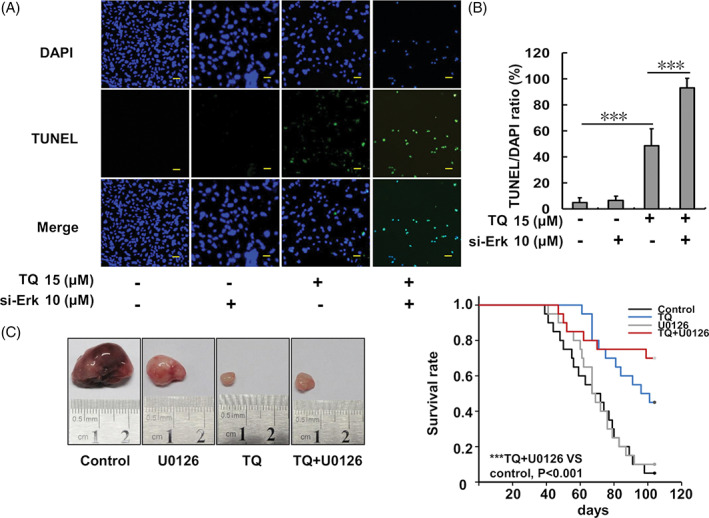
Although enormous achievements have been made in targeted molecular therapies against hepatocellular carcinoma (HCC), the treatments can only prolong the life of patients with extrahepatic metastases. We evaluated thymoquinone (TQ), a compound from Nigella sativa Linn., for its anti-cancer effect on SK-Hep1 cells and HCC-xenograft nude mice. TQ effectively triggered cell death and activated p38 and extracellular signal-regulated kinases (Erk) pathways up to 24 h after treatment in cells. TQ-induced cell death was reversed by p38 inhibitor; however, it was enhanced by si-Erk. The caspase3 activation and TUNEL assay revealed a stronger toxic effect upon co-treatment with TQ and si-Erk. Our study suggested that phosphorylation of p38 in SK-Hep1 cells constituted the major factor leading to cell apoptosis, whereas phosphorylation of Erk led to drug resistance. Furthermore, TQ therapeutic effect was improved upon Erk inhibition in HCC-xenograft nude mice. TQ could present excellent anti-HCC potential under suitable p-Erk inhibiting conditions.

Keywords: Erk; SK-Hep1 cells; hepatocellular carcinoma; p38; thymoquinone.


Conflict of interest statement

The authors declare that they have no competing interests.

Figures

FIGURE 1
FIGURE 1
TQ treatment effect in liver cancer cell lines and related protein expression in SK‐Hep1 cells. (A) SK‐Hep1, Hep G2, and Hep3B cell viabilities after 24‐h TQ (0, 5, 10, 15, 20, and 25 μM) treatments. (B) Related p38 and Erk protein expression after 24‐h TQ (0, 5, 10, and 15 μM) treatments in SK‐Hep1 cells. (C) p‐p38/p38 protein expression ratio after 24‐h TQ (0, 5, 10, and 15 μM) treatments in SK‐Hep1 cells. (D) p‐Erk/Erk protein expression ratio after 24‐h TQ (0, 5, 10, and 15 μM) treatments in SK‐Hep1 cells (***p < .001). TQ, thymoquinone
FIGURE 2
FIGURE 2
Erk and p38 expression after different time courses of TQ (15 μM)‐exposure in SK‐Hep1 cells. (A) Erk and p38 protein expression levels. (B) p‐p38/p38 protein expression ratio after TQ exposure over different time courses. (C) p‐Erk/Erk protein expression ratio after TQ exposure over different time courses. (D) Erk and p38 protein expression levels upon TQ‐only treatment or TQ‐anisomycin (Anis) co‐treatment. (E) Cell viability of SK‐Hep1 cells after 24‐h TQ and anisomycin co‐treatment. (***p < .001). TQ, thymoquinone
FIGURE 3
FIGURE 3
Effect of 1‐h TQ exposure on SK‐Hep1 cells. (A) Cell viability at different times after 1‐h TQ exposure. (B) Erk and p38 protein expression levels. (C) p‐p38/p38 protein expression ratio after 1‐h TQ exposure over different time courses. (D) p‐Erk/Erk protein expression ratio after 1‐h TQ exposure over different time courses (***p < .001). TQ, thymoquinone
FIGURE 4
FIGURE 4
Erk and p38 expression after TQ and/or SB203580 treatment in SK‐Hep1 cells. (A) Erk and p38 protein levels after each indicated treatment. (B) p‐p38/p38 protein expression ratio upon each indicated treatment. (C) p‐Erk/Erk protein expression ratio upon each indicated treatment. (D) SK‐Hep1 cell viability after 24 h of each indicated treatment (***p < .001). TQ, thymoquinone
FIGURE 5
FIGURE 5
Erk and p38 expression after TQ and U0126 treatments in SK‐Hep1 cells. (A) Erk and p38 protein levels upon each indicated treatment. (B) p‐p38/p38 protein expression ratio upon each indicated treatment. (C) p‐Erk/Erk protein expression ratio upon each indicated treatment. (D) SK‐Hep1 cell viability after 24 h of each indicated treatment (***p < .001). TQ, thymoquinone
FIGURE 6
FIGURE 6
Apoptosis‐related protein expression after TQ and si‐Erk treatment in SK‐Hep1 cells. (A) Bad‐regulated apoptotic protein levels upon each indicated treatment. (B) p‐Erk/Erk protein expression ratio upon each indicated treatment. (C) Erk/GAPDH protein expression ratio upon each indicated treatment. (D) 14–3‐3/GAPDH protein expression ratio upon each indicated treatment. (E) p‐Bad/Bad protein expression ratio upon each indicated treatment. (F) Cleaved Caspase 3/GAPDH protein expression ratio upon each indicated treatment (*p < .05, ***p < .001). TQ, thymoquinone
FIGURE 7
FIGURE 7
Analysis of SK‐Hep1 cell apoptosis analysis following TQ and si‐Erk treatment and the animal model. (A) Cell apoptosis evaluation using DAPI and TUNEL staining assays. (B) The TUNEL/DAPI ratio of SK‐Hep1 cells after TQ and si‐Erk treatments. (C) BALB/c‐nu mouse survival curve and a representative tumor following SK‐Hep1 xenograft and the indicated treatments. Survival curve analysis by Kaplan–Meier analysis and the log rank test is shown. A statistically significant difference was observed between survival curves (p < .001). For all pairwise multiple comparison procedures (Holm‐Sidak method) the significance level = 0.05. TQ versus control, p = .00171; TQ + U0126 versus control, p = .000193; TQ versus U0126, p = .00584; TQ + U0126 versus U0126, p = .00116; TQ versus TQ + U0126, p = .36; control versus U0126, p = .752 (***p < .001 compared to the control group). TQ, thymoquinone

Similar articles

Cited by

References

    1. Torre LA, Bray F, Siegel RL, Ferlay J, Lortet‐Tieulent J, Jemal A. Global Cancer statistics, 2012. CA Cancer J Clin. 2015;65:87‐108. - PubMed
    1. Wang WY, Qin HL, Zhou L, Ma JL. Meta‐analysis of the relationship between microRNA‐499 rs3746444 polymorphism and hepatocellular carcinoma risk in Asians. J Cancer Res Ther. 2016;12:676‐680. - PubMed
    1. Hsu SC, Kuo CL, Lin JP, et al. Crude extracts of Euchresta formosana radix inhibit invasion and migration of human hepatocellular carcinoma cells. Anticancer Res. 2007;27:2377‐2384. - PubMed
    1. Bai HQ, Gao P, Gao H, et al. Improvement of survival rate for patients with hepatocellular carcinoma using transarterial chemoembolization in combination with three‐dimensional conformal radiation therapy: a meta‐analysis. Med Sci Monit. 2016;22:1773‐1781. - PMC - PubMed
    1. Lee JG, Kang CM, Park JS, et al. The actual five‐year survival rate of hepatocellular carcinoma patients after curative resection. Yonsei Med J. 2006;47:105‐112. - PMC - PubMed