. 2022 Jun 29;118(8):1978-1992.
doi: 10.1093/cvr/cvab218.

Human coronary microvascular contractile dysfunction associates with viable synthetic smooth muscle cells

Affiliations

Human coronary microvascular contractile dysfunction associates with viable synthetic smooth muscle cells

Kim A Dora et al. Cardiovasc Res. .

Abstract

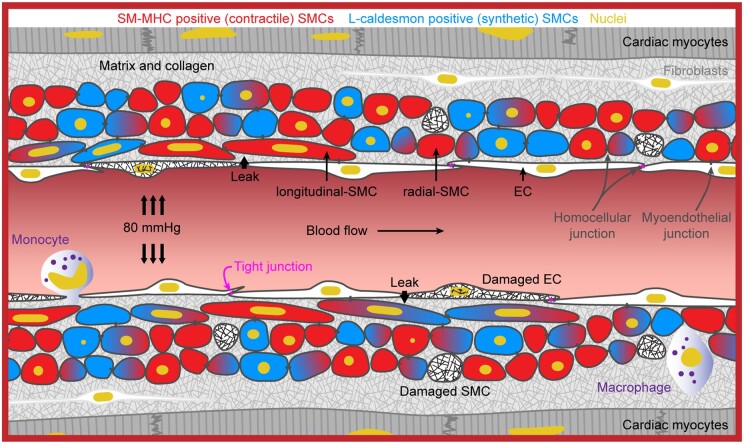
Aims: Coronary microvascular smooth muscle cells (SMCs) respond to luminal pressure by developing myogenic tone (MT), a process integral to the regulation of microvascular perfusion. The cellular mechanisms underlying poor myogenic reactivity in patients with heart valve disease are unknown and form the focus of this study.

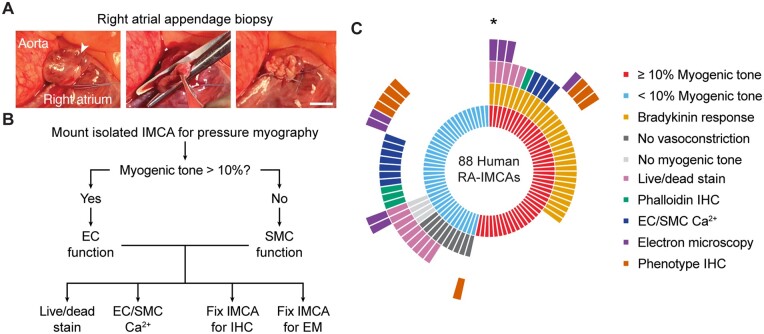
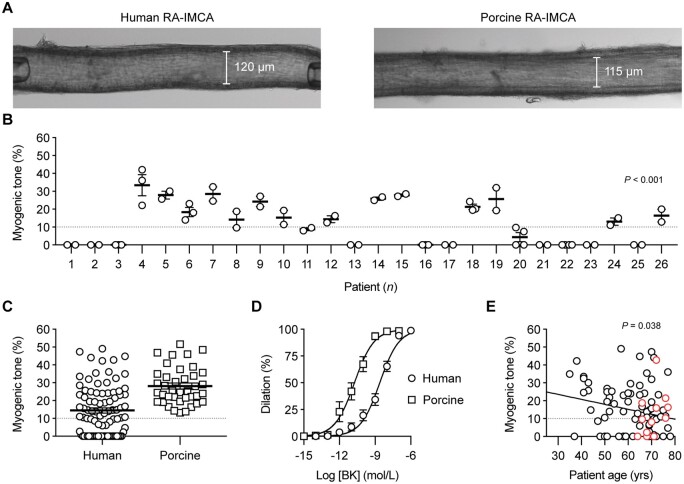
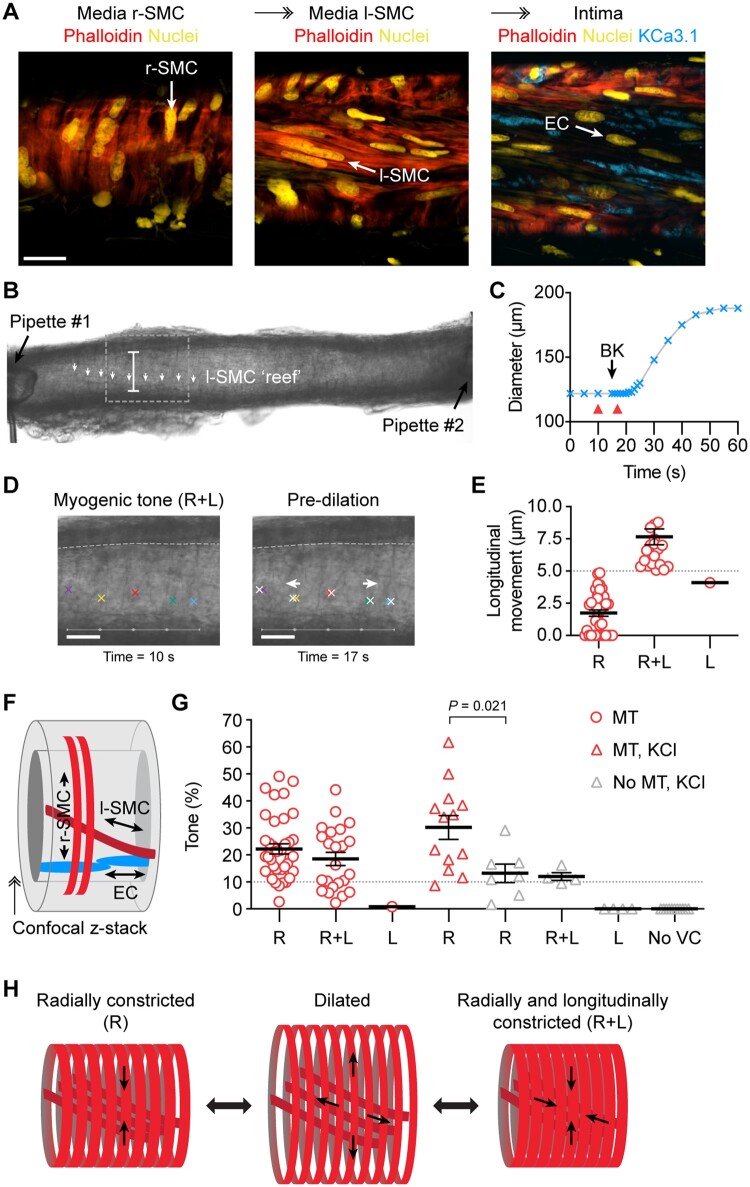
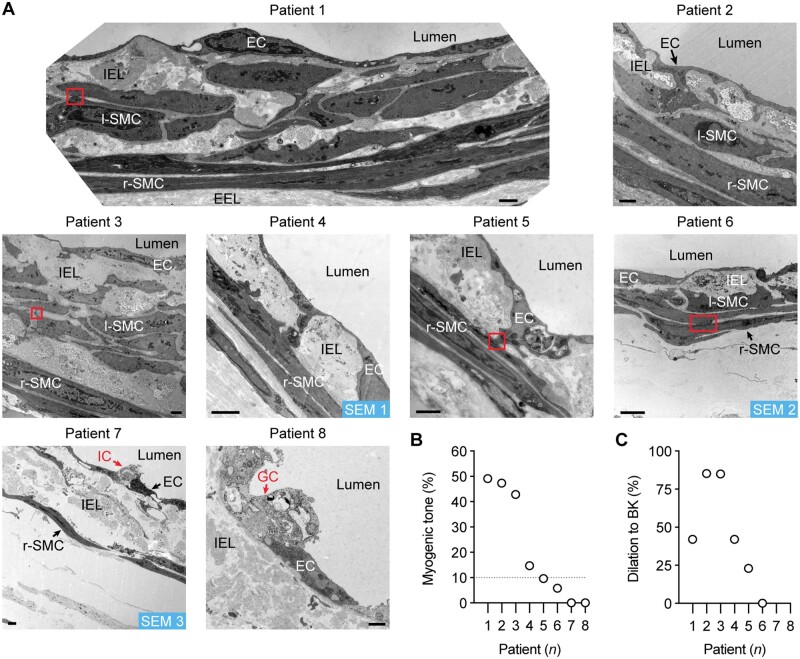
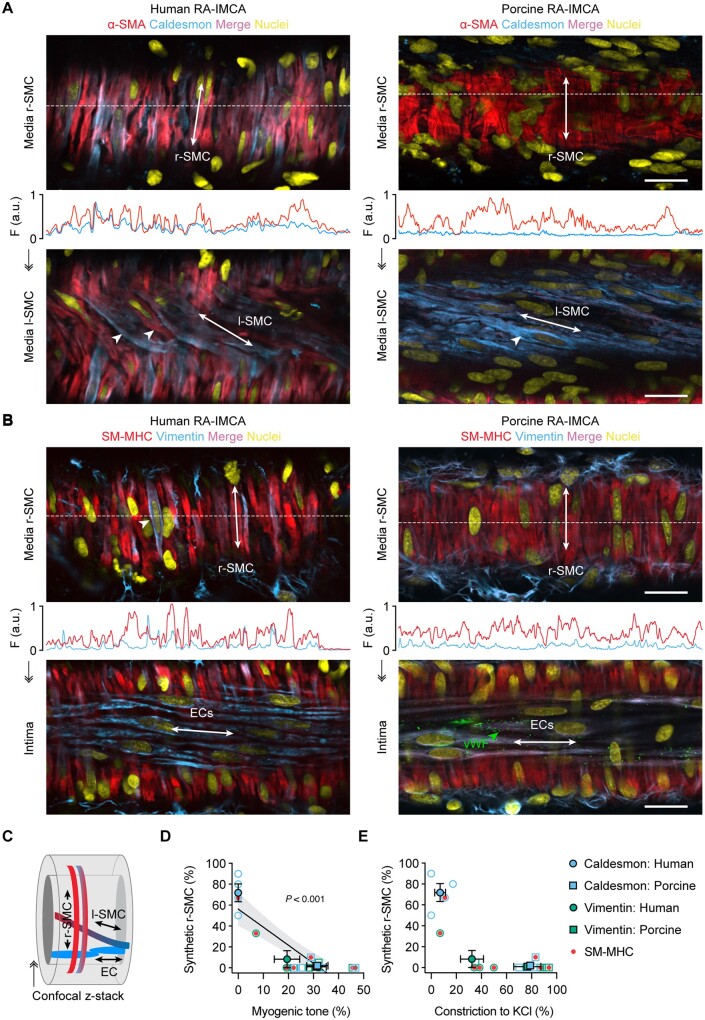
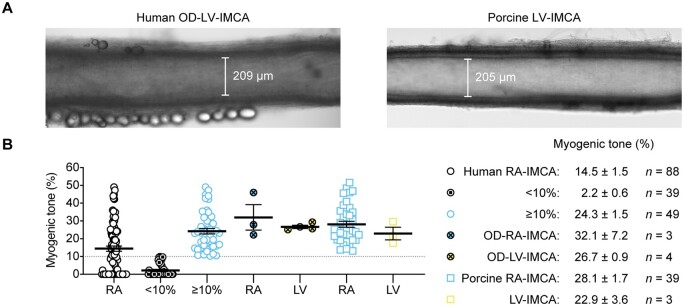
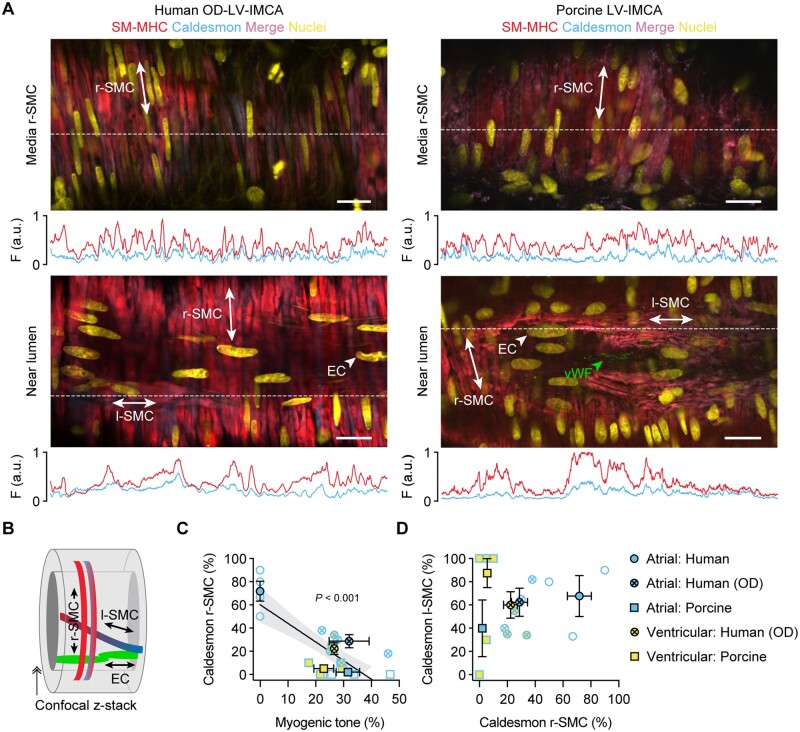
Methods and results: Intramyocardial coronary micro-arteries (IMCAs) isolated from human and pig right atrial (RA) appendage and left ventricular (LV) biopsies were studied using pressure myography combined with confocal microscopy. All RA- and LV-IMCAs from organ donors and pigs developed circa 25% MT. In contrast, 44% of human RA-IMCAs from 88 patients with heart valve disease had poor (<10%) MT yet retained cell viability and an ability to raise cytoplasmic Ca2+ in response to vasoconstrictor agents. Comparing across human heart chambers and species, we found that based on patient medical history and six tests, the strongest predictor of poor MT in IMCAs was increased expression of the synthetic marker caldesmon relative to the contractile marker SM-myosin heavy chain. In addition, high resolution imaging revealed a distinct layer of longitudinally aligned SMCs between ECs and radial SMCs, and we show poor MT was associated with disruptions in these cellular alignments.

Conclusion: These data demonstrate the first use of atrial and ventricular biopsies from patients and pigs to reveal that impaired coronary MT reflects a switch of viable SMCs towards a synthetic phenotype, rather than a loss of SMC viability. These arteries represent a model for further studies of coronary microvascular contractile dysfunction.

Keywords: Ca2+; Coronary arterioles; Coronary microvascular function; Heart valve disease; Human; Microvascular perfusion; Myogenic tone; Smooth muscle cell; Synthetic phenotype; Ultrastructure; signalling.


Figures

Graphical Abstract
Graphical Abstract
A synthetic SMC phenotype underlies coronary microvascular contractile dysfunction. The profile of biomarkers for contractile vs. synthetic phenotype strongly reflects whether an artery can generate MT and therefore contribute to the regulation of coronary blood flow.
Figure 1
Figure 1
Experimental protocols. (A) For both human and porcine RA surgical biopsies a purse string suture was positioned around the tip of the appendage, the specimen excised, and the suture tied off and over sewn. Arrowhead, apex, bar =10 mm. (B, C) Sequence of experimental protocols in ex vivo cannulated arteries from patients with valve disease. Each radiating block in (C) represents one patient; e.g. the single micro-artery studied from the patient indicated by the asterisk developed ≥10% MT and dilated to BK, was imaged for live/dead cells, then fixed for EM, all while cannulated and pressurized to 80 mmHg.
Figure 2
Figure 2
Vaso-reactivity of human and porcine RA-IMCAs. (A) Micrograph of an isolated, cannulated and pressurized h-RA-IMCA and p-RA-IMCA with MT. (B) The MT developed in h-RA-IMCAs within each patient biopsy was consistent, but varied between biopsies (n = 26; non-parametric Kruskal–Willis test with Dunn’s post-test). If an intra-biopsy mean MT was ≥10% it was different to the mean for Patient 1. (C) Summary of percentage MT in h-RA-IMCAs [(12.5%,8.6,16.3), n = 88] and p-RA-IMCAs [(25.3%), n = 39]. (D) Concentration-dependent vasodilation to bradykinin (BK), assessed from developed MT, in h-RA-IMCAs (n = 33) and p-RA-IMCAs (n = 19). (E) Relationship between patient age and MT (n = 88, red circles indicate 12 patients on calcium channel blockers). One-way ANOVA in (B), and linear regression in (E). Further details regarding patient demographics and medications available in Table 1 and Supplementary material online, Figure S1A–D.
Figure 3
Figure 3
Longitudinally aligned medial SMCs (l-SMCs) can cause longitudinal movement in h-RA-IMCAs. (A) Confocal micrographs from a cannulated and pressurized h-RA-IMCA. The confocal z-stack reveals circumferentially arranged r-SMCs and l-SMCs stained with phalloidin, and further towards the lumen in the same artery, K+-channel (KCa3.1) label of ECs; bar =20 µm. (B) Micrograph of an isolated, cannulated and pressurized h-RA-IMCA with MT, with cannulating pipettes visible. Careful inspection of the wall reveals a diagonally orientated sheet or ‘reef’ of l-SMCs (white arrows); bar =122 µm. (C, D) The artery in (B) was treated with 1 µmol/L BK to generate a time-course of dilation (C). (D) Frame-by-frame analysis of the motion revealed longitudinal (L) movement of the wall before the onset of radial movement; red arrowheads in (C) refer to images in (D), white crosses refer to movement; bars =50 µm. After a few seconds, the wall began to dilate radially with an ultimate diagonal ‘concertina-type’ twisting effect. Based on this motion, the MT in this artery was classified as ‘R+L’ constriction. (E) The magnitude of longitudinal motion was assessed for every artery (n = 88). Only arteries where clear longitudinal movement of ≥5 µm were considered R+L. (F) Schematic depiction of the cellular arrangement. (G) Most h-RA-IMCAs developed MT in a radial manner (R, n = 38), including some with additional longitudinal movement (R+L, n = 23), and one artery with clear longitudinal movement (L) but no change in diameter. The vasoconstrictor tone to isotonic 45 mmol/L KCl (KCl) was assessed in a subset of arteries with MT (red triangles, n = 13) and without MT (grey triangles, n = 27). Non-parametric unpaired t-test, Mann–Whitney post-test. (H) Schematic depicting the dilated state and the two most commonly observed modes of SMC contraction, either R or R+L. ↠, Confocal z-stack through the wall of the IMCA.
Figure 4
Figure 4
h-RA-IMCA MT and EC-dependent vasodilation linked to high resolution structure. (A) TEM from cannulated and pressurized h-RA-IMCAs. Images show multiple sites of contact between ECs and SMCs (r-SMC and l-SMC). Severely damaged ECs (ghost cells) remained in close contact with adjacent ECs. Inflammatory cell; bar =1 µm. l-SMCs, when present, are always found between the r-SMC and EC layers. SEM 1–3, indicates h-RA-IMCAs processed for SBF-SEM (Supplementary material online, Figure S3A). The level of MT (B) and vasodilation to 10 nM BK (C) in each h-RA-IMCA subsequently processed for EM (Patients 1–8) reveals arterial ultrastructure is markedly altered in arteries without MT, with extensive thickening of the elastin layer separating the ECs and SMCs (IEL).
Figure 5
Figure 5
The contractile phenotype of r-SMC in h-RA-IMCAs and p-RA-IMCAs correlates with vasomotor function. (A and B) Confocal micrographs from cannulated and pressurized IMCAs. Each artery was imaged at two focal planes: towards the outer wall to image r-SMCs, and towards the lumen to image l-SMCs or ECs [indicated in (C)]. (A) r-SMC and l-SMCs labelled for α-SMA and caldesmon (see Supplementary material online, Movies S6 and S7). Note the heterogeneity of α-SMA labelling in h-RA-IMCA l-SMC (arrowheads). (B) Cell labelling for SM-MHC and vimentin. Vimentin was sparse in r-SMC, while homogeneous in both ECs (also indicated by von Willebrand Factor, vWF) and perivascular cells (fibroblasts). (A and B) The labelling profile for each protein is indicated by the fluorescence intensity (F, arbitrary units, a.u.) of a line drawn through the image at the point indicated by the white dashed lines. Bar =20 µm. Representative of three human and three porcine arteries. (D and E) Percentage of r-SMC with relatively stronger expression of synthetic markers (caldesmon or vimentin) than contractile markers (SM-MHC or α-SMA) within the cytoplasm of the cell plotted against the percentage of developed MT generated in each artery (D); and in the same arteries, the percentage vasoconstriction to 45 mmol/L isotonic KCl (E). Open symbols, individual data points; closed symbols, mean data; red dots, SM-MHC antibody. Linear regression through individual data points, with 95% confidence interval, in (D). ↠, Confocal z-stack through the wall of an IMCA.
Figure 6
Figure 6
Summary of MT development in ex vivo human and porcine IMCAs isolated from RA appendages and the endocardial surface of left ventricles. (A) Micrograph of an isolated, cannulated and pressurized human organ donor (OD)-LV-IMCA and porcine LV-IMCA with MT. (B) When data from the 88 human RA-IMCAs were divided into two groups such that those with <10% MT were shown separately [(0.0%,0.0,0.9), n = 39], the human RA-IMCA group with ≥10% MT [(23.2%), n = 49] appeared remarkably similar to the organ donor [(27.9%), n = 3, (26.2%), n = 4] and porcine [(25.3%), n = 39, (21.6%), n = 3] RA- and LV-IMCA groups, respectively. The human RA-IMCA ≥10% group represents human RA-IMCAs generally used by researchers for vaso-reactivity studies, whereas the human RA-IMCA <10% group represent RA-IMCAs with microvascular contractile dysfunction. The mean±SEM values are provided for each group. Note that, all arteries were studied ex vivo under the same conditions by the same research team. Data from Figure 2C are included, for comparison.
Figure 7
Figure 7
The contractile phenotype of r-SMC in both human and porcine IMCAs correlates with vasomotor function. (A) The LV-IMCAs shown in Figure 6A were labelled for SM-MHC and caldesmon and r-SMCs, l-SMCs and ECs imaged (schematic in B). The position of ECs was confirmed using label for vWF. The labelling profiles for each protein are indicated by the fluorescence intensity (F, arbitrary units, a.u.) of a line drawn through the image at the point indicated by the white dashed lines. Representative of 4 human OD and 11 porcine LV-IMCAs. (C) Percentage of r-SMC with relatively stronger expression of caldesmon than SM-MHC within the cytoplasm of the cell plotted against the percentage developed MT in each artery. All data using this combination of markers is shown from both atrial and ventricular biopsies from both species and heart chambers, for comparison. In general, the human OD-LV-IMCAs had more heterogeneous labelling of contractile markers than the pig LV-IMCAs despite similar levels of developed MT (see Figure 6). Of 4 human OD-LV-IMCAs, 3 had visible l-SMCs (75%), and of 11 porcine LV-IMCAs, 8 had visible l-SMCs (73%). (D) Percentage of cells with clear caldesmon expression in l-SMC plotted against percentage of cells with expression in r-SMCs (n = 3 human, and n = 8 porcine LV-IMCAs). Open symbols, individual data points; closed symbols, mean data. Linear regression through individual data points, with 95% confidence interval, in (C). ↠, Confocal z-stack through the wall of an IMCA.

Similar articles

Cited by

References

    1. Rensen SS, Doevendans PA, van Eys GJ.. Regulation and characteristics of vascular smooth muscle cell phenotypic diversity. NHJL 2007;15:100–108. - PMC - PubMed
    1. Beamish JA, He P, Kottke-Marchant K, Marchant RE.. Molecular regulation of contractile smooth muscle cell phenotype: implications for vascular tissue engineering. Tissue Eng Part B Rev 2010;16:467–491. - PMC - PubMed
    1. Marcus ML, Chilian WM, Kanatsuka H, Dellsperger KC, Eastham CL, Lamping KG.. Understanding the coronary circulation through studies at the microvascular level. Circulation 1990;82:1–7. - PubMed
    1. Kuo L, Chilian WM, Davis MJ.. Interaction of pressure- and flow-induced responses in porcine coronary resistance vessels. Am J Physiol Heart Circ Physiol 1991;261:H1706–H1715. - PubMed
    1. Muller JM, Davis MJ, Chilian WM.. Integrated regulation of pressure and flow in the coronary microcirculation. Cardiovasc Res 1996;32:668–678. - PubMed

Publication types