

Retinal nerve fibre layer thickness measurements in childhood glaucoma: the role of scanning laser polarimetry and optical coherence tomography
- PMID: 34173881
- PMCID: PMC8589798
- DOI: 10.1007/s00417-021-05276-z
Retinal nerve fibre layer thickness measurements in childhood glaucoma: the role of scanning laser polarimetry and optical coherence tomography
Abstract
Purpose: A central diagnostic tool in adult glaucoma is the peripapillary retinal nerve fibre layer (pRNFL) thickness. It can be assessed by scanning laser polarimetry (SLP) or optical coherence tomography (OCT). However, studies investigating the relevance of pRNFL measurements in children are rare. This study aims to compare the glaucoma diagnosing ability of SLP and OCT pRNFL thickness measurements in a paediatric population.
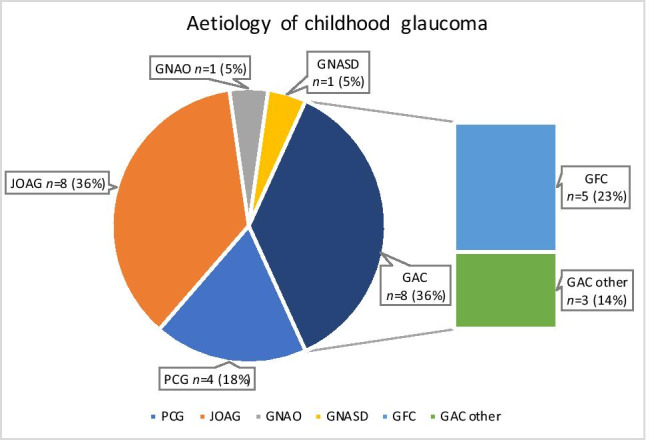
Methods: This retrospective study included 105 children (glaucoma: 22 (21.0%); healthy glaucoma suspects: 83 (79.0%)) aged 4-18 years, examined with SLP (GDxPro/ECC, Carl Zeiss Meditec) and spectral-domain OCT (SPECTRALIS®, Heidelberg Engineering). The thickness of pRNFL sectors was compared between diseased and healthy participants. Areas under the receiver-operating characteristic curves (AUC) and logistic regression results were used to compare the glaucoma discriminative capacity between SLP and OCT measurements.
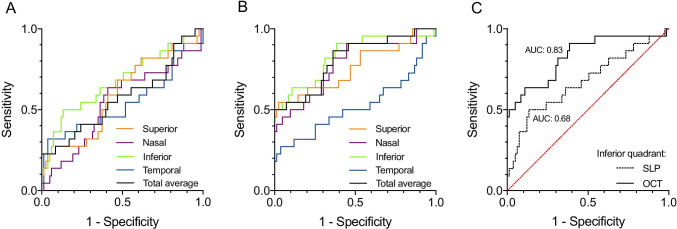
Results: Using OCT, pRNFL thickness was decreased in the superior, nasal, and inferior quadrants of glaucoma patients compared to healthy controls (P < 0.001, each). With SLP, such a difference was only observed in the inferior quadrant (P = 0.011). A correlation between glaucoma diagnosis and OCT-measured pRNFL thickness was found in all quadrants (P < 0.001) other than the temporal. With SLP, a correlation was found for the total average thickness (P = 0.037) and inferior quadrant (P = 0.0019). Finally, the AUCs of OCT measurements were markedly higher than those of SLP (e.g., inferior quadrant: OCT 0.83, SLP 0.68).
Conclusion: pRNFL thickness measurements using both OCT and SLP, correlate notably with the presence of glaucoma. In general, the diagnostic performance of pRNFL thickness measurements seems higher for OCT than for SLP. Thus, pRNFL thickness measurements could provide important information, complementing conventional clinical and functional parameters in the diagnostic process of paediatric glaucoma.
Keywords: Childhood glaucoma; Imaging; Optical coherence tomography; Primary congenital glaucoma; Retinal nerve fibre layer; Scanning laser polarimetry.
© 2021. The Author(s).
Conflict of interest statement
The authors declare that they have no conflict of interest.
Figures
Similar articles
-
The Paediatric Glaucoma Diagnostic Ability of Optical Coherence Tomography: A Comparison of Macular Segmentation and Peripapillary Retinal Nerve Fibre Layer Thickness.Biology (Basel). 2021 Mar 25;10(4):260. doi: 10.3390/biology10040260. Biology (Basel). 2021. PMID: 33805903 Free PMC article.
-
Correlation between scanning laser polarimetry with and without enhanced corneal compensation and high-definition optical coherence tomography in normal and glaucomatous eyes.Int J Clin Pract. 2011 Jul;65(7):807-16. doi: 10.1111/j.1742-1241.2011.02649.x. Epub 2011 May 3. Int J Clin Pract. 2011. PMID: 21535460
-
Scanning laser polarimetry and spectral domain optical coherence tomography for the detection of retinal changes in Parkinson's disease.Acta Ophthalmol. 2015 Dec;93(8):e672-7. doi: 10.1111/aos.12764. Epub 2015 Jun 10. Acta Ophthalmol. 2015. PMID: 26066643
-
The specific pattern of retinal nerve fiber layer thinning in Parkinson's disease: a systematic review and meta-analysis.J Neurol. 2021 Nov;268(11):4023-4032. doi: 10.1007/s00415-020-10094-0. Epub 2020 Jul 20. J Neurol. 2021. PMID: 32691237
-
Normative data for optical coherence tomography in children: a systematic review.Eye (Lond). 2021 Mar;35(3):714-738. doi: 10.1038/s41433-020-01177-3. Epub 2020 Sep 14. Eye (Lond). 2021. PMID: 32929184 Free PMC article.
Cited by
-
Evaluation of visual field changes with retinal nerve fiber layer thickness in primary congenital glaucoma.Indian J Ophthalmol. 2022 Oct;70(10):3556-3561. doi: 10.4103/ijo.IJO_396_22. Indian J Ophthalmol. 2022. PMID: 36190046 Free PMC article.
References
-
- Gilbert C, Rahi J, Quinn G. Visual impairment and blindness in children. In: Johnson G, Minassian D, Weale R, West S, editors. The Epidemiology of Eye Disease. 2. London: Edward Arnold Ltd.; 2003. pp. 260–286.
MeSH terms
LinkOut - more resources
Full Text Sources
Medical
