

The Global Trends and Regional Differences in Incidence of Dengue Infection from 1990 to 2019: An Analysis from the Global Burden of Disease Study 2019
- PMID: 34173959
- PMCID: PMC8234762
- DOI: 10.1007/s40121-021-00470-2
The Global Trends and Regional Differences in Incidence of Dengue Infection from 1990 to 2019: An Analysis from the Global Burden of Disease Study 2019
Abstract
Introduction: Dengue, as a neglected tropical disease, brings a heavy socioeconomic burden. To provide tailored global prevention strategies, we analyzed the global trends and regional differences in incidence of dengue infection from 1990 to 2019.
Methods: We obtained data on annual dengue episodes and incidence rates, which reflected the epidemic status of dengue infection from the 2019 Global Burden of Disease (GBD) Study. The changes in dengue episodes and estimated annual percentage changes (EAPCs) of the age-standardized incidence rate (ASR) were calculated to quantify the temporal trends of dengue infection.
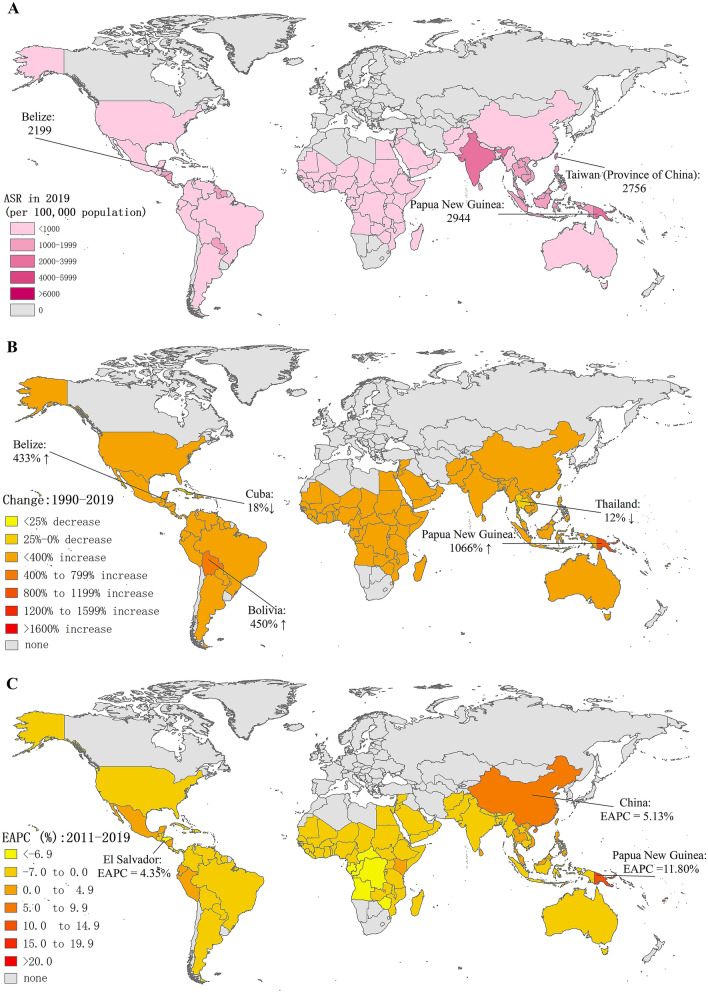
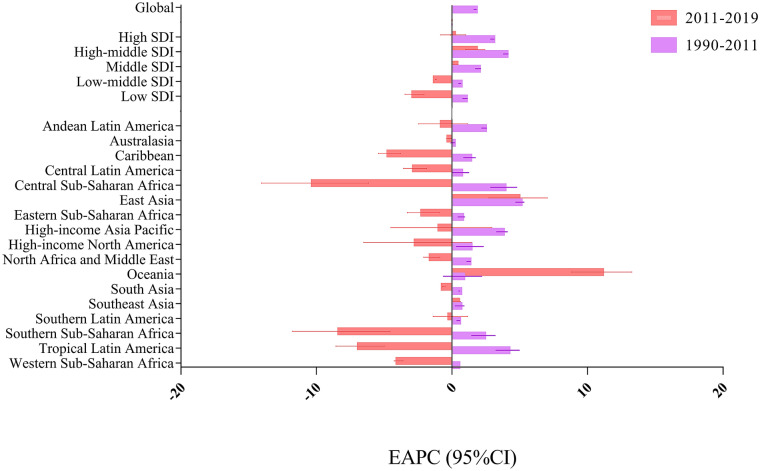
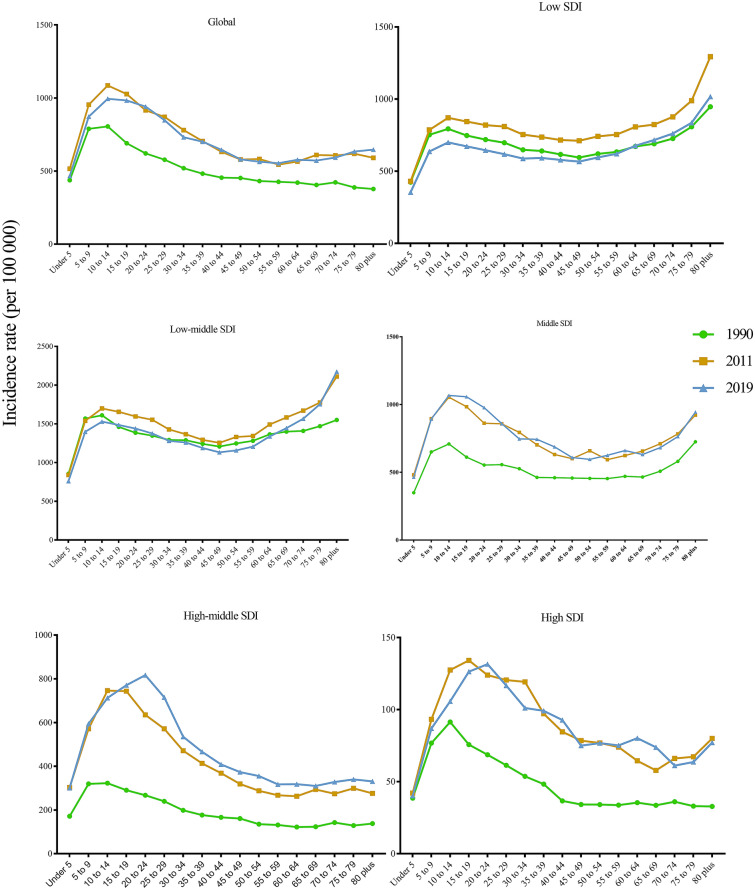
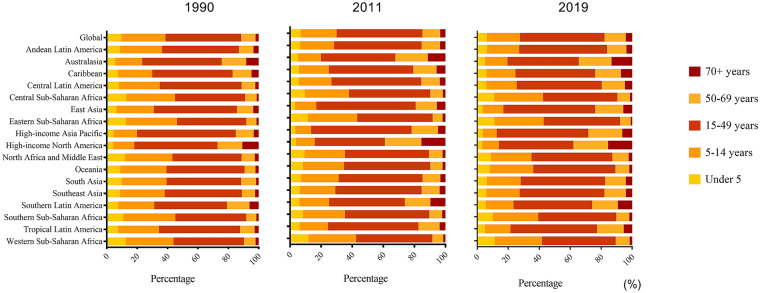
Results: Globally, dengue ASR increased by 1.70% (95% CI 1.62%-1.78%) per year from 1990 to 2011; subsequently, it decreased by 0.41% (95% CI 0.20%-0.62%) per year from 2011 to 2019. However, the global number of dengue episodes increased steadily by 85.47% from 30.67 million in 1990 to 56.88 million in 2019. Against the global trend of decreasing ASR from 2011 to 2019, an increasing trend was reported in Oceania (EAPC 11.01, 95% CI 8.79-13.27), East Asia (EAPC 4.84, 95% CI 2.70-7.03) and Southeast Asia (EAPC 0.38, 95% CI 0.13-0.62). For socio-demographic index (SDI) regions, ASR continued to have an increasing trend in the middle (EAPC 0.26, 95% CI 0.07-0.45) and high-middle (EAPC 1.70, 95% CI 0.98-2.42) SDI regions from 2011 to 2019. In contrast to the global peak age of dengue incidence rate (10 to 25 years), the dengue incidence rate of older people (> 65 years) was higher than in other age groups in low and low-middle SDI regions. Additionally, the proportions of dengue episodes in the > 70-year-old age group increased in 2019 (using the baseline in 1990 or 2011) in most GBD regions.
Conclusions: Global dengue episodes have increased tremendously in 3 decades. Although global dengue ASR decreased in the last decade, it is still increasing in hyperendemic regions including Oceania, East Asia and Southeast Asia, and also in the middle and high-middle SDI regions. More attention should be paid to the elderly because of the higher dengue incidence rate among them in low and low-middle SDI regions and the increased proportions of dengue episodes among the elderly in most GBD regions. Therefore, more efforts should be undertaken to develop targeted prevention strategies for crucial regions and older populations.
Keywords: Dengue; Incidence; Trend.
© 2021. The Author(s).
Figures
References
-
- World Health Organization. Dengue and severe dengue. 2020; https://www.who.int/health-topics/dengue-and-severe-dengue#tab=tab_1.
Grants and funding
LinkOut - more resources
Full Text Sources
