. 2021 Jul 13;54(7):1594-1610.e11.
doi: 10.1016/j.immuni.2021.06.002. Epub 2021 Jun 9.

Deep spatial profiling of human COVID-19 brains reveals neuroinflammation with distinct microanatomical microglia-T-cell interactions

Affiliations

Deep spatial profiling of human COVID-19 brains reveals neuroinflammation with distinct microanatomical microglia-T-cell interactions

Marius Schwabenland et al. Immunity. .

Abstract

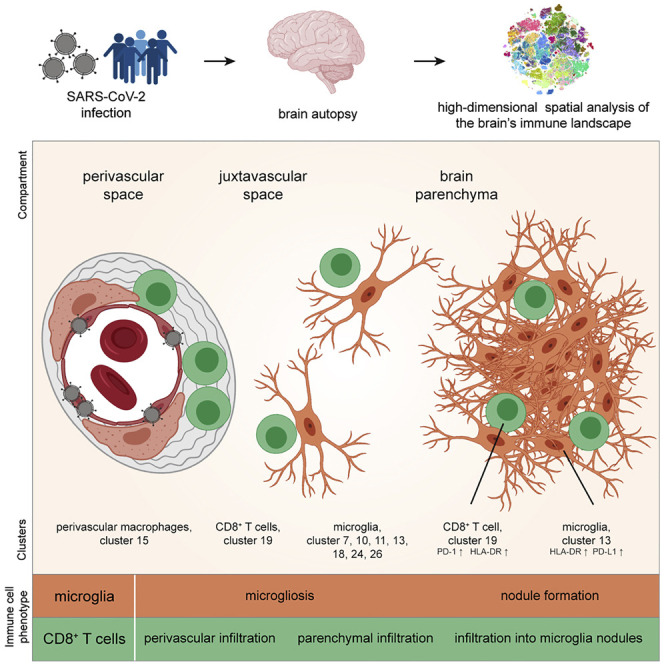
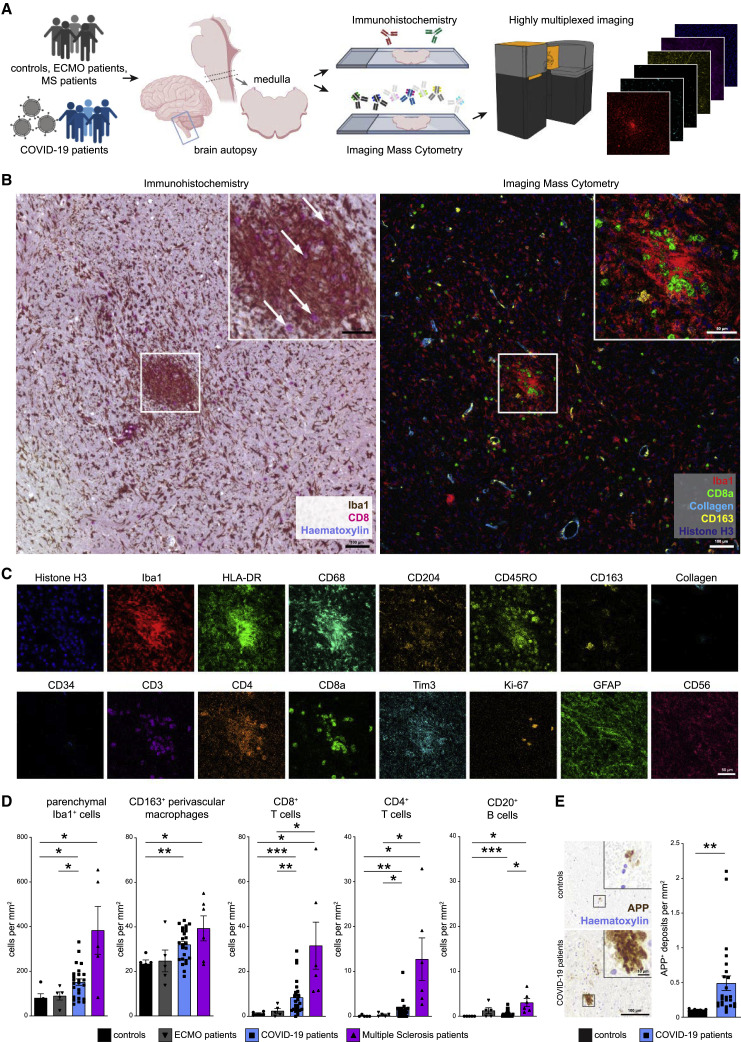
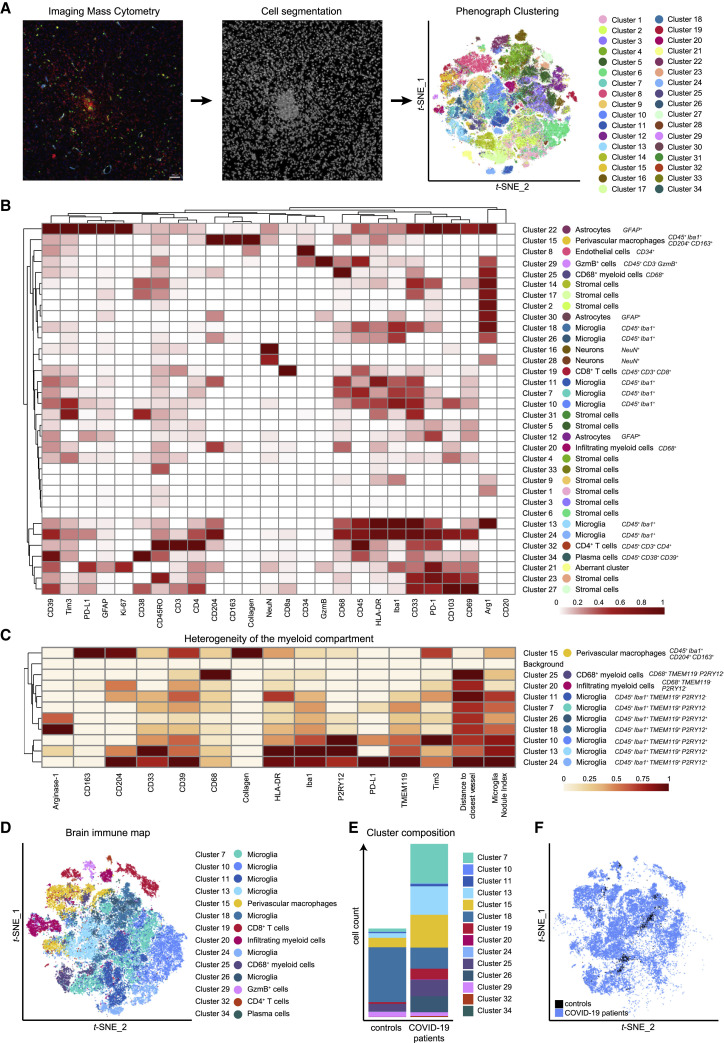
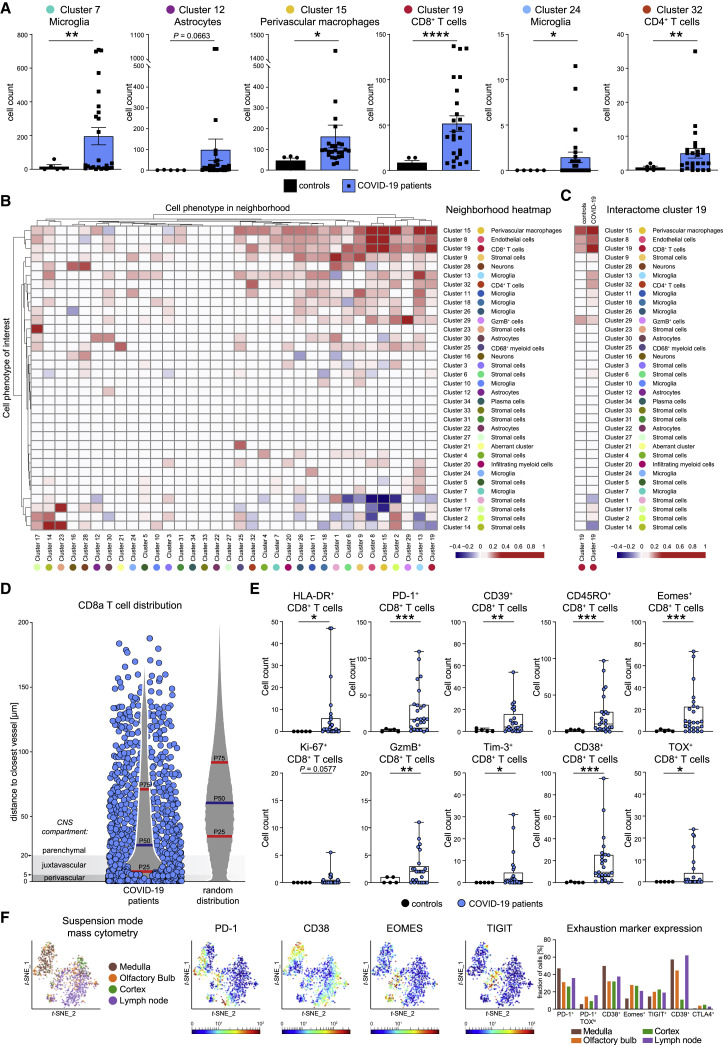
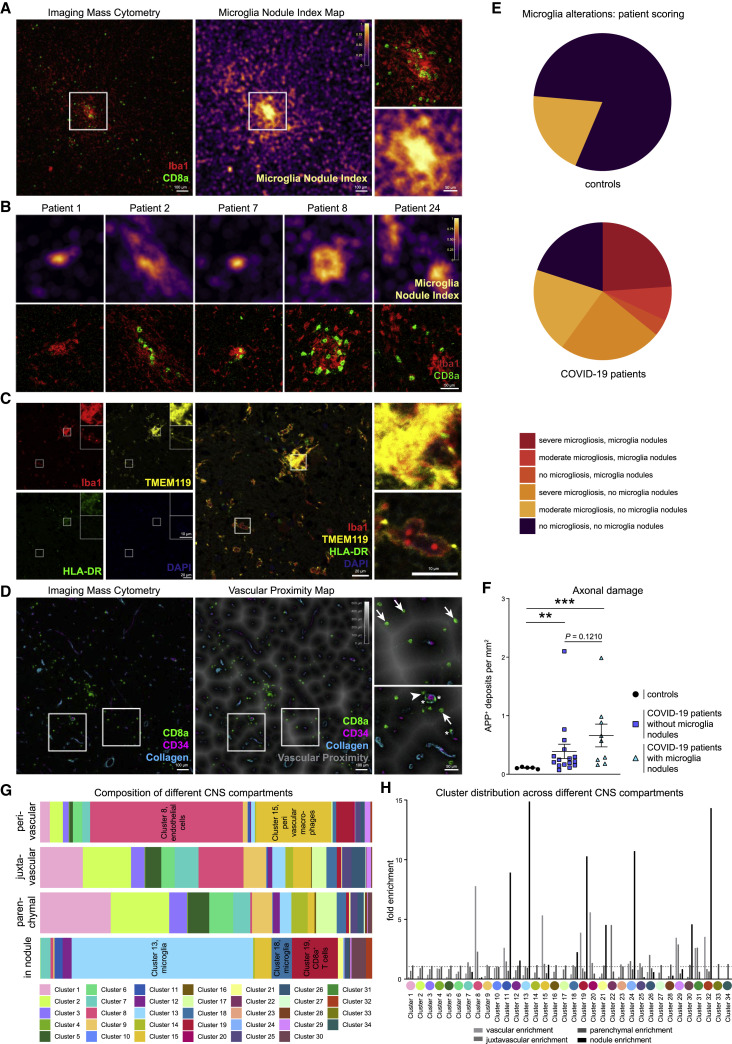
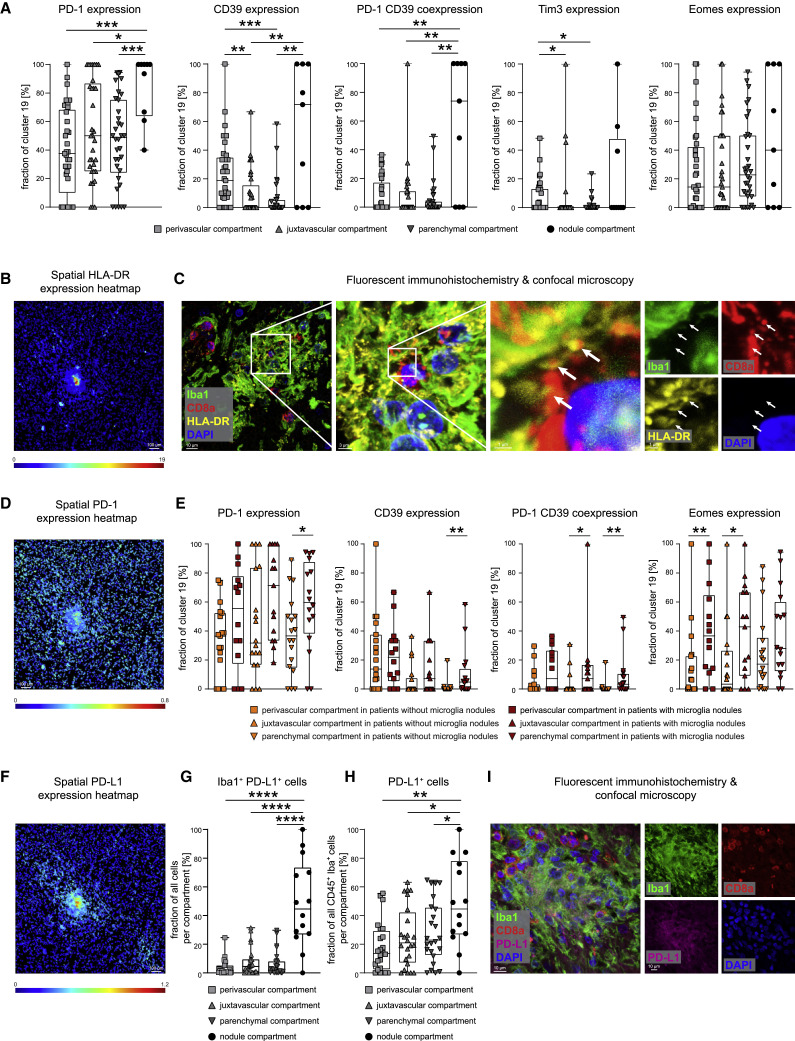
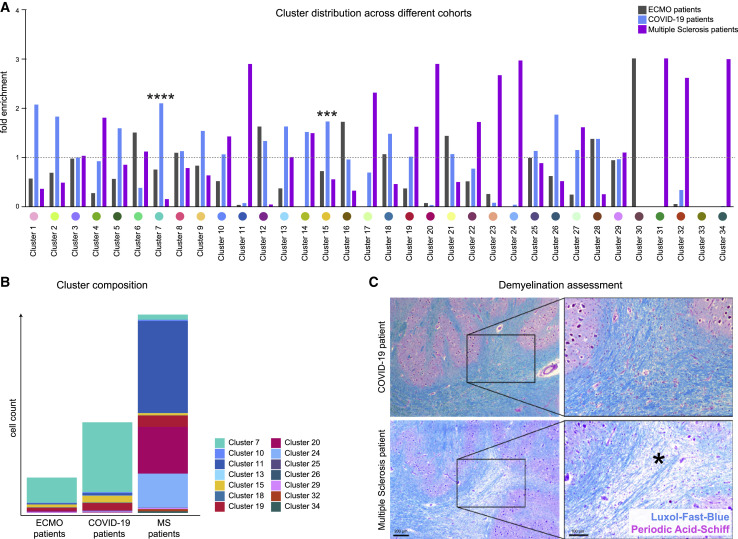
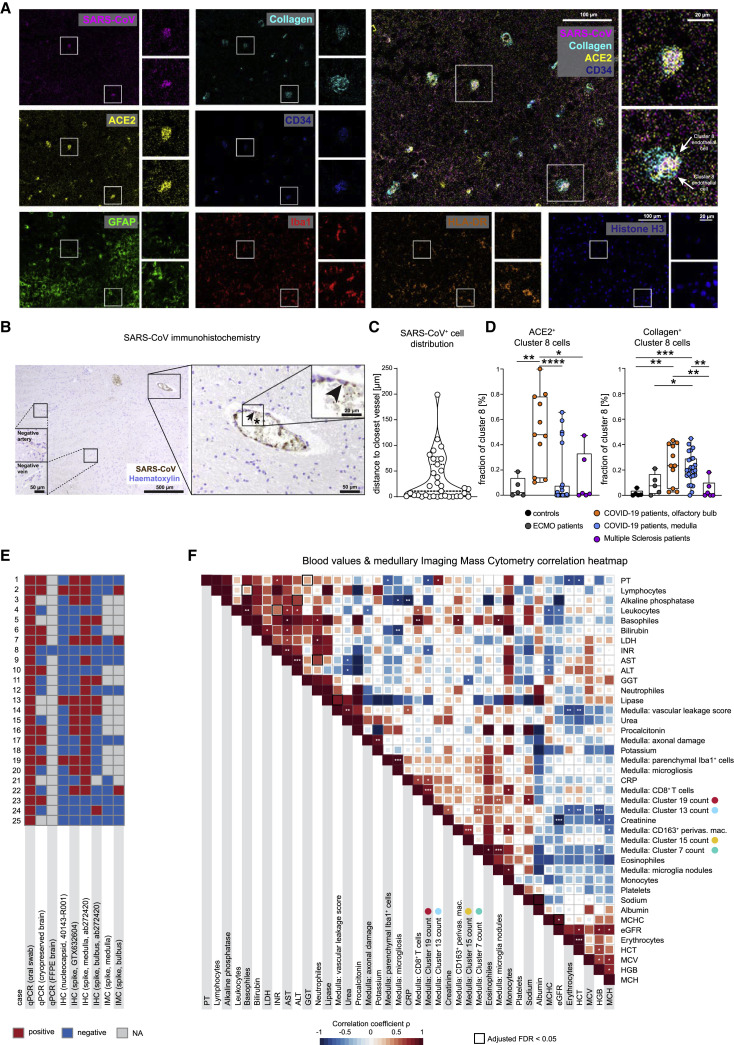
COVID-19 can cause severe neurological symptoms, but the underlying pathophysiological mechanisms are unclear. Here, we interrogated the brain stems and olfactory bulbs in postmortem patients who had COVID-19 using imaging mass cytometry to understand the local immune response at a spatially resolved, high-dimensional, single-cell level and compared their immune map to non-COVID respiratory failure, multiple sclerosis, and control patients. We observed substantial immune activation in the central nervous system with pronounced neuropathology (astrocytosis, axonal damage, and blood-brain-barrier leakage) and detected viral antigen in ACE2-receptor-positive cells enriched in the vascular compartment. Microglial nodules and the perivascular compartment represented COVID-19-specific, microanatomic-immune niches with context-specific cellular interactions enriched for activated CD8+ T cells. Altered brain T-cell-microglial interactions were linked to clinical measures of systemic inflammation and disturbed hemostasis. This study identifies profound neuroinflammation with activation of innate and adaptive immune cells as correlates of COVID-19 neuropathology, with implications for potential therapeutic strategies.

Keywords: COVID-19; SARS-CoV-2; T cells; brain autopsy; encephalopathy; high-dimensional imaging; mass cytometry; microglia; neuroinflammation; single-cell analysis.


Conflict of interest statement

Declaration of interests The authors declare no competing interests.

Figures

None
Graphical abstract
Figure 1
Figure 1
Highly multiplexed imaging mass cytometry analysis of COVID-19 brains reveals neuroinflammation (A) Experimental workflow. Medulla oblongata tissue slices from patient autopsies with COVID-19 (n = 25), history of ECMO therapy (n = 5), or multiple sclerosis (n = 6); control patients (n = 5); and COVID-19 olfactory bulb tissue slices (n = 11) were analyzed by IHC and IMC. (B) Exemplary visualization of corresponding COVID-19 medulla tissue by IHC (left) and IMC (right). The area of interest is magnified in the insert. Scale bars: 100 μm and 50 μm. Left: IHC for Iba1 (brown) and CD8 (pink), counterstained with hematoxylin (blue). Arrows indicate CD8+ T cells. Right: Iba1 (red), CD8 (green), collagen (light blue), CD163 (yellow), and histone H3 (blue) IMC data channels are visualized. (C) Exemplary visualization of indicated marker expression IMC data from channels in the same area as (B). Scale bar: 50 μm. (D) Manual cell counting of defined immune populations was performed on the IMC dataset and compared among control (black), ECMO (gray), COVID-19 (blue), and multiple sclerosis patients (purple). Bar graphs indicate means ± SEM. (E) Immunohistochemical reaction for APP (brown), indicating axonal damage in control and COVID-19 medullae. Counterstaining with hematoxylin (blue). Scale bars: 100 μm; 10 μm in the inserts. Right: quantification of APP deposits is shown; bar graph indicates means ± SEM. See also Figure S1.
Figure 2
Figure 2
The molecular and cellular census of the CNS shows neuroinflammatory alterations in response to SARS-CoV-2 infection (A) Segmentation of IMC images into cellular masks was performed on the entire dataset by supervised machine learning. Single-cell data extracted was clustered with PhenoGraph and visualized on a t-SNE map. (B) Heatmap visualization of cluster marker expression. Normalized median marker expression after subtraction of background is shown. Clusters were annotated according to their expression pattern and spatial distribution; key expression features are indicated. A corresponding Z-score-normalized heatmap is shown in Figure S2B. (C) Heatmap of myeloid cluster heterogeneity. Median marker intensity, distance-to-vessel, and microglia nodule index (see Figure 4) of myeloid clusters were determined in the extension cohort and are visualized in a hierarchically clustered column-normalized heatmap. (D) t-SNE visualization of the brain immune map based on the immune cell clusters identified in (B). (E) Immune cell cluster composition of COVID-19 and control patients is shown by stacked bar charts displaying mean counts per group. (F) Brain immune landscape of COVID-19 (blue) and control patients (black) is shown as in (D). See also Figures S2 and S3.
Figure 3
Figure 3
Spatial profiling of the brain immune response in COVID-19 indicates localized and orchestrated adaptive immune infiltration (A) High-dimensional annotated cell clusters were compared across patients and controls. Immune cell clusters with significantly different abundances in COVID-19 and control patients are shown by scattered dot plots with bar graphs indicating means ± SEM; each dot represents one patient. (B) Spatial interactions between each pair of cell types in patients with COVID-19 were analyzed by permutation-based neighborhood analysis. The percentages of images with significant neighborhood interactions are displayed as a hierarchically clustered heatmap, ranging from −0.4 (avoidance) to +1 (interaction). Rows represent the neighborhood of a cell phenotype of interest. Columns indicate the enrichment or depletion of a cell in other neighborhoods. (C) Cluster c19 spatial neighborhood interactions were determined in COVID-19 and control patients. Columns indicate significant enrichment or depletion of c19 cells in the vicinity of cells from clusters c1–c34. (D) Distance of cluster c19 cells (blue dots) to the nearest collagen+ or CD34+ vessel was determined in COVID-19 brain sections and compared with a random distribution. The 25th, 50th, and 75th percentiles are depicted. (E) CD8 T cell activation in the brains of patients with COVID-19. Cluster c19 cells were analyzed for markers of T cell activation, differentiation, exhaustion, and function. Absolute cell counts were compared among patient groups and visualized by boxplots; dots represent samples. (F) CD8 T cells isolated from medulla, olfactory bulb, cortex, and regional lymph node of a deceased COVID-19 patient were analyzed by suspension-mode mass cytometry. CD8 T cell heterogeneity is shown on a t-SNE map; expression of indicated exhaustion markers is indicated by heatmap coloring. Frequencies are illustrated by bar graphs. See also Figure S4.
Figure 4
Figure 4
Spatial analysis allocates immune cell clusters to distinct anatomical niches in the brains of patients with COVID-19 (A) The microglial nodule index calculated based on Iba1 signal across a 15-μm radius is visualized by color coding on a map (middle) of the representative image (left) also displayed in Figure 1B. The indicated area of interest is magnified (right). (B) Microglia nodule index map (top panel), and respective IMC images visualizing Iba1 (red) and CD8 (green) (bottom panel) are shown for nodule regions in additional patients with COVID-19. Scale bar: 50 μm. (C) Confocal immunofluorescence analysis of Iba1 (red), TMEM119 (yellow), HLA-DR (green), and DAPI (blue) in a microglial nodule area. Scale bars: 20 μm and 10 μm. (D) Left: representative IMC image as in (A) showing CD8a (green), CD34 (purple), and collagen (blue) expression. Middle: vascular distance was estimated as distance to collagen+ or CD34+ structure. Proximity is indicated by increasing darkness, as indicated. Right: magnified insets of areas of interest, indicated by the boxes. Arrows, arrowheads, and stars indicate CD8 T cells distant to, next to, or inside vascular structures, respectively. Scale bars: 100 μm and 50 μm. (E) Presence of microgliosis or microglial nodules in IMC images is visualized in pie charts for patients with COVID-19 and control patients. Severity of microglial alterations is indicated by color code. (F) APP+ deposits were compared between control (black) and COVID-19 patients with or without microglia nodules, as in Figure 1E. (G) Compartment cluster composition was evaluated for patients with COVID-19 and displayed as stacked bar graphs of cluster frequencies per anatomical compartment. (H) Enrichment of individual clusters in anatomical compartments was visualized by an enrichment index (mean cluster frequency in given compartment/mean cluster frequency of total).
Figure 5
Figure 5
Immune cell activation in anatomical compartments indicates pervasive inflammatory effect of microglial nodules on T cell activation and immune checkpoint expression (A) Cluster c19 CD8 T cells were assessed across perivascular, juxtavascular, parenchymal, and nodule compartments for the fraction of PD-1+, CD39+, PD-1+CD39+, Tim3+, and Eomes+ cells. (B) Spatial heatmap of HLA-DR signal intensities in segmented cells in a representative IMC image. Scale bar: 100 μm. (C) Fluorescent IHC for Iba1 (green), HLA-DR (yellow), CD8a (red), and DAPI (blue) of a microglia nodule. Image shows a three-dimensional (3D) Z stack. Scale bars: 10 μm, 3 μm, and 1 μm. White arrows indicate HLA-DR expression at CD8+ cell contact sites. (D) Spatial heatmap of PD-1 signal intensities as in (B) (E) Cluster c19 CD8 T cells were analyzed in different anatomical compartments depending on presence or absence of microglial nodules. Fraction of PD-1+, CD39+, PD-1+CD39+, Eomes+, and HLA-DR+ cells is shown. (F) Spatial heatmap of PD-L1 signal intensities as in (B) (G and H) Fraction of Iba1+PD-L1+ cells (G) and of PD-L1-expressing CD45+Iba1+ cells (H) was compared across perivascular, juxtavascular, parenchymal, and nodule compartments. (I) Confocal immunofluorescence analysis of Iba1 (green), PD-L1 (violet), CD8a (red), and DAPI (blue) of a microglia nodule. Image shows a Z stack. The scale bar: 10 μm. Boxplots with dots display the median with interquartile range (IQR) and upper and lower whiskers. See also Figure S5.
Figure 6
Figure 6
COVID-19 brains display disease-specific immune alterations (A) Cluster distribution in patients with ECMO (gray), COVID-19 (green), and multiple sclerosis (purple). Enrichment of individual clusters in the patient groups is visualized (mean cluster frequency in specific patient group/mean cluster frequency in all three groups). (B) Immune cell cluster composition in ECMO, COVID-19 and MS patients visualized as stacked bar charts indicating mean counts per group. (C) Demyelination was assessed by Luxol-Fast-Blue (blue) and Periodic-Acid-Schiff (purple) staining. Representative images of a COVID-19 (upper panel) and a MS patient (lower panel) are shown. Scale bars: 200 μm and 100 μm. The asterisk indicates an area with marked demyelination.
Figure 7
Figure 7
COVID-19 patients show disease-specific alterations in the central nervous system that correlate with blood chemistry (A) IMC image with expression of SARS-CoV-spike protein (pink), collagen (light blue), ACE2 (yellow), CD34 (blue), GFAP (green), Iba1 (red), HLA-DR (orange), and histone H3 (blue), and an overlay graph depicts an olfactory bulb section from a patient with COVID-19. For each marker the whole image (left) and two areas of interest (right) are shown. Scale bars: 100 μm and 20 μm. (B) The immunohistochemical reaction for SARS-CoV-spike protein (brown) and counterstaining with hematoxylin (blue) is shown at multiple magnifications in the medulla section of a patient with COVID-19. The arrowhead points to a SARS-CoV-spike-protein-positive endothelial cell. The asterisk indicates positive signal in the blood within the vessel lumen. Scale bars: 500 μm, 50 μm, or 20 μm. (C) Violin plot visualizing the distance to the closest vessel (in μm) for all SARS-CoV+ cells. Each dot represents one cell; dotted lines indicate median and IQR. (D) ACE-2 (left) and collagen (right) expression by endothelial cell cluster c8 was compared among patient groups and localizations. Fraction of positive cells is depicted per patient. Box and whiskers plot displays median and IQR. (E) A total of nine different tests for viral protein or RNA were performed in the brains of patients with COVID-19. Results are shown in the heatmap (positive, red; negative, blue; gray; test was not performed). (F) Spearman correlations are visualized between clinical parameters, neuroinflammatory features, and immune clusters from the deep spatial analysis. The heatmap coloring indicates the correlation coefficient; significance levels are indicated by asterisks, and boxes indicate an adjusted FDR < 0.05. See also Figure S7.

References

    1. Bengsch B., Ohtani T., Khan O., Setty M., Manne S., O’Brien S., Gherardini P.F., Herati R.S., Huang A.C., Chang K.M., et al. Epigenomic-guided mass cytometry profiling reveals disease-specific features of exhausted CD8 T cells. Immunity. 2018;48:1029–1045.e5. - PMC - PubMed
    1. Berg S., Kutra D., Kroeger T., Straehle C.N., Kausler B.X., Haubold C., Schiegg M., Ales J., Beier T., Rudy M., et al. ilastik: interactive machine learning for (bio)image analysis. Nat. Methods. 2019;16:1226–1232. - PubMed
    1. Cantuti-Castelvetri L., Ojha R., Pedro L.D., Djannatian M., Franz J., Kuivanen S., van der Meer F., Kallio K., Kaya T., Anastasina M., et al. Neuropilin-1 facilitates SARS-CoV-2 cell entry and infectivity. Science. 2020;370:856–860. - PMC - PubMed
    1. Ellul M.A., Benjamin L., Singh B., Lant S., Michael B.D., Easton A., Kneen R., Defres S., Sejvar J., Solomon T. Neurological associations of COVID-19. Lancet Neurol. 2020;19:767–783. - PMC - PubMed
    1. Helms J., Kremer S., Merdji H., Clere-Jehl R., Schenck M., Kummerlen C., Collange O., Boulay C., Fafi-Kremer S., Ohana M., et al. Neurologic features in severe SARS-CoV-2 infection. N. Engl. J. Med. 2020;382:2268–2270. - PMC - PubMed

Publication types

MeSH terms

Substances