Circulating extracellular vesicles are a biomarker for NAFLD resolution and response to weight loss surgery
- PMID: 34174416
- PMCID: PMC8418232
- DOI: 10.1016/j.nano.2021.102430
Circulating extracellular vesicles are a biomarker for NAFLD resolution and response to weight loss surgery
Abstract
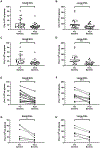
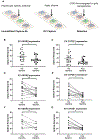
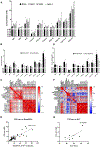
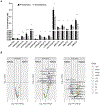
There is increasing interest in the development of minimally invasive biomarkers for the diagnosis and prognosis of NAFLD via extracellular vesicles (EV). Plasma EVs were isolated by differential ultracentrifugation and quantified by nanoparticle tracking analysis from pre (n = 28) and post (n = 28) weight loss patients. In the pre weight loss group 22 had NAFLD. Nanoplasmon enhanced scattering (nPES) of gold nanoparticles conjugated to hepatocyte-specific antibodies was employed to identify hepatocyte-specific EVs. Complex lipid panel and targeted sphingolipids were performed. Logistic regression analysis was used to identify predictors of NAFLD. Plasma levels of EVs and hepatocyte-derived EVs are dynamic and decrease following NAFLD resolution due to weight loss surgery. Hepatocyte-derived EVs correlate with steatosis in NAFLD patients and steatosis and inflammation in NASH patients. Plasma levels of small EVs correlate with EV sphingolipids in patients with NASH. Hepatocyte-derived EVs measured by the nPES assay could serve as a point-of-care test for NAFLD.
Keywords: Bariatric surgery; Exosome; Fatty liver; Sphingolipid.
Copyright © 2021 Elsevier Inc. All rights reserved.
Conflict of interest statement
Conflict of interest: The authors declare that they have no conflict of interest.
Figures


Similar articles
-
Hepatocyte-derived extracellular vesicles promote endothelial inflammation and atherogenesis via microRNA-1.J Hepatol. 2020 Jan;72(1):156-166. doi: 10.1016/j.jhep.2019.09.014. Epub 2019 Sep 27. J Hepatol. 2020. PMID: 31568800
-
Circulating microRNA‑135a‑3p in serum extracellular vesicles as a potential biological marker of non‑alcoholic fatty liver disease.Mol Med Rep. 2021 Jul;24(1):498. doi: 10.3892/mmr.2021.12137. Epub 2021 May 6. Mol Med Rep. 2021. PMID: 33955511 Free PMC article.
-
Extracellular vesicles derived from fat-laden hepatocytes undergoing chemical hypoxia promote a pro-fibrotic phenotype in hepatic stellate cells.Biochim Biophys Acta Mol Basis Dis. 2020 Oct 1;1866(10):165857. doi: 10.1016/j.bbadis.2020.165857. Epub 2020 Jun 5. Biochim Biophys Acta Mol Basis Dis. 2020. PMID: 32512191
-
Extracellular Vesicles in the Development of the Non-Alcoholic Fatty Liver Disease: An Update.Biomolecules. 2020 Oct 30;10(11):1494. doi: 10.3390/biom10111494. Biomolecules. 2020. PMID: 33143043 Free PMC article. Review.
-
Extracellular vesicles in fatty liver disease and steatohepatitis: Role as biomarkers and therapeutic targets.Liver Int. 2023 Feb;43(2):292-298. doi: 10.1111/liv.15490. Epub 2022 Dec 30. Liver Int. 2023. PMID: 36462157 Review.
Cited by
-
Liquid Liver Biopsy for Disease Diagnosis and Prognosis.J Clin Transl Hepatol. 2023 Dec 28;11(7):1520-1541. doi: 10.14218/JCTH.2023.00040. Epub 2023 Jul 27. J Clin Transl Hepatol. 2023. PMID: 38161500 Free PMC article. Review.
-
A Comparative Proteomic Analysis of Extracellular Vesicles Associated With Lipotoxicity.Front Cell Dev Biol. 2021 Nov 4;9:735001. doi: 10.3389/fcell.2021.735001. eCollection 2021. Front Cell Dev Biol. 2021. PMID: 34805145 Free PMC article.
-
Extracellular vesicles as biomarkers for metabolic dysfunction-associated steatotic liver disease staging using explainable artificial intelligence.World J Gastroenterol. 2025 Jun 14;31(22):106937. doi: 10.3748/wjg.v31.i22.106937. World J Gastroenterol. 2025. PMID: 40539197 Free PMC article.
-
Extracellular Vesicles as Biomarkers in Liver Disease.Int J Mol Sci. 2022 Dec 19;23(24):16217. doi: 10.3390/ijms232416217. Int J Mol Sci. 2022. PMID: 36555854 Free PMC article. Review.
-
Extracellular vesicles as standard-of-care therapy: will fast-tracking the regulatory processes help achieve the goal?Regen Med. 2024 Dec;19(12):617-635. doi: 10.1080/17460751.2024.2442847. Epub 2024 Dec 17. Regen Med. 2024. PMID: 39688586 Review.
References
-
- Younossi ZM, Koenig AB, Abdelatif D, Fazel Y, Henry L, Wymer M. Global epidemiology of nonalcoholic fatty liver disease-meta-analytic assessment of prevalence, incidence, and outcomes. Hepatology 2016;64(1):73–84. - PubMed
-
- Younossi Z, Anstee QM, Marietti M, Hardy T, Henry L, Eslam M, et al.Global burden of NAFLD and NASH: trends, predictions, risk factors and prevention. Nat Rev Gastroenterol Hepatol 2018;15(1):11–20. - PubMed

